Direct Observation of Propagating Gigahertz Coherent Guided Acoustic Phonons in Free Standing Single Copper Nanowires
Abstract
We report on gigahertz acoustic phonon waveguiding in free standing single copper nanowires studied by femtosecond transient reflectivity measurements. The results are discussed on the basis of the semi-analytical resolution of the Pochhammer and Chree equation. The spreading of the generated Gaussian wave packet of two different modes is derived analytically and compared with the observed oscillations of the sample reflectivity. These experiments provide a unique way to independently obtain geometrical and material characterization. This direct observation of coherent guided acoustic phonons in a single nano-objet is also the first step towards nanolateral size acoustic transducer and comprehensive studies of the thermal properties of nanowires.
keywords:
copper nanowire; acoustic vibrations in nano-objects ; time-resolved spectroscopy; acoustic waveguide; guided phononsCNRS, UMR 7588, Institut des NanoSciences de Paris, F-75005, Paris, France \alsoaffiliation CNRS, UMR 7588, Institut des NanoSciences de Paris, F-75005, Paris, France \alsoaffiliation CNRS, UMR 7588, Institut des NanoSciences de Paris, F-75005, Paris, France \alsoaffiliation CNRS, UMR 7588, Institut des NanoSciences de Paris, F-75005, Paris, France
![[Uncaptioned image]](/html/1511.03035/assets/toc_entry_graphic.png)
During the last decade, nanoscale confinement has stimulated wide fundamental and technological interests in various fields such as photonics 1, electronics 2, chemistry 3 or biology 4, 5. The impact of size reduction down to the nanoscale on acoustic response also attracts considerable attention 6. Fundamental motivations include testing the validity of the classical continuum theory of elasticity at the nanoscale 7, 8. A better understanding of the phonon behavior in nanostructures is also crucial to design MEMS nanoresonators 9. Confinement deeply modifies the acoustic dispersion relations compared with the bulk counterpart. Such modifications strongly influences the thermal 10, 11 and electronic 12 properties of the nanostructures. Time resolved optical spectroscopy is now considered a powerful tool to address phonon properties in single nanoparticles. In such an approach, thermal expansion induced by fast lattice heating created by femtosecond laser absorption, is optically detected in transmission or reflection geometry in far or near field 13, 14, 15. Since the pioneer work of van Dijk et al. 16, which investigated the dynamic response of single gold nanospheres, a large variety of materials and particle shapes have been investigated including nanostructures 17, 18, 19, nanowires 20, 21, 22, nanorings 23, nanocubes 24, nanorods 25, 26 or dimer nanoparticules 27. These investigations revealed that the system’s vibration eigenmodes are strongly correlated with different parameters like size, shape, material and coupling with the surroundings. Recently, to circumvent the drawback linked to the breathing mode’s huge damping rate, which occurs due to the interaction between the nanostructure and the substrate, free standing nanowires have been investigated 21. The main advantage of this geometry lies in the obtention of resonators with high quality factors, thus allowing a better understanding of their elastic properties 28, 29. In parallel guided acoustic phonons inside nanowires emerge as promising candidates for nanoacoustic wave generation with nanoscale spotsize, which could prove useful to design nanodevices for three-dimensional noninvasive ultrasonic imaging 30 with nanometer resolutions. Confined 31 and propagating 32 acoustic waves have been reported recently in a single microfiber (with diameter ). However, up to now guided phonons modes propagation in nanowires has been adressed only for a bundle of GaN nanowires 33 and consequently the results were very sensitive to the inhomogeneous broadening of the acoustic features due to averaging on nanowires of different dimensions.
In this letter we provide evidence of the propagation of gigahertz coherent guided acoustic phonons in single free standing nanowires. Beyond the intrinsic novelty of this direct experimental observation on a single nano-object, the generation and detection of nanoacoustic waves emerge as a useful characterization tool. We first show that the experimental investigation of confined modes only allows the determination of the characteristic sound velocities and 111 is the longitudinal sound velocity, : is the transverse sound velocity. , and are the Young modulus, the Poisson ratio and the density of the material respectively., the radius of the wire has to be determined by an other characterization method such as Scanning Electron Microscopy (SEM). We then analyze the generation and propagation of coherent guided phonons in single copper nanowires. We are able to follow two phonon modes along the nanowire axis. We first observe the propagation of a gaussian wave packet corresponding to the propagation of a pure radial breathing mode of frequency around which exhibits a parabolic dispersion curve. A pulse, characteristic of an expansionnal mode associated with a linear dispersion curve is also observed. The observed oscillations of the sample reflectivity are compared to the predicted behavior in an infinite cylinder.
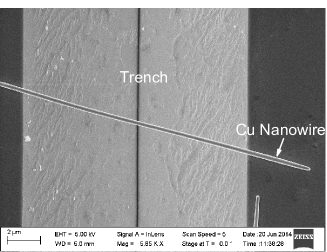
Since the last decade, many works have been devoted to time resolved spectroscopy on supported nanowires. More recently, free standing geometries have demonstrated a better acoustic confinement. Our polycrystalline copper nanowires are prepared by electrodeposition in etched ion-track membranes as described elsewhere 28, 34. In order to reduce the energy dissipation through the silicon substrate, the wires are dispersed on a silicon wafer structured with periodic trenches (Fig. 1) fabricated by lithography and anisotropic silicon etching 28. Ultrafast pump-probe spectroscopy experiments are performed using a mode-locked Ti:sapphire (MAI-TAI Spectra) laser source operating at with a pulse duration of at a repetition rate of . The pump beam is modulated at to perform synchronous detection on the sample reflectivity. Both pump and probe beams are focused by an objective with a and are normally incident on the sample. The probe beam is fixed on a XY piezoelectric stage such as it is laterally positionned with respect to the pump beam. To avoid scattered light coming from the pump beam, a two-color expriment is performed by doubling the pump frequency () with a nonlinear cystal. A dichroic filter located in front of the diode system suppresses the light of the pump beam, its power is reduced around and the power of the probe beam does not exceed . With such experimental conditions, we stay in the thermoelastic regime, the acoustic signal and the optical reflectivity remain stable during all the average processing. The reflectivity from the sample is measured by an avalanche photodiode and analyzed with a lock-in amplifier. A maximum pump-probe time delay equal to is achieved using a mobile reflector system mounted on a translation stage.
We investigate nanowires, whose diameter is around and whose total length exceeds , in the frame of the elasticity theory of waves developped by Pochhammer 35 and Chree 36. Our cylinders are considered as infinite given their large aspect ratio . Due to diffraction limitation, the pump laser spot size is larger than the nanowires diameter, leading to homogeneous dilatation. We thus consider no azimutal dependance of the modes in the following. Zero radial stress at the surface is the boundary condition for a free standing cylinder. Applying these conditions yields the following dispersion equation 37
| (1) |
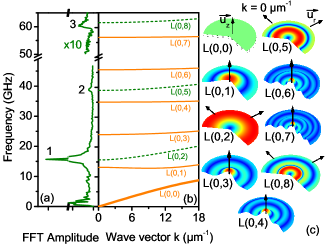
where and are respectively the spherical Bessel function of the first kind of order zero and one. The natural number is the order of the longitudinal axially symmetric mode, , according to Silk and Bainton naming convention 39. and . is the reduced pulsation , is the reduced wave number and is a material parameter which exclusively depends of the Poisson ratio of the material : . The dispersion curves of the first nine dilatational modes of a diameter copper nanowire with a circular cross section are calculated numerically and reproduced in Fig.2b. At infinite wavelength (), equation (1) can be simplified as
| (2) |
It can be shown that the roots of define modes with a purely axial displacement field. The roots of the second factor define the well-known breathing modes with a purely radial displacement field. The displacement field distributions of some of these modes are depicted in Fig.2c.
The frequency signature obtained on a single free standing diameter copper nanowire with pump and probe superimposed is depicted in Fig.2a. In an infinite wire, excitation and detection mechanisms essentially favor modes exhibiting large radial displacements 21. Taking advantage of the huge acoustic confinement, the signal exhibits a complex structure composed of the fundamental breathing mode around , and its two first harmonics located at and . Using this rich vibrational behavior, one can then expect to determine the three nanowire properties by solving this non linear inverse problem. However, it doesn’t matter how many breathing mode frequencies are experimentally determined since the are homogeneous function of order zero : with . When a solution is found, there is no unicity. One has to determine the dilatation factor with an other set of measurements. For instance, can be determined using SEM or Atomic Force Microscopy. Our SEM measurements give us a nanowire diameter which allows an estimation of the velocity, equal to and for longitudinal and transverse waves respectively, in good adequation with the copper elastic constants 38. However, finding a single nano-object previously studied by femtosecond transient reflectometry under SEM often results in a very tedious and unfruitful task. Consequently, a means to characterize the material and geometrical properties of nanowires completely with picosecond acoustic measurement remains to be found.
In the following, we show that the determination of the three nanowire properties can be adressed by the experimental observation of propagating acoustic nanowaves corresponding to the and modes. It can be demonstrated that, in the case of , the first order development of the dispersion relation around is with . We also demonstrated that the development of the dispersion equation around of the first radial breathing mode that verifies is parabolic : with
| (3) |
where . The time and space evolution of a wave packet resulting from a propagation with linear and parabolic dispersion relation is calculated, and the general form is chosen. Assuming a gaussian pump beam with diameter at and a uniform radial dilation of the nanowire at and , the initial deformation is . As we do not provide physical insight on the excitation mechanism, we suppose no mode dependence in the excitation amplitude. According to this zero order approximation, each mode is excited with the same unitary amplitude, leading to . We notice that only wave numbers verifying , that is to say , are excited with significant amplitude. Such a low amplitude should lead to a small dependance in the excitation amplitude of each mode which justifies the above approximation. Each mode propagates as a plane-wave along the axis of the wire resulting in the following gaussian wave packet
| (4) | |||||
| (5) |
As the detection is achieved at using a gaussian probe beam, with diameter at , a convolution with is applied. Finally, the experimental signal at a distance from the pump beam may be assumed to be proportional to the real part of the following equation
| (6) | |||||
| (7) |
We can also extract the envelop of the gaussian wave packet with the modulus of . In the following, we will discuss the experimental results in the light of this analytical expression. Considering the mode, we will take , , . Considering the mode, the parameter values will be , , .
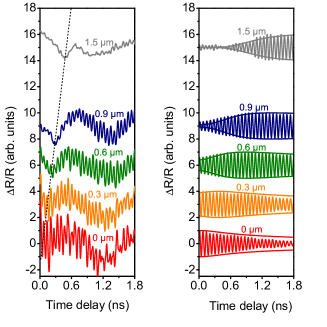
In order to be sensitive to the propagation phenomenon, the pump and probe beams have to be separated using an experimental setup which allows to tilt the probe before the last objective lens 23. The transient reflectivity obtained on a single free standing diameter copper nanowire, with pump-probe separation ranging from to , is presented in Fig. 3. The distance labeled above each curve is the pump-probe separation . At small pump-probe separation, the signal is mainly composed of a high-frequency signature at which corresponds to the first radial breathing mode. As the pump-probe separation increases, this high-frequency wave-packet shifts to a longer time delay as expected for a propagation guided along the nanowire axis. However, this signal suffers strong attenuation which results in a poor signal-to-noise ratio at large pump-probe separations. To get rid of the attenuation and to increase the signal-to-noise ratio at large pump-probe separation, the signal is normalized to and a band-pass filter centered at is applied. The resulting signal is ploted in Fig. 3b. The strong dispersion of this mode is clearly revealed. The solid line envelop calculated analytically with a purely parabolic dispersion relation : , , , and , fits very well with the whole set of experimental results. It is remarkable that the extracted value is the numerical result of with , and , which are the values obtained experimentally using the breathing mode at and the SEM measurements. Furthermore, a close inspection of figure 3 reveals that a signal deformation appears at with a probe delay of and propagates through with a probe delay of . This signature can be associated to the mode. It is interesting to note that the displacement field distribution of mode at an infinite wavelength calculated with three dimensional FEM presents no radial displacement explaining its absence when the pump and probe are superimposed. On the contrary, the displacement field distribution of mode at calculated with three dimensional FEM shows a significant radial displacement. Therefore, this mode will be more easily detected with small pump and probe beams which provide a large wave vector distribution. We are then able to detect this mode when the pump-probe spatial separation inscreases. To further investigate this signal, we explore larger pump-probe spatial separation as reported in Fig. 4.
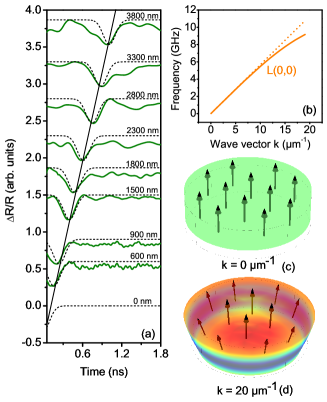
This transient reflectivity signal is obtained on a single free standing diameter copper nanowire with a time integration constant that acts as a low-pass filter and increases the signal-to-noise ratio dramatically, which is much needed at distances as large as . Signals are normalized to to get rid of the attenuation which is not taken into acount in our theorical model. The distance label above each curve corresponds to the pump-probe separation . The dotted line is calculated analytically with , , , and . Such a best fit value is consistant with . Unlike the complex expression of the parabolic coefficient of the mode and the resulting complex spreading of the gaussian wave-packet in Fig. 3, this mode provides a unique way to get the Young modulus of a material independently of any geometrical dimensions. Simple and precise reading of the deformation maximum’s propagation velocity gives direct access to the Young modulus. Finally, measuring , and gives : , and . These values are in good agreement both with copper elastic constants and SEM measurements.
In summary, we have investigated the propagation of two guided modes in single free standing copper nanowires. By considerably reducing the relaxation channel towards the substrate, the suspended nanowires provide a unique tool to observe the propagation of gigahertz coherent acoustic waves with spatial separations between generation and detection as large as . A rigorous approach allows us to assign the main components of the reflectometry signal to a precise acoustic mode. These experimental observations also lead to two equations that accurately complete the set of equations at infinite wavelength thus allowing the determination of elastic properties as well as the geometrical radius of the nanowire. Beyond this new way to achieve material and geometrical characterization through picosecond acoustic experiment, this study paves the way to use nanowires as nanometric lateral size acoustic transducers.
References
- Maier et al. 2001 Maier, S. A.; Brongersma, M. L.; Kik, P. G.; Meltzer, S.; Requicha, A. A. G.; Atwater, H. A. Plasmonics – A Route to Nanoscale Optical Devices. Adv. Mat. 2001, 13, 1501–1505
- Chang et al. 2007 Chang, D. E.; Sørensen, A. S.; Demler, E. A.; Lukin, M. D. A Single-Photon Transistor Using Nanoscale Surface Plasmons. Nat. Phys. 2007, 3, 807–812
- Novo et al. 2008 Novo, C.; Funston, A. M.; Mulvaney, P. Direct Observation of Chemical Reactions on Single Gold Nanocrystals Using Surface Plasmon Spectroscopy. Nat. Nano. 2008, 3, 598–602
- Huang et al. 2006 Huang, X.; El-Sayed, I. H.; Qian, W.; El-Sayed, M. A. Cancer Cell Imaging and Photothermal Therapy in the Near-Infrared Region by Using Gold Nanorods. J. Am. Chem. Soc. 2006, 128, 2115–2120
- Hirsch et al. 2003 Hirsch, L. R.; Stafford, R. J.; Bankson, J. a.; Sershen, S. R.; Rivera, B.; Price, R. E.; Hazle, J. D.; Halas, N. J.; West, J. L. Nanoshell-Mediated Near-Infrared Thermal Therapy of Tumors under Magnetic Resonance Guidance. P. Natl. Acad. Sci. USA 2003, 100, 13549–54
- Major et al. 2014 Major, T. A.; Lo, S. S.; Yu, K.; Hartland, G. V. Time-Resolved Studies of the Acoustic Vibrational Modes of Metal and Semiconductor Nano-objects. J. Phys. Chem. Lett. 2014, 5, 866–874
- Liang et al. 2005 Liang, H.; Upmanyu, M.; Huang, H. Size-Dependent Elasticity of Nanowires: Nonlinear Effects. Phys. Rev. B 2005, 71, 241403
- Juvé et al. 2010 Juvé, V.; Crut, A.; Maioli, P.; Pellarin, M.; Broyer, M.; Del Fatti, N.; Vallée, F. Probing Elasticity at theNanoscale: Terahertz Acoustic Vibration of Small Metal Nanoparticles. Nano Lett. 2010, 10, 1853–8
- Feng et al. 2007 Feng, X. L.; He, R.; Yang, P.; Roukes, M. L. Very High Frequency Silicon Nanowire Electromechanical Resonators. Nano Lett. 2007, 7, 1953–1959
- Mingo et al. 2003 Mingo, N.; Yang, L.; Li, D.; Majumdar, A. Predicting the Thermal Conductivity of Si and Ge Nanowires. Nano Lett. 2003, 3, 1713–1716
- Boukai et al. 2008 Boukai, A. I.; Bunimovich, Y.; Tahir-Kheli, J.; Yu, J.-K.; Goddard, W. A.; Heath, J. R. Silicon Nanowires as Efficient Thermoelectric Materials. Nature 2008, 451, 168–71
- Bannov et al. 1995 Bannov, N.; Aristov, V.; Mitin, V.; Stroscio, M. A. Electron relaxation Times Due to the Deformation-PotentialInteraction of Electrons with Confined Acoustic Phonons in a Free-Standing Quantum Well. Phys. Rev. B 1995, 51, 9930–9942
- Thomsen et al. 1986 Thomsen, C.; Grahn, H. T.; Maris, H. J.; Tauc, J. Surface Generation and Detection of Phonons by Picosecond Light Pulses. Phys. Rev. B 1986, 34, 4129–4138
- Siry et al. 2003 Siry, P.; Belliard, L.; Perrin, B. Picosecond Acoustics with Very High Lateral Resolution. Acta Acust. United Ac. 2003, 89, 925–929
- Vertikov et al. 1996 Vertikov, A.; Kuball, M.; Nurmikko, A. V.; Maris, H. J. Time-Resolved Pump-Probe Experiments with Subwavelength Lateral Resolution. Applied Physics Letters 1996, 69, 2465
- van Dijk et al. 2005 van Dijk, M.; Lippitz, M.; Orrit, M. Detection of Acoustic Oscillations of Single Gold Nanospheres by Time-Resolved Interferometry. Phys. Rev. Lett. 2005, 95, 267406
- Burgin et al. 2008 Burgin, J.; Langot, P.; Del Fatti, N.; Vallée, F.; Huang, W.; El-Sayed, M. A. Time-Resolved Investigation of the Acoustic Vibration of a Single Gold Nanoprism Pair. J. Phys. Chem. C 2008, 112, 11231–11235
- Bienville et al. 2006 Bienville, T.; Robillard, J. F.; Belliard, L.; Roch-Jeune, I.; Devos, A.; Perrin, B. Individual and Collective Vibrational Modes of Nanostructures Studied by Picosecond Ultrasonics. Ultrasonics 2006, 44 Suppl 1, e1289–94
- Amziane et al. 2011 Amziane, A.; Belliard, L.; Decremps, F.; Perrin, B. Ultrafast Acoustic Resonance Spectroscopy of Gold Nanostructures: Towards a Generation of Tunable Transverse Waves. Phys. Rev. B 2011, 83, 014102
- Staleva and Hartland 2008 Staleva, H.; Hartland, G. V. Vibrational Dynamics of Silver Nanocubes and Nanowires Studied by Single-Particle Transient Absorption Spectroscopy. Adv. Funct. Mater. 2008, 18, 3809–3817
- Major et al. 2013 Major, T. A.; Crut, A.; Gao, B.; Lo, S. S.; Del Fatti, N.; Vallée, F.; Hartland, G. V. Damping of the Acoustic Vibrations of a Suspended Gold Nanowire in Air and Water Environments. Phys. Chem. Chem. Phys. 2013, 15, 4169–76
- Staleva et al. 2009 Staleva, H.; Skrabalak, S. E.; Carey, C. R.; Kosel, T.; Xia, Y.; Hartland, G. V. Coupling to Light, and Transport and Dissipation of Energy in Silver Nanowires. Phys. Chem. Chem. Phys. 2009, 11, 5889–5896
- Kelf et al. 2011 Kelf, T. A.; Tanaka, Y.; Matsuda, O.; Larsson, E. M.; Sutherland, D. S.; Wright, O. B. Ultrafast Vibrations of Gold Nanorings. Nano Lett. 2011, 11, 3893–3898
- Staleva and Hartland 2008 Staleva, H.; Hartland, G. V. Transient Absorption Studies of Single Silver Nanocubes. J. Phys. Chem. C 2008, 112, 7535–7539
- Cardinal et al. 2012 Cardinal, M. F.; Mongin, D.; Crut, A.; Maioli, P.; Rodríguez-González, B.; Pérez-Juste, J.; Liz-Marzán, L. M.; Del Fatti, N.; Vallée, F. Acoustic Vibrations in Bimetallic Au@Pd Core-Shell Nanorods. J. Phys. Chem. Lett. 2012, 3, 613–619
- Zijlstra et al. 2008 Zijlstra, P.; Tchebotareva, A. L.; Chon, J. W.; Gu, M.; Orrit, M. Acoustic Oscillations and Elastic Moduli of Single Gold Nanorods. Nano Lett. 2008, 8, 3493–3497
- Jais et al. 2011 Jais, P. M.; Murray, D. B.; Merlin, R.; Bragas, A. V. Metal Nanoparticle Ensembles: Tunable Laser Pulses Distinguish Monomer from Dimer Vibrations. Nano Lett. 2011, 11, 3685–3689
- Belliard et al. 2013 Belliard, L.; Cornelius, T. W.; Perrin, B.; Kacemi, N.; Becerra, L.; Thomas, O.; Eugenia Toimil-Molares, M.; Cassinelli, M. Vibrational Response of Free Standing Single Copper Nanowire Through Transient Reflectivity Microscopy. J. Appl. Phys. 2013, 114, 193509
- Ristow et al. 2013 Ristow, O.; Merklein, M.; Grossmann, M.; Hettich, M.; Schubert, M.; Bruchhausen, A.; Grebing, J.; Erbe, A.; Mounier, D.; Gusev, V. et al. Ultrafast spectroscopy of super high frequency mechanical modes of doubly clamped beams. Appl. Phys. Lett. 2013, 103, 233114
- Lin et al. 2006 Lin, K.-H.; Yu, C.-T.; Sun, S.-Z.; Chen, H.-P.; Pan, C.-C.; Chyi, J.-I.; Huang, S.-W.; Li, P.-C.; Sun, C.-K. Two-Dimensional Nanoultrasonic Imaging by Using Acoustic Nanowaves. Appl. Phys. Lett. 2006, 89, 043106
- Mounier et al. 2014 Mounier, D.; Poilâne, C.; Khelfa, H.; Picart, P. Sub-Gigahertz Laser Resonant Ultrasound Spectroscopy for the Evaluation of Elastic Properties of Micrometric Fibers. Ultrasonics 2014, 54, 259–67
- Khelfa et al. 2014 Khelfa, H.; Mounier, D.; Poilâne, C.; Picart, P. Détermination Expérimentale des Courbes de Dispersion des Modes Guidés se Propageant le Long d’une Fibre Cylindrique Micrométrique. 14ème Congrès Français d’Acoustique 2014, 1225–1231
- Mante et al. 2013 Mante, P.-A.; Wu, Y.-C.; Lin, Y.-T.; Ho, C.-Y.; Tu, L.-W.; Sun, C.-K. Gigahertz Coherent Guided Acoustic Phonons in AlN/GaN Nanowire Superlattices. Nano lett. 2013, 13, 1139–44
- Molares et al. 2001 Molares, M. T.; Buschmann, V.; Dobrev, D.; Neumann, R.; Scholz, R.; Schuchert, I. U.; Vetter, J. Single-Crystalline Copper Nanowires Produced by Electrochemical Deposition in Polymeric Ion Track Membranes. Adv. Mater 2001, 13, 62–65
- Pochhammer 1876 Pochhammer, L. Über die Fortpflanzungsgeschwindigkeiten kleiner Schwingungen in einem Unbegrenzten Isotropen Kreiszylinder. J. Reine Angew. Math. 1876, 81, 324
- Chree 1889 Chree, C. The Equations of an Isotropic Elastic Solid in Polar and Cylindrical Coordinates, their Solutions and Applications. Trans. Cambridge Phil. Soc. 1889, 14, 250
- Royer and Dieulesaint 2000 Royer, D.; Dieulesaint, E. Elastic Waves in Solids I : Free and Guided Propagation; Springer-Verlag, New York, 2000
- Ledbetter and Naimon 1974 Ledbetter, H.; Naimon, E. Elastic properties of metals and alloys. II. Copper. J. Phys. Chem. Ref. Data 1974, 3, 897–935
- Silk and Bainton 1979 Silk, M.; Bainton, K. The propagation in metal tubing of ultrasonic wave modes equivalent to Lamb waves. Ultrasonics 1979, 17, 11–19