Hiding in plain view: Colloidal self-assembly from polydisperse populations
Abstract
We report small-angle x-ray scattering (SAXS) experiments on aqueous dispersions of colloidal silica with a broad monomodal size distribution (polydispersity 14%, size nm). Over a range of volume fractions the silica particles segregate to build first one, then two distinct sets of colloidal crystals. These dispersions thus demonstrate fractional crystallization and multiple-phase (bcc, Laves AB2, liquid) coexistence. Their remarkable ability to build complex crystal structures from a polydisperse population originates from the intermediate-range nature of interparticle forces, and suggests routes for designing self-assembling colloidal crystals from the bottom-up.
What is the preferred structure for a population of colloidal particles, dispersed in liquid? This simple question has been satisfactorily answered only in the case of spherical particles that are effectively monodisperse in size Kose et al. (1973); Pusey and van Megen (1986); Pusey et al. (2009); Poon (2015); Monovoukas and Gast (1989); Russel et al. (1989). As the volume fraction of particles increases, there is a well-defined transition from a liquid to a crystal state. Two types of structures can be found, close-packed and body-centered cubic crystals; the preferred form depends on the range of interparticle forces Monovoukas and Gast (1989); Russel et al. (1989); Yethiraj and van Blaaderen (2003).
Polydisperse populations are a tougher problem. In one limit, for particles that interact as hard spheres, crystalline order is destroyed by even small amounts of polydispersity Pusey (1987); Pusey et al. (2009); Poon (2015); Williams et al. (2001); Schöpe et al. (2006a). Charged particles interact instead via soft potentials, and are more tolerant of polydispersity, especially where they have an effectively narrow size distribution, due to long-range interactions. In this other limit a crystal state can be retained at low volume fractions regardless of significant size polydispersity, if the interaction polydispersity remains low Leunissen et al. (2007); Russel et al. (1989); Lorenz et al. (2009). Between these two limits is a vast region of phase space where we do not know whether homogeneous crystallization or fractionated crystallization are possible.
Here we address the self-organization of polydisperse populations of particles that interact through forces with an intermediate range, comparable to the variations in particle size. Using high-resolution scattering methods, we find that such populations can evolve through fractionated crystallization to yield coexisting crystals with different structures. These crystals can have large, complex unit cells with specific sites for particles of different sizes. To explain this result, we use numerical simulations to demonstrate how a broad distribution of particles can split spontaneously into different types of crystals, which cooperate to make the best use of the whole population.
The colloids that we have used are industrially produced. They consist of nanometric silica particles, dispersed in water (Ludox HS40). The particles are roughly spherical with an average radius of 8 nm and a size polydispersity of 0.14 Goertz et al. (2009); Li et al. (2012). We used near-equilibrium dialysis to equilibrate them against NaCl solutions (5 mM, pH 9.5). They were then slowly concentrated by addition of poly(ethylene glycol) to the solution outside the dialysis membranes, as in Jönsson et al. (2011); Li et al. (2012). Under these conditions the particles repel each other via a screened electrostatic interaction, with a Debye length of 2.5-4.5 nm, depending on their volume fraction . Further details of our methods, and the dispersion properties (e.g. charge, equation of state, density), are given as supplemental information SI .
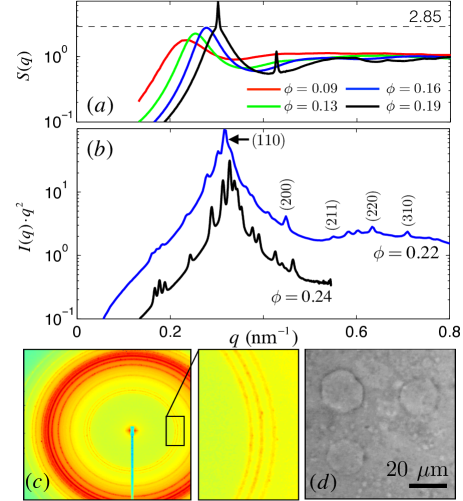
Samples were characterized through small-angle x-ray scattering (SAXS), using ID02 at ESRF. The strength of ordering in a colloidal dispersion can be evaluated by the height, , of the main peak of its effective structure factor , for scattering vector Verlet (1968); Hansen and Verlet (1969); van Beurten and Vrij (1981). was found by dividing the radially-averaged scattering intensity by the form factor of a dilute () dispersion, and normalizing at high , as in D Aguanno and Klein (1991); van Beurten and Vrij (1981); Pedersen (1994); Li et al. (2012). For low these had a broad main peak, indicative of disordered liquid arrangements of particles (Fig. 1a). Indeed, all these samples also behaved rheologically as fluids. The value of (Table 1) rose slowly with increasing , from 1.2 at = 0.04, to 2.6 at = 0.16. Despite our polydispersity, which should lower slightly D Aguanno and Klein (1991); van Beurten and Vrij (1981), and add a low- incoherent scattering D Aguanno and Klein (1991); Pedersen (1994), these values agree well with the Hayter-Penfold MSA model Hayter and Penfold (1981) of monodisperse Yukawa spheres (Table 1, using 8 nm particles with 5 mM salt and a surface charge of 170 ).
| (liq.) | (MSA) | Phases | |
|---|---|---|---|
| 0.038 | 1.2 | 1.33 | liquid |
| 0.046 | 1.4 | 1.40 | liquid |
| 0.057 | 1.5 | 1.50 | liquid |
| 0.067 | 1.6 | 1.58 | liquid |
| 0.079 | 2.2 | 1.69 | liquid |
| 0.085 | 1.8 | 1.74 | liquid |
| 0.128 | 2.2 | 2.12 | liquid |
| 0.131 | 2.1 | 2.15 | liquid |
| 0.159 | 2.7 | 2.42 | liquid |
| 0.161 | 2.5 | 2.44 | liquid |
| 0.188 | – | 2.72 | liquid, bcc |
| 0.207 | – | 2.94 | liquid, bcc |
| 0.219 | – | 3.08 | liquid, bcc, Laves |
| 0.235 | – | 3.28 | liquid, bcc, Laves |
| 0.240 | – | 3.35 | liquid, bcc, Laves |
At = 0.19 and 0.21 we found that the 2D interference patterns of our dispersions also contained sharp diffraction spots, superimposed on the liquid-like scattering ring. The spots are the powder-diffraction pattern of small crystallites. Here any fractionation between the liquid and crystals would invalidate the decomposition of into a form factor and effective structure factor. Instead, we calculated the complex structure factor , which does not require knowledge of the form factors of each phase. The positions of the peaks of , as well as systematic extinctions ( odd), indicated that they originated from colloidal crystals with a body-centered cubic (bcc) structure. This is in empirical agreement with liquid state theory, where, according to Verlet and Hansen Verlet (1968); Hansen and Verlet (1969), the liquid state with short-range order is unstable with respect to a crystalline structure when . However, our dispersions were quite polydisperse, while the Verlet-Hansen criterion is strictly true only for monodisperse populations. Our observations suggest a possible reason why this agreement may still hold. It involves growing the bcc crystals from a narrow subset (i.e. an effectively monodisperse set) of the original population, and leaving the remaining particles in a liquid phase that coexists with these crystals.
As the dispersions were compressed to higher , between , their scattering spectra became more complex. The interference patterns of these dispersions revealed a large number of spotty rings (Fig. 1c). Typically hundreds of spots were seen, whose diameters, nm-1, imply the presence of many crystallites with a diameter of at least m. Microscope images (Fig. 1d) of such dispersions confirm the presence of stable free-floating crystals.
In these spectra we detected, after radial averaging, a broad liquid peak, peaks from the bcc phase, and up to 14 additional well-resolved peaks, including a triplet at low , implying the presence of a crystal phase with a large unit cell. The new peaks can all be indexed (see Table 2 and Supplemental Info SI ) to the powder spectrum of a crystalline phase of compact hexagonal (P63/mmc) symmetry, with lattice constants = 43.58 nm and , and a unit cell volume of nm3, in the sample. In the same sample the bcc peaks were indexed to a unit cell with lattice constant = 27.11 nm and volume nm3. The unit cell volume of the new phase is therefore 5.9 times larger than that of the co-existing bcc phase, which contains 2 particle sites per cell. Assuming that the number density of sites is comparable in both phases, which in conditions of close equilibrium and not too large fractionation is reasonable, one finds that the new phase has 12 particles per unit cell.
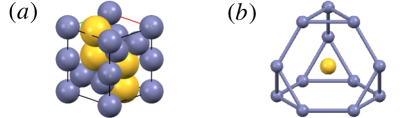
One can reasonably expect that this phase is constituted by a mixture of nanoparticles with distinct mean diameters. Among the varied options Filion and Dijkstra (2009) only one is of the compact hexagonal space group and contains 12 atoms per unit cell: the MgZn2 Laves phase. Here four Mg atoms are on the four equivalent Wyckoff positions, while eight Zn atoms are distributed on the six and two positions. This suggests that the new phase is composed of particles with two or three separate sizes organized into a Laves phase Berry and Raynor (1953). Within this hypothesis, the intensities of the Bragg peaks were fit with three free parameters corresponding to the radii , and of particles at the , , and sites (see supplementary information SI ). The fit, the results of which are shown in Table 2, converges when nm and nm. The stoichiometry is consequently AB2 with four large particles and eight small particles per unit cell. The larger particles occupy relatively spacious truncated tetrahedron environments, where they are comfortably surrounded by rings of smaller particles in octahedral sites (Fig. 2). Irast to repulsive monodisperse crystals Pusey and van Megen (1986), the density of this Laves phase thus appears to be slightly lower (0.22) than that of the coexisting liquid (0.235); this situation could relate to the size selection of the individual sites.
Various AB2 phases are well-known in binary mixtures of hard spheres Bartlett et al. (1992); Schofield et al. (2005); Sanders (1980); Murray and Sanders (1980); Shevchenko et al. (2005); Hynninen et al. (2007). For example, the AlB2 structure is a preferred crystal phase for binary mixtures with a size ratio of the smaller to the larger particles between about 0.4 and 0.6 Schofield et al. (2005) and occurs in gem opals Sanders (1980); Murray and Sanders (1980), while the MgCu2 phase can be templated by walls Hynninen et al. (2007). What we have shown, however, is that similar phases also naturally arise in the solidification of broad and continuous populations of nanoparticles.
| (nm-1) | (nm-1) | ||||
|---|---|---|---|---|---|
| 0 0 1 | 2 | not obs. | 0.0883 | not obs. | 0 |
| 1 0 0 | 6 | 0.1667 | 0.1665 | 12.9 | 12.9 |
| 0 0 2 | 2 | 0.1769 | 0.1766 | 26.9 | 21.6 |
| 1 0 1 | 12 | 0.1885 | 0.1884 | 9.0 | 12.0 |
| 1 0 2 | 12 | 0.2431 | 0.2427 | 18.1 | 21.9 |
| 0 0 3 | 2 | not obs. | 0.2648 | not obs. | 0 |
| 1 1 0 | 6 | 0.2891 | 0.2883 | 84.3 | 84.3 |
| 1 1 1 | 12 | not obs. | 0.3015 | not obs. | 0 |
| 1 0 3 | 12 | 0.3132 | 0.3128 | 98.2 | 79.4 |
| 2 0 0 | 6 | 0.3329 | 0.3329 | 52.4 | 42.3 |
| 1 1 2 | 12 | 0.3378 | 0.3381 | 73.7 | 87.6 |
| 2 0 1 | 12 | 0.3441 | 0.3444 | 57.5 | 76.2 |
| 0 0 4 | 2 | 0.3530 | 0.3531 | 86.2 | 84.8 |
| 2 0 2 | 12 | 0.3767 | 0.3768 | 29.1 | 32.1 |
| 1 0 4 | 12 | 0.3903 | 0.3904 | 25.8 | 25.8 |
| 1 1 3 | 12 | not obs. | 0.3915 | not obs. | 0 |
| 2 0 3 | 12 | 0.4256 | 0.4254 | 19.6 | 18.2 |
| 2 1 0 | 12 | 0.4402 | 0.4404 | 8.4 | 10.0 |
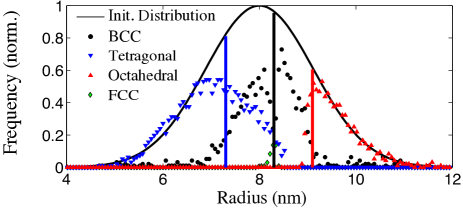
An explanation for the coexistence of different crystal types, each composed of a subset of particle radii, can be made by seeking the equilibrium phases of the particle population. To this end we investigated the fractionation of polydisperse charged particles through Gibbs-ensemble Monte-Carlo numerical simulations Panagiotopoulos et al. (1988) of a combination of a Laves MgZn2 phase and a bcc phase, with an fcc phase added as a control. The model is similar to that in Botet et al. (2016). Each phase was treated as an isolated volume (avoiding grain boundaries), but particles could move randomly between sites within each phase, and between phases, according to a Monte-Carlo Metropolis algorithm at room temperature Landau and Binder (2000). Although, for simplicity of demonstration, no colloidal liquid was modeled, we would expect such a phase to act as the medium of particle exchange, and an acceptor of misfit particles. The proportions of particles and the lattice constants of the three phases were allowed to vary with volume exchange between them, keeping the total volume constant.
We considered a model of 22466 particles with a Gaussian distribution of sizes , an average radius of 8 nm and a polydispersity of 0.14 Goertz et al. (2009), with a global . Interactions between particles were modeled as hard core plus Yukawa pair-potentials, with an effective Debye length of nm and effective surface charge density of 0.2 /nm2 (i.e. the charge on particle scales as ). These parameters are estimated as in Alexander et al. (1984); Belloni (1998); Trizac et al. (2003), accounting for modest charge renormalization, and agree with the dispersion’s experimentally determined equation of state Jönsson et al. (2011); Li et al. (2015).
Over time, the system evolved to find a configuration of minimal Madelung energy, and the proportion of each phase stabilized; Fig. 3 shows the final distribution of particle sizes, according to phases and sites. It shows how the coexistence of a Laves phase with the bcc phase is possible: the bcc phase uses the most populated part of the distribution of particle sizes, near the centre of the distribution. In this example a small minority of particles was also taken into the fcc phase, although this phase disappears if a longer screening length (3 nm) is used. In either case, the remaining particles have a bimodal size distribution and thus fit efficiently into the differently shaped sites of the Laves phase. Exploring different parameter values, we found that these results were robust to doubling the charge density of the particles, or letting their charge scale with (as occurs for strong charge condensation Garbow et al. (2004)), but sensitive to changes to the effective screening length (between 2.2 and 3.0 nm). The model’s average radii of 7.0, 8.2, and 9.6 nm, for particles at equilibrium in the Laves tetragonal sites, bcc sites, and Laves octahedral sites, respectively, correspond well to the corresponding experimental values of 7.3, 8.3, and 9.1 nm.
We have thus described how a polydisperse population can split into coexisting phases of a colloidal liquid, a bcc crystal that preferentially selects the most abundant particle sizes, and a Laves phase that accommodates the remaining bimodal distribution of particles. This segregation by particle size is known as fractionated crystallization; similar processes are known in molecular systems Timms (2005), including geochemistry Ghiorso (1985). For hard-sphere colloids fractionation has been predicted beyond a terminal polydispersity of about 6% Bartlett (1998, 2000); Fasolo and Sollich (2003); Sollich and Wilding (2010); Bolhuis and Kofke (1996). For medium-range Yukawa interactions ( between 2.5-10), recent simulations van der Linden et al. (2013) have suggested that a size polydispersity of 10-15%, comparable to ours, is required to hinder crystallization, and thus potentially trigger fractionation.
Experimentally the best prior evidence of colloidal fractionation is the work of van Megen and collaborators Martin et al. (2003); Schöpe et al. (2006b, a), who invoke it to explain the nucleation processes of colloidal crystals near a terminal polydispersity. The coexistence of multiple solid phases is also known in cases of low-dimensional systems such as platelets Byelov et al. (2010) or particles confined to a plane Geerts et al. (2010). Further evidence may also be hiding in old data such as Fig. 13 of Ref. Chang et al. (1995), which appears to imply the presence of large-unit-cell crystals in dispersions similar to ours (10.2 nm silica with 9% size polydispersity).
The fractionation of particles in our experiments depends on their intermediate range of interactions. Much work on colloidal crystals is performed with particles that interact as hard spheres, and which crystallize when they are in close to direct contact, at . When such particles have a broad distribution of sizes, then the unavoidable overlaps of any large adjacent particles inhibit the formation of a structure with long-range order Pusey (1987); Pusey et al. (2009); Bolhuis and Kofke (1996); Poon (2015), and dynamic arrest turns the dispersion into a glass Pusey (1987); Pusey and van Megen (1986). Our particles interact instead through soft potentials. Assuming an effective Yukawa potential Alexander et al. (1984); Belloni (1998); Trizac et al. (2003), the pair-potential of two average-sized particles reaches about 3 kT at a volume fraction of 20%, corresponding to a surface separation (for bcc) of 8 nm. In this state, overlap of the particles themselves is still a rare occurrence, determined by the frequency of very large particles. These few “outliers” can easily be rejected away from the surfaces of growing crystals, as the soft potentials also keep the mobility of such particles high.
The width of the particle size distribution and the range of particle interactions together control the frequency of such outliers, which are then available to build more diverse structures. We consider three cases. If the interactions are long range (effective diameter ), then variations in the particle size will be screened, and simple fcc or bcc crystals are both expected and seen Kose et al. (1973); Leunissen et al. (2007); Russel et al. (1989); Lorenz et al. (2009). If the interaction range is intermediate, for example , but the polydispersity is too high, then there will be too many overlaps to nucleate the first bcc crystals, and the dispersion may remain in a liquid or glass phase. Inverting Pusey’s criterion Pusey (1987) suggests that this will be the case when , where the order-1 constant depends on how tolerant a crystal is to overlaps. If, however, the effects of the soft potential and the number of overlaps are balanced against each other, as in this letter, then fractionation is encouraged, and the phase space of polydisperse colloidal dispersions is opened.
The behavior of such polydisperse nanometric dispersions points to directions that have not been explored so far, despite theoretical predictions Bolhuis and Kofke (1996); Fasolo and Sollich (2003); Fernández et al. (2007); Bartlett (1998); Sollich and Wilding (2010); van der Linden et al. (2013). We demonstrate here fractionated crystallization, with coexistence of at least three very different phases (liquid, bcc and Laves), and the formation of complex crystals that efficiently utilize the full size distribution. The link between the particle size distribution and the structures also gives us a scheme for generating even more complex phases through the crystallization of populations of particles with broader size distributions, provided that they interact through soft medium-range potentials. The variety of structures waiting to be discovered could be enormous, given that, within the limits defined above, there exists a huge phase space of different size distributions and interaction potentials to explore.
References
- Kose et al. (1973) A. Kose, M. Ozaki, K. Takano, Y. Kobayashi, and S. Hachisu, J. Colloid Interface Sci. 44, 330 (1973).
- Pusey and van Megen (1986) P. N. Pusey and W. van Megen, Nature 320, 340 (1986).
- Pusey et al. (2009) P. N. Pusey, E. Zaccarelli, C. Valeriani, E. Sanz, W. C. K. Poon, and M. E. Cates, Phil. Trans. R. Soc. A 367, 4993 (2009).
- Poon (2015) W. C. K. Poon, in The Oxford Handbook of Soft Condensed Matter, edited by E. M. Terentjev and D. A. Weitz (Oxford University Press, 2015) Chap. 1.
- Monovoukas and Gast (1989) Y. Monovoukas and A. P. Gast, J. Colloid Interface Sci. 128, 533 (1989).
- Russel et al. (1989) W. B. Russel, D. A. Saville, and W. R. Schowalter, Colloidal dispersions (Cambridge University Press, Cambridge, 1989) p. 525.
- Yethiraj and van Blaaderen (2003) A. Yethiraj and A. van Blaaderen, Nature 421, 513 (2003).
- Pusey (1987) P. N. Pusey, J. Physique (France) 48, 709 (1987).
- Williams et al. (2001) S. R. Williams, I. K. Snook, and W. van Megen, Phys. Rev. E 64, 021506 (2001).
- Schöpe et al. (2006a) H. J. Schöpe, G. Bryant, and W. van Megen, Phys. Rev. E 74, 060401 (2006a).
- Leunissen et al. (2007) M. E. Leunissen, A. van Blaaderen, A. D. Hollingsworth, M. T. Sullivan, and P. M. Chaikin, Proc. Nat. Acad. Sci. 104, 2585 (2007).
- Lorenz et al. (2009) N. J. Lorenz, H. J. Schöpe, H. Reiber, T. Palberg, P. Wette, I. Klassen, D. Holland-Moritz, D. Herlach, and T. Okubo, J. Phys.: Condens. Matter 21, 464116 (2009).
- Goertz et al. (2009) V. Goertz, N. Dingenouts, and H. Nirschl, Part. Part. Syst. Charact. 26, 17 (2009).
- Li et al. (2012) J. Li, B. Cabane, M. Sztucki, J. Gummel, and L. Goehring, Langmuir 28, 200 (2012).
- Jönsson et al. (2011) B. Jönsson, J. Persello, J. Li, and B. Cabane, Langmuir 27, 6606 (2011).
- (16) See Supplemental Material at [URL will be inserted by publisher] for an extended materials and methods section, and details of the powder spectra analyses.
- Verlet (1968) L. Verlet, Phys. Rev. 165, 201 (1968).
- Hansen and Verlet (1969) J.-P. Hansen and L. Verlet, Phys. Rev. 184, 151 (1969).
- van Beurten and Vrij (1981) P. van Beurten and A. Vrij, J. Chem. Phys. 74, 2744 (1981).
- D Aguanno and Klein (1991) B. D Aguanno and R. Klein, J. Chem. Soc. Faraday Trans. 87, 379 (1991).
- Pedersen (1994) J. S. Pedersen, J. Appl. Chryst. 27, 595 (1994).
- Hayter and Penfold (1981) J. B. Hayter and J. Penfold, Molec. Phys. 42, 109 (1981).
- Filion and Dijkstra (2009) L. Filion and M. Dijkstra, Phys. Rev. E 79, 046714 (2009).
- Berry and Raynor (1953) R. L. Berry and G. B. Raynor, Acta Cryst. 6, 178 (1953).
- Bartlett et al. (1992) P. Bartlett, R. H. Ottewill, and P. N. Pusey, Phys. Rev. Lett. 68, 3801 (1992).
- Schofield et al. (2005) A. B. Schofield, P. N. Pusey, and P. Radcliffe, Phys. Rev. E 72, 031407 (2005).
- Sanders (1980) J. V. Sanders, Phil. Mag. A 42, 705 (1980).
- Murray and Sanders (1980) M. J. Murray and J. V. Sanders, Phil. Mag. A 42, 721 (1980).
- Shevchenko et al. (2005) E. V. Shevchenko, D. V. Talapin, C. B. Murray, and S. O’Brien, J. Am. Chem. Soc. 128, 3620 (2005).
- Hynninen et al. (2007) A.-P. Hynninen, J. H. J. Thijssen, E. C. M. Vermolen, M. Dijkstra, and A. van Blaaderen, Nature Mat. 6, 202 (2007).
- Panagiotopoulos et al. (1988) A. Z. Panagiotopoulos, N. Quirke, M. Stapelton, and D. J. Tidesley, Mol. Phys. 63, 527 (1988).
- Botet et al. (2016) R. Botet, B. Cabane, L. Goehring, J. Li, and F. Artzner, Faraday Disc. Advance Article, 10.1039/C5FD00145E (2016).
- Landau and Binder (2000) D. Landau and K. Binder, A Guide to Monte Carlo Simulation in Statistical Physics (Cambridge University Press, 2000).
- Alexander et al. (1984) S. Alexander, P. M. Chaikin, P. Grant, G. J. Morales, P. Pincus, and D. Hone, J. Chem. Phys. 80, 5776 (1984).
- Belloni (1998) L. Belloni, Colloids Surf. A 140, 227 (1998).
- Trizac et al. (2003) E. Trizac, L. Bocquet, M. Aubouy, and H. H. von Grünberg, Langmuir 19, 4027 (2003).
- Li et al. (2015) J. Li, M. Turesson, C. A. Haglund, B. Cabane, and M. Skepö, Polymer 80, 205 (2015).
- Garbow et al. (2004) N. Garbow, M. Evers, T. Palberg, and T. Okubo, J. Phys. Cond. Matt. 16, 3835 (2004).
- Timms (2005) R. E. Timms, Europ. J. Lipid Sci. Tech. 107, 48 (2005).
- Ghiorso (1985) M. S. Ghiorso, Contrib. Mineral. Petrol. 90, 107 (1985).
- Bartlett (1998) P. Bartlett, J. Chem. Phys. 109, 10970 (1998).
- Bartlett (2000) P. Bartlett, Progr. Colloid Polym. Sci. 115, 137 (2000).
- Fasolo and Sollich (2003) M. Fasolo and P. Sollich, Phys. Rev. Lett. 91, 068301 (2003).
- Sollich and Wilding (2010) P. Sollich and N. B. Wilding, Phys. Rev. Lett. 104, 118302 (2010).
- Bolhuis and Kofke (1996) P. G. Bolhuis and D. A. Kofke, Phys. Rev. E 54, 634 (1996).
- van der Linden et al. (2013) M. N. van der Linden, A. van Blaaderen, and M. Dijkstra, J. Chem. Phys. 138, 114903 (2013).
- Martin et al. (2003) S. Martin, G. Bryant, and W. van Megen, Phys. Rev. E 67, 061405 (2003).
- Schöpe et al. (2006b) H. J. Schöpe, G. Bryant, and W. van Megen, Phys. Rev. Lett. 96, 175701 (2006b).
- Byelov et al. (2010) D. V. Byelov, M. C. D. Mourad, I. Snigireva, A. Snigirev, A. V. Petukhov, and H. N. W. Lekkerkerker, Langmuir 26, 6898 (2010).
- Geerts et al. (2010) N. Geerts, S. Jahn, and E. Eiser, J. Phys.: Condens. Matter 22, 104111 (2010).
- Chang et al. (1995) J. Chang, P. Lesieur, M. Delsanti, L. Belloni, C. Bonnet-Gonnet, and B. Cabane, J. Phys. Chem. 99, 15993 (1995).
- Fernández et al. (2007) L. A. Fernández, V. Martin-Mayor, and P. Verrocchio, Phys. Rev. Lett. 98, 085702 (2007).
S1 Hiding in plain view:Colloidal self-assembly from polydisperse populations
Supplemental Information
S2 Materials and methods
Colloidal silica (Ludox HS40, Sigma-Aldrich) was cleaned and concentrated by the osmotic stress method, as detailed in Jönsson et al. (2011); Li et al. (2012, 2015). Millipore (Milli-Q) deionized water was used for all steps. The surfaces of the silica particles were cleaned through prolonged exchange with an aqueous salt solution (NaCl 5 mM) at a controlled pH (all solutions measured between pH 8.8-9.5), across a dialysis membrane with a molecular cutoff of 14 kD. The concentrations of ions in the dispersion are thus in Donnan equilibrium with NaCl at 5 mM. The volume fractions of the colloids were then adjusted by the addition of poly(ethylene glycol) (PEG 35000, Sigma) to the solution outside the dialysis membrane Li et al. (2015). The surfaces of the particles were not treated in any other way, although we emphasize that this “washing” process is important in order to obtain reliable results with particles that have exchangeable counter-ions. After dialysis, samples were poured into Falcon tubes, sealed, and stored until use.
We determined the volume fractions of our samples by weight measurements, before and after drying the dispersions overnight at 120-140∘C to eliminate adsorbed water. Results were statistically reproducible to within . To calculate we assumed a mass density of the silica particles of 2200 kg/m3. This is consistent with the relation of the position of the liquid SAXS peak to silica volume fraction Li et al. (2012), with contrast matching experiments for the same particles in D2O + H2O mixtures in SANS Wong et al. (1988), with the manufacturer s specifications, and numerous previous publications using similar dispersions (see e.g. Bergna and Roberts (2005); Iler (1979)). Allowing for up to an error in density of 50 kg/m3 would introduce a systematic error into the measurements of no more than 0.3%. Note that the density of Ludox particles is close to that of amorphous silica, in contrast to the lighter micro-porous particles that are instead synthesized by the Stöber process van Blaaderen and Vrij (1993); Masalov et al. (1993).
The experiments described in this study were performed over four SAXS sessions, using three separate series of dialysis, with different stock bottles each time. All experiments were conducted using the instrument ID02 at ESRF at a fixed wavelength of 0.1 nm (12.4 keV) with a spread in wavelength of 0.015%. An elliptical beam was used in all cases, with a height (full-width-half-maximum) of 50-70 m, and a width of 250-400 m Li et al. (2012); Boulogne et al. (2014), and with divergences of 20 rad and 40 rad, respectively. Spectra were collected at detector distances of 1 m, 2.5 m, and 10 m. In all cases the beam was centered on the middle of the sample cell, and the photon fluxes used were of order s-1.
Three different types of cells were used: quartz glass capillary tubes (Hilgenberg) with an inner diameter of 1.3 mm, a length of 8 cm and wall thickness of 0.01 mm; standard steel cells from the beam line, with mica windows (Richard Jahre GmbH, 10-20 m thickness), an 8 mm inner diameter and a path length of 0.5 mm; and single-use cells made from trapping a drop of dispersion (transferred to the cell by pipette) between two kapton films, separated by a 0.5 mm flexible ring. The capillaries were inserted into the capillary sample changer of ID02, translated sequentially to a position intersecting the beam, and exposed to the beam for very short times (0.1 to 1 s). A similar procedure was applied for the steel and kapton cells. In all cases the backgrounds spectra of empty cells were subtracted from the scattering spectra before further processing. Microscope observations of the crystals were also made in 50 m thick Hele-Shaw cells made from two standard microscope glass slides. Finally, we note that samples were not subject to any shear-melting regime prior to use. Instead, all samples started as a colloidal liquid, and were concentrated over a period of weeks in the absence of bulk flow. We found no effect of the type of cells, or the different preparations, on the phases observed, or the crystallization phenomena.
The properties of these dispersions have been well-studied in the past, and we provide a summary here. The full particle size distribution of Ludox HS40 has been measured directly through transmission electron microscopy Goertz et al. (2009). The particles are roughly spherical, with a mean radius of 8.15 nm and their distribution of radii is well-fit by a Gaussian with a polydispersity of 0.14. SAXS measurements on one of the samples used in our experiments Li et al. (2012) confirm these values: the form factor of a dilute dispersion was consistent with a mean diameter of 8.0 nm and a size polydispersity of 0.14.
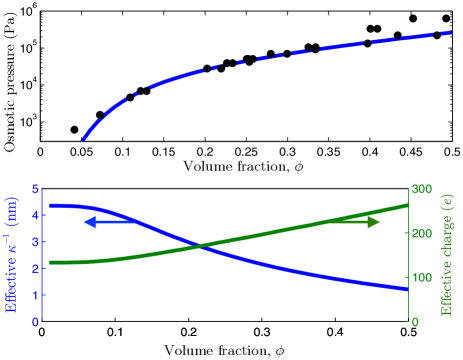
The bare, or surface, charge of silica nanoparticles has been measured for various dispersions at different ionic strengths and pH values Bolt (1957); Persello (2000). For 8 nm Ludox dialyzed against 1 mM NaCl, Bolt Bolt (1957) reports a surface charge density in the range of 0.3-0.5 /nm2, between pH 9-10. Persello Persello (2000) gives a slightly higher value of 0.6 /nm2 for a colloidal silica (S 22) at 5 mM NaCl, pH 9. Finally, we note that a Poisson-Boltzmann cell model using a bare charge of 0.5 /nm2 fits the experimental osmotic compression curves for different colloidal silicas at pH 9 and a range of salt concentrations Jönsson et al. (2011); Li et al. (2015). We adopt this value here, and note that as it scales as the radius squared, the polydispersity of the bare charge is about twice that of the radius, or 0.28.
Due to charge condensation (see e.g. Alexander et al. (1984); Belloni (1998); Trizac et al. (2003)), the effective interactions of our particles are related to a reduced, or renormalized charge. To estimate these effects we used the Poisson-Boltzmann cell model in the form summarized by Belloni Belloni (1998). This model solves the non-linear Poisson-Boltzmann equation on an electrically neutral spherical cell surrounding each colloidal particle. In Jönsson et al. (2011) this model was shown to match both a more detailed Monte Carlo simulation of the ionic distributions around silica nanoparticles, and the observed osmotic pressures of Ludox HS40 under our experimental conditions [see Fig. S1(a)]. From it we calculated the effective interactions of particles in our dispersions using Alexander’s prescription Alexander et al. (1984); Trizac et al. (2003). Specifically, we used Eqs. 6 and 16 of Ref. Trizac et al. (2003) to calculate the effective interaction length and effective charge for a Yukawa potential between two average-sized (8 nm, surface charge 402 ) particles, at various concentrations, as shown in Fig. S1(b). The values at ( nm, effective charge 171 ) were used as inputs to the Monte-Carlo model described in our letter.
Finally, within the cell-model we also investigated the effects of changing the particle radius on the reduced charge, in an attempt to evaluate the charge and interaction polydispersity. For strong charge renormalisation Garbow et al. (2004) it is known that the reduced charge scales linearly with the average particle radius . In the absence of charge renormalisation, it should scale as the bare charge, namely . We found that, for our small particles at intermediate salt concentrations, the reduced charge scales in an intermediate way, of approximately , for small changes around nm. Converting this into a charge polydispersity would allow us to estimate a reduced charge polydispersity of 19%, arising from the particle size polydispersity. Since the Yukawa potential is a pair potential that scales with the independent charges on two particles, the interaction polydispersity of the effective potential is times higher than that of the charge polydispersity.
S3 Powder diffraction analysis
For a powder diffraction pattern the intensity of a Bragg peak with Miller indices at a scattering vector is
| (1) |
Here is the complex structure factor of the unit cell and is the multiplicity of the peaks. The exponential term is the Debye-Waller factor, which accounts for thermal fluctuations of particles around their equilibrium positions: is the mean squared displacement induced by thermal agitation. Finally, the 1/ correction is due to the spreading of the Bragg peak in reciprocal space, over a sphere of radius . Note that the definition of the complex structure factor is different from that of the effective structure factor , which is discussed in our letter with respect to -like structures. In particular, can be measured without making any assumptions about the fractionation of particles into any individual co-existing phase.
The complex structure factor can be found by summing over the contributions of all objects in a unit cell
| (2) |
where is a geometrical factor related to the arrangement of the objects, and relates to the shape of the individual scattering objects. For the case of monodisperse spherical nanoparticles of radius ,
| (3) |
Noteworthy, the polydispersity of the particles occupying each site does not have any effect on the relative intensities, because any independent form factor fluctuations result in a -constant increase of the SAXS background. Only spatially correlated form factor fluctuations should cause both the Bragg peak intensity to decrease and additional diffuse scattering, but this is not observed in the present case
S3.1 Structural Analysis of Laves phase
For volume fractions = 0.219, 0.235, and 0.240, we found up to 14 peaks of corresponding to colloidal crystals arranged as a MgZn2 Laves phase. The scattering spectrum of the sample was of slightly better quality, and its analysis is presented here (the other spectra are consistent with the same structure). The position, width, and height of each peak was fit using a Lorentzian line-shape, allowing for a slowly varying background. The half-width-half-maxima, , of all these peaks were approximately equal, and between 0.003-0.004 nm-1 (compared to an instrument resolution of 310-4 nm-1). This indicates the absence of any disorder of the second kind (long-range) in the crystals and demonstrates their high positional quality. The constant width of the peaks shows that the crystals are at least of a size , or 1 micron. Thus, the crystals must be at least of order a hundred particles across.
The positions of the observed peaks can all be indexed to the reflections of the hexagonal crystal system. For this system, scattering peaks are possible when
| (4) |
Table I (main text) compares the positions of the observed and predicted scattering peaks for fitted lattice constants nm and nm . The point group must have the highest symmetry because of the spherical symmetry of the particles, e.g. 6/mmm. However, the high quality of the data shows clearly the extinction of the (0,0,1), (0,0,3), (1,1,1), and (1,1,3) reflections, indicating a glide-mirror along . The space group is consequently compact hexagonal (No. 194, P63/mmc). The unit cell has a volume of nm3, or 11.7 times the volume occupied by a nanoparticle in the coexisting bcc phase in the same sample (see analysis in Sect. S3.2).
The colloidal MgZn2 Laves phase is constituted by 4 large nanoparticles and 8 small nanoparticles, arranged within a unit cell of the compact hexagonal space group. As measured relative to the edges of the unit cell, the large particles are at coordinates
whereas the small particles are at coordinates
For the small particles, the first two coordinates correspond to the Wyckoff positions, while the last six coordinates are at the Wyckoff positions. The large particles occupy the Wyckoff positions. In this configuration, the geometric factor for each nanoparticle is
| (5) | ||||
where .
We converted the experimental scattering intensities into , and compared them with the calculated complex structure factors for an MgZn2 lattice. The peak intensities are well-fit with only three free parameters, the radius of the small particles nm, the radius of the large particles nm, and the amplitude of the thermal fluctuations nm. If we further allow the radii of the smaller particles at the and Wyckoff positions to vary independently, we find that they both converge to the same .
S3.2 Structural Analysis of bcc phase
| (nm-1) | (nm-1) | ||||
|---|---|---|---|---|---|
| 1 1 0 | 12 | 0.303 | 0.303 | 99 | 100 |
| 2 0 0 | 6 | 0.428 | 0.428 | 20.5 | 22 |
| 2 1 1 | 24 | 0.524 | 0.524 | -2.7 | -2.3 |
| 2 2 0 | 12 | 0.606 | 0.605 | -10 | -7 |
| 3 1 0 | 24 | 0.677 | 0.677 | -6.5 | -5.7 |
| (nm-1) | (nm-1) | ||||
|---|---|---|---|---|---|
| 1 1 0 | 12 | 0.317 | 0.317 | 100 | 100 |
| 2 0 0 | 6 | 0.449 | 0.449 | 25 | 26 |
| 2 1 1 | 24 | 0.550 | 0.550 | 0 | -1 |
| 2 2 0 | 12 | 0.634 | 0.635 | -11 | -8 |
| 3 1 0 | 24 | 0.711 | 0.710 | -6 | -7 |
| Parameter | Experiment | Monte-Carlo | ||
|---|---|---|---|---|
| Laves phase | bcc | Laves phase | bcc | |
| lattice const. (nm) | 43.58 | 27.99 | 43.8 | 27.8 |
| particle radii (nm) | ||||
| inter-particle | = 7.3 | = 7.5 | ||
| distance (nm) | = 8.5 | = 8.2 | ||
| = 9.1 | = 9.2 | |||
| in crystal | 0.217 | 0.218 | 0.22 | 0.22 |
| average (bulk) | 0.235 | 0.219 | – | – |
For the bcc phase, the geometrical factor of each particle (one at the origin of the unit cell, the other at its centre), is , if is even, and 0 otherwise. Scattering peaks from bcc crystals (space group 229) are allowed at
| (6) |
when is even, and is the lattice constant.
The bcc peaks of several spectra were analyzed in detail. In each case, as with the Laves phase discussed above, the lattice constant was fit to the peak positions, while the average radius, , of the particles in the bcc phase, and the thermal fluctuation amplitude were fit to match the distribution of peak intensities. The results of the fits for and are shown in Tables S1 and S2, respectively. For the further situation , only the first two bcc peaks were visible, from which we could derive the lattice constant nm. The bcc unit cell contains 2 nanoparticles, and has a volume of , giving a volume per particle of 9960 nm3 for the sample.
S3.3 Summary and comparison to Monte-Carlo simulation
A summary of the structural analyses for the Laves and bcc phases is presented in Table S3, which also gives some geometrical parameters of both phases, and shows equivalent measurements from the Monte-Carlo simulation. Briefly, in a bcc crystal of lattice constant , the distance between the centers of adjacent particles is . However, the particles are not in contact, and the average separation of their surfaces is , where is the mean radius of the particles in the bcc phase. In the case of the Laves phase, the surface-separations of adjacent small particles is , of adjacent large particles is , and of adjacent large and small particles is . In all cases the nanoparticles are not in contact, and are separated by approximately the same gaps. For the Monte-Carlo simulation, all values represent averages over all particles in a phase.
References
- Jönsson et al. (2011) B. Jönsson, J. Persello, J. Li, and B. Cabane, Langmuir 27, 6606 (2011).
- Li et al. (2012) J. Li, B. Cabane, M. Sztucki, J. Gummel, and L. Goehring, Langmuir 28, 200 (2012).
- Li et al. (2015) J. Li, M. Turesson, C. A. Haglund, B. Cabane, and M. Skepö, Polymer 80, 205 (2015).
- Wong et al. (1988) K. Wong, B. Cabane, and R. Duplessix, J. Colloid Interface Sci. 123, 466 (1988).
- Bergna and Roberts (2005) H. E. Bergna and W. O. Roberts, eds., Colloidal silica: fundamentals and applications (Taylor and Francis, 2005) p. 895.
- Iler (1979) R. K. Iler, ed., The Chemistry of Silica: Solubility, Polymerization, Colloid and Surface Properties and Biochemistry of Silica (Wiley, 1979) p. 896.
- van Blaaderen and Vrij (1993) A. van Blaaderen and A. Vrij, J. Colloid Interface Sci. 156, 1 (1993).
- Masalov et al. (1993) V. M. Masalov, N. S. Sukhinina, E. A. Kudrenko, and G. A. Emelchenko, J. Colloid Interface Sci. 156, 1 (1993).
- Boulogne et al. (2014) F. Boulogne, L. Pauchard, F. Giorgiutti-Dauphiné, R. Botet, R. Schweins, M. Sztucki, J. Li, B. Cabane, and L. Goehring, Europhys. Lett. 105, 38005 (2014).
- Goertz et al. (2009) V. Goertz, N. Dingenouts, and H. Nirschl, Part. Part. Syst. Charact. 26, 17 (2009).
- Bolt (1957) G. H. Bolt, J. Phys. Chem. 61, 1166 (1957).
- Persello (2000) J. Persello, in Adsorption on Silica Surfaces, edited by E. Papirer (Marcel Dekker, 2000) Chap. 10.
- Alexander et al. (1984) S. Alexander, P. M. Chaikin, P. Grant, G. J. Morales, P. Pincus, and D. Hone, J. Chem. Phys. 80, 5776 (1984).
- Belloni (1998) L. Belloni, Colloids Surf. A 140, 227 (1998).
- Trizac et al. (2003) E. Trizac, L. Bocquet, M. Aubouy, and H. H. von Grünberg, Langmuir 19, 4027 (2003).
- Garbow et al. (2004) N. Garbow, M. Evers, T. Palberg, and T. Okubo, J. Phys. Cond. Matt. 16, 3835 (2004).