Atomic-scale avalanche along a dislocation in a random alloy
Abstract
The propagation of dislocations in random crystals is evidenced to be governed by atomic-scale avalanches whose the extension in space and the time intermittency characterizingly diverge at the critical threshold. Our work is the very first atomic-scale evidence that the paradigm of second order phase transitions applies to the depinning of elastic interfaces in random media.
pacs:
62.25.-g, 45.70.Ht, 61.72.Lk, 64.70.qjI INTRODUCTION
Avalanche like motion of isolated elastic interfaces in random media is a process now clearly recognized at laboratory scales, e.g. in Barkhausen effect Durin and Zapperi (2000), brittle fracture Måloy et al. (2006) imbibition Santucci et al. (2011), etc. Mesoscale scalar field theory Narayan and Fisher (1993) captures such a behavior and allows theoreticians to define an universal critical behavior close to the depinning threshold, with a divergence of mean avalanche extents and durations. Though, the field theory remains limited to a realm by far larger than the atomic-scale. This is due to a prerequisited coarse-graining which introduces an averaging distance cutoff much larger than the typical inter-atomic distances.
Here we show that the critical avalanching behavior predicted throughout field theory is still a concern at the atomic-scale, along an isolated dislocation moving in a random crystal. Dislocations exibit morphological scaling features. They also propagate through jerky avalanches, the size and duration of which are power-law distributed up to a cut-off which diverges as the critical stress is approached. All the scaling relations expected from the standard depinning theory are fulfilled down to the atomic scale.
II NUMERICAL METHODS
Plastic deformation of a solid solution is a prototypical example where dislocations must pass a random distribution of atomic-size obstacles to release plastic flow Friedel (1964). Despite the most recent progresses in tunneling electron microscopy Caillard (2011), it is practically unfeasible for experiments to analyze selectively a dislocation depinning and its associated roughness, at the atomic scale. Hence numerical simulations are resorted to, as they enable us to focus on the dynamics of a single dislocation. Molecular dynamics (MD) simulations are employed in order to integrate the degrees of freedom of the whole crystal with atomic size impurities. The main advantage of MD simulations is that the dislocation is not modeled by a phenomenological elastic manifold Zapperi and Zaiser (2001); Csikor et al. (2007); Devincre et al. (2008) but more realistically as a Burgers discontinuity in the atom arrangement. Note also that this method ensures a proper inclusion of the non-linearities governing the dislocation self-interactions and a time scale with clear physical meaning.
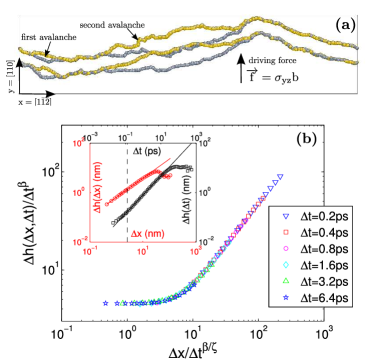
Typical snapshots of the dislocation position at two successive times are shown in Fig. 1 (a). A single-crystal of binary Ni(Al) solid solutions (10 atomic percent of Al randomly distributed in the Ni matrix) with a single edge dislocation is deformed under a constant shear stress at K. The technical details of these MD simulations can be found in Rodary et al. (2004) and briefly recalled hereafter.
The interactions between atoms are modeled via an Embedded-Atom-Method interatomic potential which has been tailored to bulk properties Rodary et al. (2004). Periodic boundary conditions are imposed in the dislocation line (X in Fig. 1 (a)) and in the dislocation glide direction (Y in Fig. 1 (a)). The size of the simulation box is in the X and Y directions, respectively, and the thickness is [The size has been chosen to be several times larger than the Larkin’s length]. The upper and lower free surfaces of the system (parallel to the slip) allow us to impose a shear stress . This translates into a Peach-Koehler force that drags the dislocation through the random crystal above a certain threshold studied in details in Rodney and Martin (1999); Rodary et al. (2004); Proville and Patinet (2010).
The initial configuration is computed with a mere steepest descent gradient algorithm. Due to the relatively weak stacking fault energy of Ni, the dislocation dissociates into two Shockley partial dislocations as expected for face-centered cubic metals (see Fig. 1 (a)). Following this initial relaxation, we apply a constant shear stress () and temperature (). The latter is maintained via a Berendsen thermostat.
The dislocation dynamics are analyzed along the trajectories for which the glide distance is at least nm. With the present configuration, the closest stress from the critical depinning transition point is obtained at MPa. This order of magnitude is similar to that measured in experiments Mishima et al. (1986); Cahn (2001). The dislocation core is localized by identifying the atoms whose first neighbor cell differs from the perfect crystal. This yields a limit nm (resp. nm) in resolution along X (resp. Y). The two partial dislocations move in a coherent manner (see Fig. 1 (a)) due to their strong elastic couplingProville and Patinet (2010). As results, we define the effective dislocation position by averaging the two partials. All the analysis thereafter are restricted to the steady state regime, after the dislocation has glided over a distance of nm. Let us finally add that the high-frequency oscillations were removed from the dislocation dynamics and we only considered the forward motions in the statistical analysis presented hereafter.
III RESULTS
Morphological scaling features of the time evolving fronts are first characterized. In this context, the height-height correlation functions are computed in both space and time:
| (1) |
Both are found to exhibit power-law shapes, with exponents and , respectively (Fig. 1 (b): Inset). These scalings are signatures of self-affinity. No lower cutoff is evidenced in space, while the lower cutoff in time appears to be of the order of the inverse of the Debye frequency ( in pure Ni). In both cases, the upper cutoffs decay as applied shear (and hence mean dislocation velocity) increases.
Full spatio-temporal morphological scaling features can be characterized through the computation of the space-time structure function defined as:
| (2) |
As shown in the main panel of Fig. 1 (b), this function is found to obey the Family-Viseck scaling Family and Vicsek (1991):
| (3) |
Such a scaling is expected close to the depinning transition of an elastic manifold. Hence, the exponents , and are identified with the roughness, growth and dynamic exponents, respectively, commonly defined in interface growth problems.
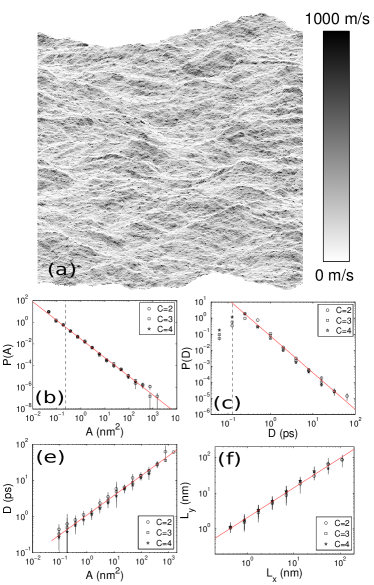
Spatio-temporal intermittent dynamics of the propagating dislocations are now analyzed via a procedure initially proposed in Måloy et al. (2006) and extensively applied to crack propagation Bonamy et al. (2008); Bonamy (2009) and imbibition Santucci et al. (2011) problems, among others. It consists: (i) in computing the so-called activity map , i.e. the time w spent by the dislocation within a small Å2 region at each point of the glide plane (Fig. 2 (a)); and (ii) in subsequently defining avalanches as clusters of connected points with velocity w above where denotes averaging over both time and space, and stands for clip level. The statistics of avalanche area, , and duration, , (time elapsed between dislocation arrival and departure in/from the cluster) allow us to characterize quantitatively the intermittent dynamics.
Dislocation propagation just above the depinning threshold () is first considered. Distributions of area and duration are presented in Fig.2 (b)-(c). They exhibit power law tails and , as expected in a system near criticality. The two exponents are found to be and . Figure 2 (c) reveals also a power-law scaling between area and duration: with . Note that , and are related: Since scales as , the fact that yields and therefore: . The fulfillment of this relation indicates the high quality of our sampling. Finally, avalanches are shown to exhibit morphological scaling features since their width, , scales as a power-law of their length, (Fig. 2 (e)), with an exponent . All the scaling exponents described above are found to be robust and independent of clip level.
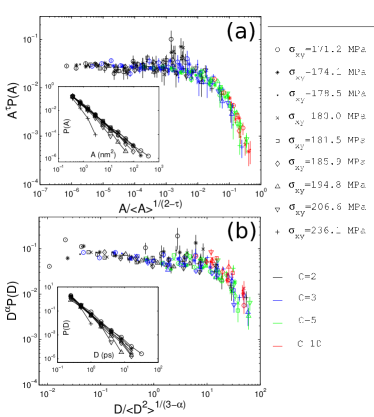
Let us now move to the analysis of the role played by the applied stress on the dislocation dynamics. The insets in Figs. 3 (a) and (b) show the effect of applied stress on the area and duration distributions, respectively. In both cases, an upper cutoff decreasing with is observed. Once again, such behaviors are characteristic of a system near criticality. In this context, the distributions are expected to take the form and where and are universal fast decreasing functions, and and are the area and duration cutoffs that diverge algebraically as reaches the critical value. Then, the mean value goes as , and the area distribution can be recast:
| (4) |
As shown in the main panel in Fig. 3 (a), this scaling is fully verified, and the function is found to be independent of both and over the whole range tested. Note that this analysis must be adapted for durations since is not defined when is larger than two. Instead, the mean value is chosen. Since goes as , one hence expects:
| (5) |
This second scaling is fairly well fulfilled, as demonstrates Fig. 3 (b).
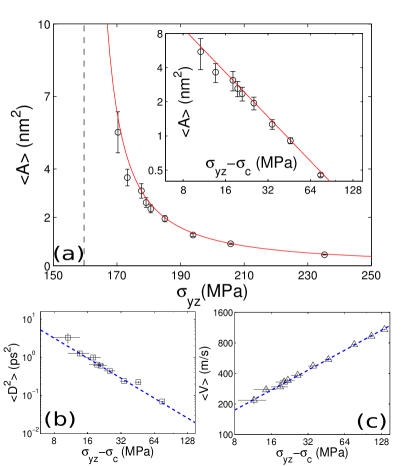
To complete the statistical analysis of dislocation dynamics, we plot in Figs. 4 (a) the variation of as a function of . Once again, the increase of as decreases toward the depinning threshold is reminiscent of a critical behaviour. It is well described by an algebraic divergence of the form with . This divergence in terms of avalanche area translates into a divergence in term of avalanche duration: Since and , one expects and hence, with . As seen in Fig. 4 (b), this scaling is compatible with direct simulations.
IV CONCLUDING DISCUSSION
Our analysis of atomic-scale dislocation dynamics in random crystals has revealed many signatures of criticality. To the very best of our knowledge, this work is the first to show that the theoretical framework of second order phase transitions can be applied down to the atomic scales. In this respect, it is of some interest to check the theoretical mapping between the avalanche dynamics extracted from the activity map on one hand, and the revealed morphological scaling features on the other hand Narayan and Fisher (1993): Avalanches of extent are indeed expected to result from front pieces of extent that depins over a propagating length and a time . Avalanche exponents and are hence expected to be related to and through and – Both relations are fulfilled in the present atomic scale system.
In the paradigm of critical transitions, the divergence of and as vanishes are due to the divergence of a correlation length : . Assimilating to the maximum extent of an avalanche yields and hence . Scaling of the mean dislocation velocity can then be deduced: close to , the propagation is made of avalanches of extent , which moves the dislocation forward by over a time period . Thus, the velocity behaves as with . This latter relation yields , which is perfectly compatible with the direct measurements (Fig. 4 (c)).
Our system exhibits all signatures expected from the field theory in the vicinity of a critical depinning transition at zero temperature. We can reasonably expect that the predictions of such a theory also apply at finite temperature. In particular, the slow thermally-activated motion of dislocation at low shear stress (below critical threshold) is expected to be given by the creep formula where is a characteristic energy scale and a universal exponent Feigelman et al. (1989); Nattermann (1990). Real deformation experiments actually result from a collective behavior of dislocation involving diverse mechanisms as the interactions with grain boundaries, surfaces, forest dislocations and atomic scale impurities. It seems therefore challenging to demonstrate this in real experiment and atomistic simulation could be a solution.
The present study convincingly shows that the concepts of critical depinning transition apply down to atomic scale. It is worth to mention that the critical exponents measured here do not belong to the standard universality classes associated with the well-established field theories of depinning transition, namely the Edward-Wilkinson (EW)Edwards and Wilkinson (1982), the Kardar-Parisi-Zhang (KPZ)Kardar et al. (1986) and the Long Range (LR)Ertas and Kardar (1994) elastic string models (see Table 2). This can be understood since these continuous string models are constructed from symmetries principles by calling upon a thermodynamic limit argument (i.e. by making and to eliminate the high order derivates in the equation of string motion), which stops to be relevant at small scales. To understand what determines the universality class at such atomic scales represents a significant challenge for future investigations. Since the field theory of elastic manifold predicts critical behavior in variety of different systems of solid state physics like e.g. domain wall motion in ferromagnets, crack problems, vortex motion in superconductors and charge density wave, etc, it may be of interest to see whether or not similar extension of criticality down to atomic scale can be evidenced in these systems.
References
- Durin and Zapperi (2000) G. Durin and S. Zapperi, Phys. Rev. Lett., 84, 4705 (2000).
- Måloy et al. (2006) K. J. Måloy, S. Santucci, J. Schmittbuhl, and R. Toussaint, Phys. Rev. Lett., 96, 045501 (2006).
- Santucci et al. (2011) S. Santucci, R. Planet, K. J. Måloy, and J. Ortín, Europhysics Letters, 94, 46005 (2011).
- Narayan and Fisher (1993) O. Narayan and D. S. Fisher, Phys. Rev. B, 48, 7030 (1993).
- Friedel (1964) J. Friedel, Dislocations, edited by Addison-Wesley (New York, 1964).
- Caillard (2011) D. Caillard, Acta Mater., 59, 4974 (2011).
- Zapperi and Zaiser (2001) S. Zapperi and M. Zaiser, Mater. Sci. and Eng. A, 309, 348 (2001).
- Csikor et al. (2007) F. F. Csikor, C. Motz, D. Weygand, M. Zaiser, and S. Zapperi, Science, 318, 251 (2007).
- Devincre et al. (2008) B. Devincre, T. Hoc, and L. Kubin, Science, 320, 1745 (2008).
- Rodary et al. (2004) E. Rodary, D. Rodney, L. Proville, Y. Bréchet, and G. Martin, Phys. Rev. B, 70, 054111 (2004).
- Rodney and Martin (1999) D. Rodney and G. Martin, Physical Review Letters, 82, 3272 (1999).
- Proville and Patinet (2010) L. Proville and S. Patinet, Phy. Rev. B, 82, 054115 (2010).
- Mishima et al. (1986) Y. Mishima, S. Ochiai, N. Hamao, M. Yodogawa, and T. Suzuki, Tans. Jap. Met., 27, 656 (1986).
- Cahn (2001) R. Cahn, Nature, 410, 643 (2001).
- Family and Vicsek (1991) F. Family and T. Vicsek, Dynamic of fractal surfaces (Worl Scientific, 1991).
- Bonamy et al. (2008) D. Bonamy, S. Santucci, and L. Ponson, Phys. Rev. Lett., 101, 045501 (2008).
- Bonamy (2009) D. Bonamy, J. Phys. D, 42, 214014 (2009).
- Berg and Harris (2008) B. A. Berg and R. C. Harris, Computer Physics Communications, 179, 443 (2008).
- Feigelman et al. (1989) M. V. Feigelman, V. B. Geshkenbein, A. I. Larkin, and V. M. Vinokur, Phys. Rev. Lett., 63, 2303 (1989).
- Nattermann (1990) T. Nattermann, Phys. Rev. Lett., 64, 2454 (1990).
- Edwards and Wilkinson (1982) S. F. Edwards and D. R. Wilkinson, Proc. Roy. Soc. London, Ser. A, 381, 17 (1982).
- Kardar et al. (1986) M. Kardar, G. Parisi, and Y.-C. Zhang, Physical Review Letters, 56, 889 (1986).
- Ertas and Kardar (1994) D. Ertas and M. Kardar, Physical Review E, 49, R2532 (1994).
- Duemmer and Krauth (2005) O. Duemmer and W. Krauth, Physical Review E, 71, 061601 (2005).
- Tang and Leschhorn (1992) L.-H. Tang and H. Leschhorn, Physical Review A, 45, R8309 (1992).
- Duemmer and Krauth (2007) O. Duemmer and W. Krauth, Journal of Statistical Mechanics, 1, 01019 (2007).