Trigger of a blowout jet in a solar coronal mass ejection associated with a flare
Abstract
Using the multi-wavelength images and the photospheric magnetograms from the Solar Dynamics Observatory, we study the flare which was associated by the only one coronal mass ejection (CME) in active region (AR) 12192. The eruption of a filament caused a blowout jet, and then an M4.0 class flare occurred. This flare was located at the edge of AR instead of in the core region. The flare was close to the apparently “open” fields, appearing as extreme-ultraviolet structures that fan out rapidly. Due to the interaction between flare materials and “open” fields, the flare became an eruptive flare, leading to the CME. Then at the same site of the first eruption, another small filament erupted. With the high spatial and temporal resolution H data from the New Vacuum Solar Telescope at the Fuxian Solar Observatory, we investigate the interaction between the second filament and the nearby “open” lines. The filament reconnected with the “open” lines, forming a new system. To our knowledge, the detailed process of this kind of interaction is reported for the first time. Then the new system rotated due to the untwisting motion of the filament, implying that the twist was transferred from the closed filament system to the “open” system. In addition, the twist seemed to propagate from the lower atmosphere to the upper layers, and was eventually spread by the CME to the interplanetary space.
Subject headings:
Sun: activity — Sun: evolution — Sun: filaments, prominences — Sun: flares1. Introduction
Solar jets which are small-scale plasma ejections along open field lines or the legs of large-scale coronal loops have been extensively investigated (e.g., Schmieder et al. 1988; Shibata et al. 1994; Zhang et al. 2000; Liu & Kurokawa 2004; Cirtain et al. 2007; Jiang et al. 2007; Tian et al. 2014). They often recur from the regions of evolving photospheric magnetic flux, such as satellite spots of an active region (AR), quiet regions, and coronal holes (e.g., Chae et al. 1999; Chen et al. 2008; Pariat et al. 2010; Yang et al. 2011a, 2011b). The detailed statistical properties of X-ray jets were studied by Shimojo et al. (1996) and Savcheva et al. (2007). Probably due to the release of magnetic twist, helical or untwisting motions are often observed in jets (e.g., Jibben & Canfield 2004; Liu et al. 2009; Shen et al. 2011; Chen et al. 2012). Sometimes, jets are associated with large-scale solar eruptions, such as filament eruption and coronal mass ejections (CMEs; e.g. Liu et al. 2005; Jiang et al. 2008; Guo et al. 2010; Shen et al. 2012).
By examining many X-ray jets in Hinode/X-Ray Telescope coronal X-ray movies of the polar coronal holes, Moore et al. (2010) found that nearly all solar polar X-ray jets can be divided into two different types: standard jets and blowout jets. The standard X-ray jets are evidently produced by reconnection between an emerging magnetic arch at the base of the jet and the ambient unipolar open magnetic field of the coronal hole, during which the interior of the base arch is insert and does not participate in the eruption (e.g., Yokoyama & Shibata 1995; Canfield et al. 1996; Pariat et al. 2009). The blowout X-ray jets are produced by blowout eruption of the base small filament, a miniature version of the blowout eruption of the sheared-core magnetic arcade in a CME eruption. The blowout jet model has been supported by some observational studies (e.g., Hong et al. 2011; Liu et al. 2011; Shen et al. 2012; Pucci et al. 2013; Young & Muglach 2014). However, the detailed process of the interaction between the erupting filament and the ambient open field is unclear.
The super solar AR 12192 during 2014 October consisted of the largest sunspot group in the past 24 years (e.g., Sun et al. 2015; Thalmann et al. 2015; Yang et al. 2015). It is so far the most intensely flaring region of Cycle 24. According to the statistics of Chen et al. (2015), AR 12192 produced 6 X-class and 29 M-class flares from October 18 to 29, but only one of which was followed by a CME. In this study, using the observations of the New Vacuum Solar Telescope (NVST; Liu et al. 2014) and the Solar Dynamics Observatory (SDO; Pesnell et al. 2012), we investigated the only one CME-associated flare from the periphery of AR 12192, which was caused by a blowout jet (Chen et al. 2015). Our observations present the unprecedentedly clear process of the interaction between the erupting small filament and the ambient “open” field, which is consistent with the blowout jet model. Here and in the following text, we use quotation marks around the word “open”, considering that the “open” loops, which appear as rapidly fan-out extreme-ultraviolet (EUV) structures, might be large-scale loops reaching large heights as calculated by Thalmann et al. (2015).
2. Observations and data analysis
The NVST at the Fuxian Solar Observatory has three channels to image the Sun, i.e., H, TiO, and the G band. The H channel is used to observe the solar chromosphere with a bandwidth of 0.25 Å. The H data used in this study were obtained in 6562.8 Å from 07:50:12 UT to 09:17:33 UT on 2014 October 24 with a cadence of 12 s. The NVST was pointed to AR 12192 with a field-of-view (FOV) of 152157 and a pixel size of 0.168. The data are first calibrated, including flat field correction and dark current subtraction, and then reconstructed using speckle masking (Weigelt 1977; Lohmann et al. 1983).
We also adopt the Atmospheric Imaging Assembly (AIA; Lemen et al. 2012) multi-wavelength images and the Helioseismic and Magnetic Imager (HMI; Scherrer et al. 2012; Schou et al. 2012) data on board the SDO. We choose the AIA 131 Å, 171 Å, 304 Å and 1600 Å images, obtained from 07:00 UT to 09:20 UT on October 24 with a pixel size of 0.6 and a cadence of 12 s. We use the HMI full-disk line-of-sight (LOS) magnetograms with a 3 min cadence, i.e., one frame in four, from 2014 October 23 12:00 UT to 2014 October 24 12:00 UT.
3. Results
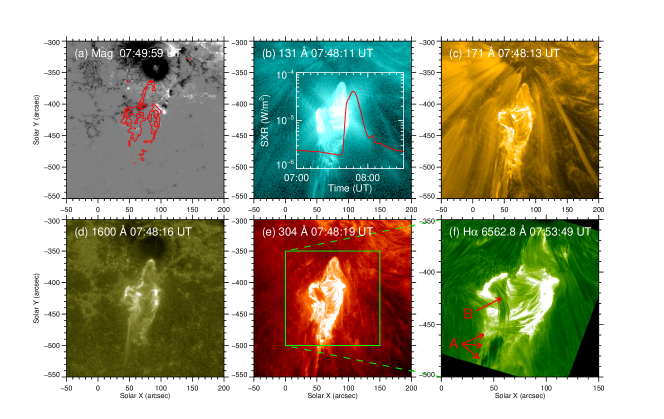
By investigating the evolution of the HMI magnetograms, we found that new magnetic flux started to emerge from 2014 October 21 in the southeast of the main negative polarity sunspot in AR 12192. About 3 days later, a blowout jet occurred at the emerging flux region, triggering an M4.0 flare and a CME. The flare and the associated jet observed by the SDO and NVST near the peak time were shown in Figure 1. The GOES soft X-ray 18 Å flux showed that the M4.0 flare initiated at 07:37 UT, and reached its peak at 07:48 UT (see the red curve in panel (b)). As shown in panel (a), the east flare ribbon was located at the negative polarity fields and the west ribbon was at the positive polarity fields. The appearances of the jet and the filament eruption were similar in higher-temperature wavelength of 131 Å and lower-temperature wavelengths of 171 Å and 304 Å (panels (b)-(c) and (e)). The two ribbons of the flare in the chromosphere were observed in 1600 Å image (panel (d)). The jet (the bright structure denoted by arrows “A”) and the filament (the dark structure indicated by arrow “B”) were clearly observed in the H image (panel (f)). Unfortunately, the observations of NVST started late and we can only use the SDO data to study the first eruption.
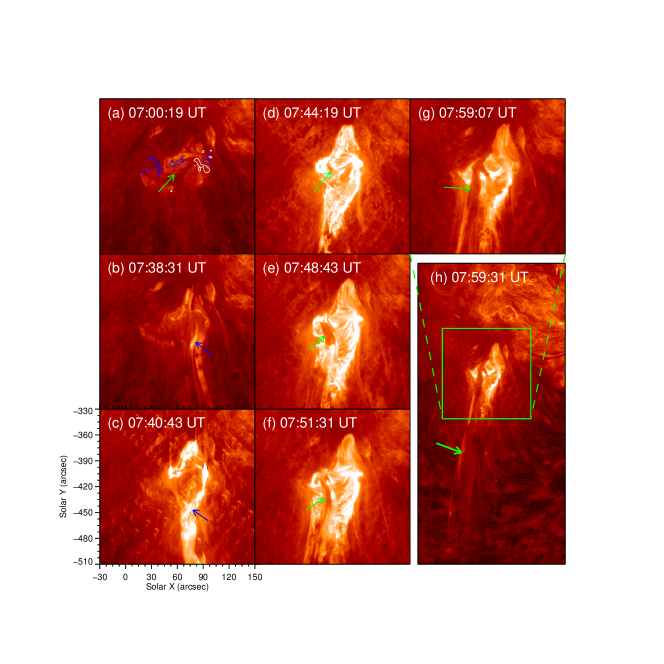
The temporal evolution of the first eruption is shown in Figure 2 (also see the accompanying animation movie_1.mp4). The filament was in the east-west direction, with a projected length of about 60 Mm. The east footpoint of the filament was anchored in the negative polarity magnetic fields and the west one is at the positive polarity fields (panel (a)). The blowout jet appeared at about 07:38 UT, and the material of the bright features was simultaneously ejected and moved towards the south (indicated by the arrows in panels (b)-(c)). The most distinct change of the filament is that it began to rise (denoted by the arrow in panel (d)). From 07:44:19 UT, the projected height of the filament increased by about 5 Mm in two minutes. The region with EUV brightenings was extended as seen in the AIA 304 Å images and the flare reached its peak at 07:48 UT (panel (e)). Some filament material was ejected outward (denoted by the arrow in panel (f)). At 07:59 UT, the flare had greatly decayed (panel (g)), and the filament erupted (indicated by the arrow in panel (h)). At the decaying phase of the flare, partial material of the erupting filament fell back to the solar surface nearby its east footpoint. At about 08:12 UT, a CME was observed in the FOV of LASCO C2. The angular width of the CME was about 90°and the average velocity was approximately 500 km s-1.
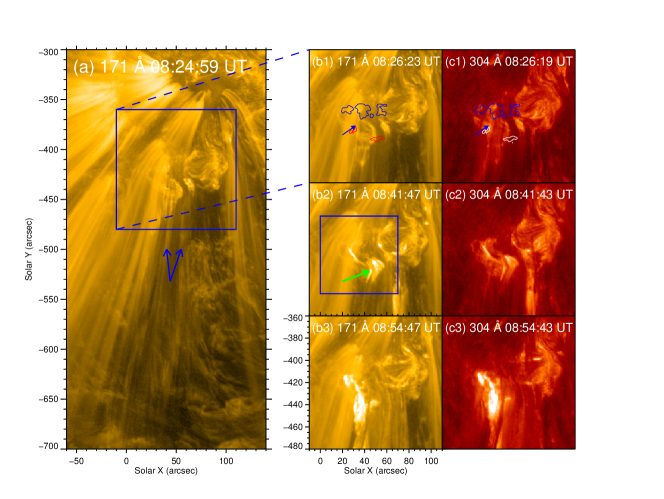
Figure 3 displays the second eruption process of another small filament observed by AIA 171 Å and 304 Å. The general appearance and the surrounding environment before the second eruption is shown in panel (a). The second filament erupted at (40, -430) about twenty minutes after the first filament eruption. We can see that another blowout jet was associated with the filament eruption. The blue arrows in panels (b1) and (c1) point to the filament before eruption. A set of “open” field lines were rooted in vicinity of the east footpoints of the filament, both anchoring in the negative polarity magnetic fields. The “open” lines (denoted by the arrows in panel (a)) were outlined by the falling dark material of the former jet. The west footpoint of the filament was shielded by the material of the dark features of the “open” lines, and seemed to be located at the positive polarity fields. At about 08:41 UT, the interaction between the “open” lines and the filament began, and meanwhile the EUV brightenings were enhanced (panels (b2) and (c2); also see the animation movie_2.mp4). The interaction continued and then the filament erupted finally (panels (b3) and (c3)).
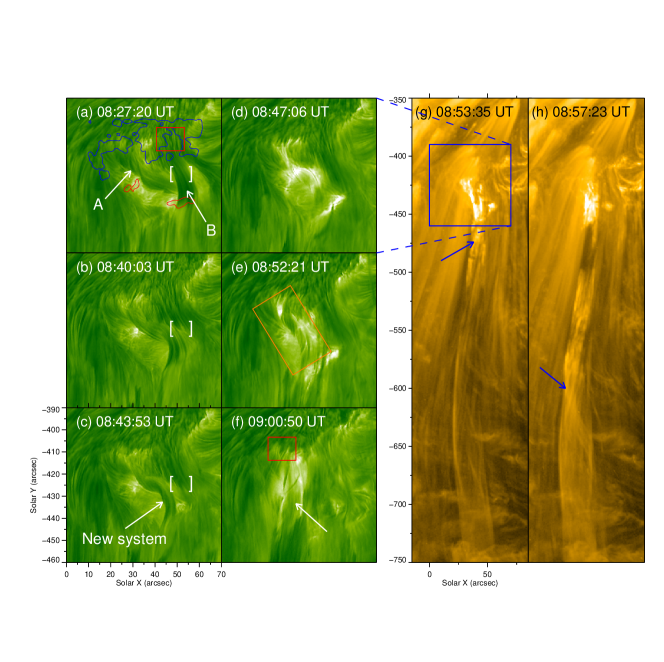
With the high-resolution observations of the NVST, the detailed evolution process of the second eruption was analyzed (see the accompanying animation movie_3.mp4). The filament and the “open” lines are denoted in Figure 4(a) by arrows “A” and “B”, respectively. By comparing the H and 171 Å images, we find that the structure denoted by arrow “B” in panel Figure 4(a) corresponds to the “open” lines indicated by the blue arrows in Figure 3(a). Therefore the structure “B” in Figure 4(a) represents a set of “open” lines. The footpoint of the “open” lines was located at the negative polarity magnetic fields, lying at the northwest of the filament (Figure 4(a)). Then the “open” lines began to interact with the filament and they gradually reconnected. At 08:40:03 UT, many “open” lines within the area marked by the brackets disconnected from their initial footpoints (panel (b)). The “open” lines continued moving eastward and reconnecting with the filament. During the reconnection process, the interaction area of the filament and the “open” lines was brightened up as observed in EUV lines, e.g., AIA 171 Å line (denoted by the green arrow in Figure 3(b2)). At 08:43:53 UT, the “open” lines totally connected with the filament, and a new system of the filament and “open” lines was formed, as displayed in panel (c). After that, the filament started to untwist, triggering the rotation of the new system and leading to the brightening (panel (d)). The highly twisted system rotated continuously (panel (e)), and lasted for about twenty minutes. The rotation angle caused by the untwisting motion was about 8 (see next paragraph for detail). At the late phase of the rotation, the twist of the system was significantly released (panel (f)). The comparison of panels (a) and (f) showed that the footpoints of the “open” lines were shifted to the east end of the filament. As the system rotated, the magnetic twist propagated outward along “open” lines (see the accompanying animation movie_4.mp4). To show the propagation process well, we take a bright helical structure as an example. At 08:53:35 UT, the projected position of the helical structure was located at (40, -475), as denoted by the arrow in panel (g). About four minutes later, the helical structure reached to a new position (25, -600) (indicated by the arrow in panel (h)). The average moving velocity of the structure was estimated to be about 400 km s-1.
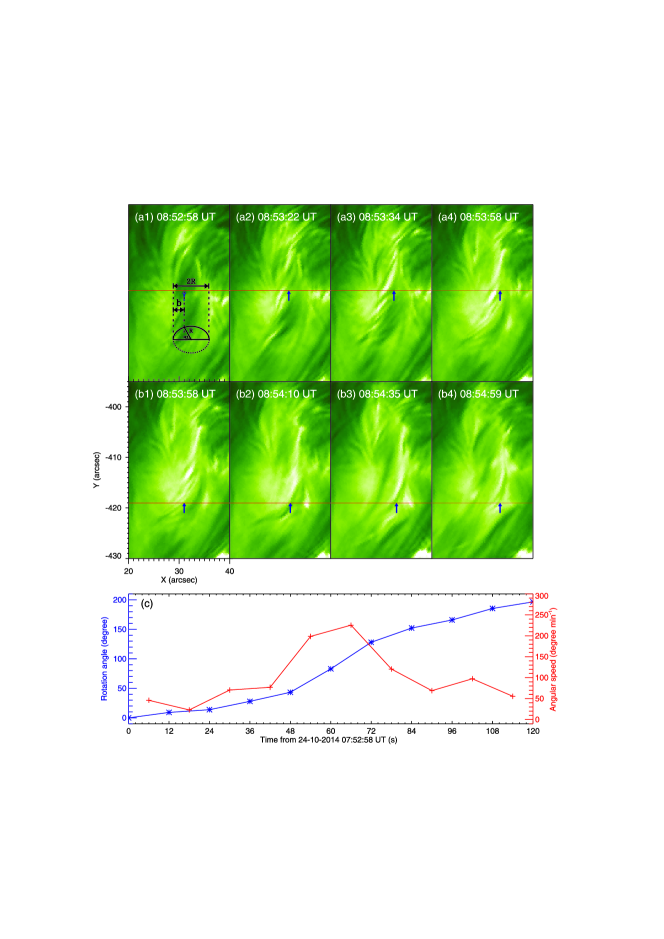
For detailed analysis of the untwisting process of the filament and the “open” lines, we focus on the marked rectangle regions in Figure 4(e), track the shift movement of dark fine structures, and mark the position changes of the structures with time (see Figure 5). The dark threads in the H images are considered to represent flux tubes of the filament. In order to measure the rotation angle of the filament, we draw a red line which is perpendicular to the filament spine. As the filament rotated, the intersection (marked by the blue arrows) between each dark thread and the red line shifted from left to right (panels (a1)-(a4) and (b1)-(b4)), indicating a clockwise rotation. We deduce the rotation angle from the shift distance. To illustrate how we measure the rotation of the filament, a cartoon is inserted into panel (a). The filament is considered to be a circular cylinder. The width of the filament is and the distance from the intersection to the filament left edge is . We define , and then the rotation angle between and is . This measurement method works under the assumption that the filament consisting of dark threads rotates rigidly. Because we do not trace and measure the movement of dark features along the field lines, the material flow will not affect our results. For one analyzed thread, it was on the left edge of the filament at the beginning (panel (a1)). About 24 seconds later, the intersection position moved to the west for about 3 (shown in panel (a2)). Until 08:53:34 UT, the intersection moved about 6 (panel (c)). We calculate the movement of the intersecting position every 12 seconds, until the thread moved to the right edge of filament (indicated in panel (a4)). Since this thread could not be observed at the far side of the filament, we choose another thread and track its evolution (marked by the arrows in panels (b1)-(b4)). Thus we can obtain the rotation angle and angular speed of the filament in two minutes, as plotted in panel (c). The angular velocity is not uniform, revealing the acceleration process followed by a deceleration. The minimum and maximum angular speeds are 30° min-1 and 230° min-1, respectively. The average angular velocity is 100° min-1. The rotation process lasted for about twenty minutes, the total twist angle of 8 is reasonable since the angular velocity is not uniform. Generally, many mechanisms can result in the eruption of flux ropes, such as kink instability (Török & Kliem 2005), and torus instability (Kliem & Török 2006). However, according to some previous studies, even for large twists, low-lying filaments, especially those with small length, still can keep stable (e.g., Vrsnak 1990; Isenberg & Forbes 2007).
4. Conclusions and Discussion
With the SDO observations, we study the only one CME-associated flare in AR 12192. There were two filament eruption processes at the edge of the AR. The magnetic flux emerged continuously at the southeast of the negative main sunspot in this super AR, forming a twisted filament system at this area. The first filament eruption caused a blowout jet, and produced an M4.0 flare and led to the only one CME. Using the NVST high tempo-spatial resolution data, we particularly study the evolution of the second filament eruption. The filament and the “open” lines reconnected with each other and formed a new system, the details of which were clearly observed by the NVST. Subsequently, the filament untwisted, and resulted the rotation of the new system. The total rotation angle is about 8 and the average angular speed is about 100° min-1.
As the largest AR since 1990 November, NOAA 12192 is the most flare productive AR. Except for one M4.0 class flare, all the X-flares and the other M-flares which originated from the AR core were not associated by any CME. According to the recent studies about this AR, the confined flares were affected by the strong confinement of the overlying magnetic fields, and the decay index of the background fields was below the typical onset threshold for the torus instability and thus no CME was produced (Sun et al. 2015; Thalmann et al. 2015; Chen et al. 2015). However, the M class flare in the present study was located at the edge of the AR instead of in the core region, and a CME was produced. We note that this flare was triggered by the blowout jet, and the flare became an eruptive flare due to the interaction between the flare material and “open” fields, leading to the CME (Thalmann et al. 2015).
In the standard jet model, the jet is caused by the reconnection between the emerging small-scale loops and the pre-existing “open” lines. While according to the blowout jet model, there exists a filament which is involved into the reconnection and eruption. Although many authors (e.g., Hong et al. 2011; Shen et al. 2012; Pucci et al. 2013) have reported the observational evidences for the later model, the interaction process between the filament and the “open” field lines have not been well observed. In this paper, the filament can be identified in multi-wavelengths, such as AIA 304 Å, 171 Å, and 131 Å, and especially in the NVST H line. As revealed by the H image in Figure 4(a), the location of one end of the filament was close to the “open” lines. Then the interaction between them began (Figure 4 (b)). About 16 minutes later, their topology had been significantly changed, and the new connection between the filament and the “open” lines was created (Figure 4 (c)). Thanks to the high-quality H data from the NVST, this detailed interaction process is, to our knowledge, first reported in the present paper.
As pointed out by Zhang & Low (2005), the accumulation of magnetic helicity in the corona can build up magnetic energy which will be responsible for the CME. When the stored free energy is higher than the Aly limit (Aly 1984, 1991), eruptions take place. As a fraction of helicity in a system, magnetic twist can be inferred by filament structure. Thus we try to study magnetic twist through observing the evolution of filament structures. In the present study, we show a scenario of twist transfer process between different systems and propagation from the lower atmosphere to the higher layers. As shown in Figure 4(a), the twist was initially stored in the helical filament. After the interaction between the filament and the “open” lines, a new system connecting the filament and the “open” lines was formed. Then the new system rotated due to the untwist of the filament, and thus the twist was transferred from the closed filament system to the “open” system. During the rotating movement, the twist probably propagated from the lower atmosphere to the upper layers. We speculate that the twist might be finally spread by the CME to the interplanetary space.
References
- Aly (1984) Aly, J. J. 1984, ApJ, 283, 349
- Aly (1991) Aly, J. J. 1991, ApJ, 375, L61
- Canfield et al. (1996) Canfield, R. C., Reardon, K. P., Leka, K. D., et al. 1996, ApJ, 464, 1016
- Cirtain et al. (2007) Cirtain, J. W., Golub, L., Lundquist, L., et al. 2007, Science, 318, 1580
- Chae et al. (1999) Chae, J., Qiu, J., Wang, H., & Goode, P. R. 1999, Bulletin of the American Astronomical Society, 31, 963
- Chen et al. (2008) Chen, H. D., Jiang, Y. C., & Ma, S. L. 2008, A&A, 478, 907
- Chen et al. (2012) Chen, H. D., Zhang, J., & Ma, S. L. 2012, RAA, 12, 573
- Chen et al. (2015) Chen, H., Zhang, J., Ma, S., et al. 2015, ApJ, 808, L24
- Guo et al. (2010) Guo, J., Liu, Y., Zhang, H., et al. 2010, ApJ, 711, 1057
- Hong et al. (2011) Hong, J., Jiang, Y., Zheng, R., et al. 2011, ApJ, 738, L20
- Isenberg & Forbes (2007) Isenberg, P. A., & Forbes, T. G. 2007, ApJ, 670, 1453
- Jiang et al. (2007) Jiang, Y. C., Chen, H. D., Li, K. J., Shen, Y. D., & Yang, L. H. 2007, A&A, 469, 331
- Jiang et al. (2008) Jiang, Y., Shen, Y., Yi, B., Yang, J., & Wang, J. 2008, ApJ, 677, 699
- Jibben & Canfield (2004) Jibben, P., & Canfield, R. C. 2004, ApJ, 610, 1129
- Kliem & Török (2006) Kliem, B., & Török, T. 2006, Physical Review Letters, 96, 255002
- Lemen et al. (2012) Lemen, J. R., Title, A. M., Akin, D. J., et al. 2012, Sol. Phys., 275, 17
- Liu et al. (2011) Liu, C., Deng, N., Liu, R., et al. 2011, ApJ, 735, L18
- Liu et al. (2009) Liu, W., Berger, T. E., Title, A. M., & Tarbell, T. D. 2009, ApJ, 707, L37
- Liu et al. (2005) Liu, Y., Su, J. T., Morimoto, T., Kurokawa, H., & Shibata, K. 2005, ApJ, 628, 1056
- Liu & Kurokawa (2004) Liu, Y., & Kurokawa, H. 2004, ApJ, 610, 1136
- Liu et al. (2014) Liu, Z., Xu, J., Gu, B.-Z., et al. 2014, RAA, 14, 705
- Lohmann et al. (1983) Lohmann, A. W., Weigelt, G., & Wirnitzer, B. 1983, Appl. Opt., 22, 4028
- Moore et al. (2010) Moore, R. L., Cirtain, J. W., Sterling, A. C., & Falconer, D. A. 2010, ApJ, 720, 757
- Pariat et al. (2009) Pariat, E., Antiochos, S. K., & DeVore, C. R. 2009, ApJ, 691, 61
- Pariat et al. (2010) Pariat, E., Antiochos, S. K., & DeVore, C. R. 2010, ApJ, 714, 1762
- Pesnell et al. (2012) Pesnell, W. D., Thompson, B. J., & Chamberlin, P. C. 2012, Sol. Phys., 275, 3
- Pucci et al. (2013) Pucci, S., Poletto, G., Sterling, A. C., & Romoli, M. 2013, ApJ, 776, 16
- Savcheva et al. (2007) Savcheva, A., Cirtain, J., Deluca, E. E., et al. 2007, PASJ, 59, 771
- Scherrer et al. (2012) Scherrer, P. H., Schou, J., Bush, R. I., et al. 2012, Sol. Phys., 275, 207
- Schmieder et al. (1988) Schmieder, B., Mein, P., Simnett, G. M., & Tandberg-Hanssen, E. 1988, A&A, 201, 327
- Schou et al. (2012) Schou, J., Scherrer, P. H., Bush, R. I., et al. 2012, Sol. Phys., 275, 229
- Shen et al. (2011) Shen, Y., Liu, Y., Su, J., & Ibrahim, A. 2011, ApJ, 735, L43
- Shen et al. (2012) Shen, Y., Liu, Y., Su, J., & Deng, Y. 2012, ApJ, 745, 164
- Shibata et al. (1994) Shibata, K., Nitta, N., Strong, K. T., et al. 1994, ApJ, 431, L51
- Shimojo et al. (1996) Shimojo, M., Hashimoto, S., Shibata, K., et al. 1996, PASJ, 48, 123
- Sun et al. (2015) Sun, X., Bobra, M. G., Hoeksema, J. T., et al. 2015, ApJ, 804, L28
- Thalmann et al. (2015) Thalmann, J. K., Su, Y., Temmer, M., & Veronig, A. M. 2015, ApJ, 801, L23
- Tian et al. (2014) Tian, H., DeLuca, E. E., Cranmer, S. R., et al. 2014, Science, 346, 1255711
- Török & Kliem (2005) Török, T., & Kliem, B. 2005, ApJ, 630, L97
- Vrsnak (1990) Vrsnak, B. 1990, Sol. Phys., 129, 295
- Weigelt (1977) Weigelt, G. P. 1977, Optics Communications, 21, 55
- Yang et al. (2015) Yang, S., Zhang, J., Jiang, F., & Xiang, Y. 2015, ApJ, 804, L27
- Yang et al. (2011) Yang, S., Zhang, J., Li, T., & Liu, Y. 2011a, ApJ, 732, L7
- Yang et al. (2011) Yang, L., Jiang, Y., Yang, J., et al. 2011b, RAA, 11, 1229
- Yokoyama & Shibata (1995) Yokoyama, T., & Shibata, K. 1995, Nature, 375, 42
- Young & Muglach (2014) Young, P. R., & Muglach, K. 2014, Sol. Phys., 289, 3313
- Zhang et al. (2000) Zhang, J., Wang, J., & Liu, Y. 2000, A&A, 364, 939
- Zhang & Low (2005) Zhang, M., & Low, B. C. 2005, ARA&A, 43, 103