Strong electron-phonon coupling in the intermetallic superconductor Mo8Ga41
Abstract
Crystals of superconducting Mo8Ga41 ( K) and MoVGa41 limited solid solution have been grown from the high-temperature Ga flux and confirmed to have the V8Ga41 type of crystal structure at room temperature. Thermodynamic and transport measurements as well as electronic structure calculations were performed to investigate both normal- and superconducting-state properties of Mo8Ga41. The discontinuity in the heat capacity at , in zero magnetic field, indicates a much stronger electron-phonon coupling than in the standard BCS limit. From the heat capacity data, we estimated the electron-phonon coupling constant . The upper critical field is T, while the lower one is only Oe. The upper critical field of Mo8Ga41 exhibits a clear enhancement with respect to the Werthamer-Helfand-Honenberg prediction, consistent with the strong electron-phonon coupling. The MoVGa41 limited solid solution also exhibits superconducting properties, and the critical temperature is reduced only slightly with increasing .
pacs:
74.25.Bt, 74.25.F-, 71.20.Lp, 74.70.AdI Introduction
In previous decades, the investigation of superconductors was aimed at either finding materials with higher critical temperature , or discovering non-typical superconducting behavior that significantly deviates from the conventional BCS model. Mo-based compounds attract interest in the light of both these goals. Several Mo-based carbides were reported to be superconductors with relatively high transition temperatures: -MoC with KPoole (2000), -MoC (8.9 KPoole (2000)), -Mo2C (6.1 KMorton et al. (1971)), -Mo2C (5.2 KMorton et al. (1971)), and Mo3Al2C (9.05 KBauer et al. (2010)). The latter compound is a noncentrosymmetric superconductor. Initially, it was ascribed to a strong-coupling regime with noticeable deviations from the BCS modelBauer et al. (2010); Karki et al. (2010). However, magnetic penetration depth measurements evidenced nodeless energy gap and established the conventional behavior of Mo3Al2CBonalde et al. (2011). In a recent studyBauer et al. (2014), the muon spin relaxation rate measurements did not reveal any indications of time-reversal symmetry breaking in Mo3Al2C and confirmed that this compound features a single s-wave superconducting gap.
Among Mo-based compounds, Mo3Sb7 also attracts interest because of its complex behavior at low temperatures. Two transitions that are observed in this compound at 2.3 K and 50 K can be attributed to the formation of a superconducting state and spin gap, respectivelyCandolfi et al. (2007); Tran et al. (2008a). Therefore, Mo3Sb7 can be classified as a system, where superconductivity and spin fluctuations coexist, thus resembling the behavior of superconductors with strong electronic correlationsTran et al. (2008a). The investigation of Mo3Sb7 by means of muon spin relaxation measurements revealed two possibilities to explain the superconducting properties: a single s-wave superconducting gap scenarioKhasanov et al. (2008, 2010) and a double-gap s-wave modelTran et al. (2008b, 2010). The ambiguity between these two scenarios is so far unresolved, although the gap anisotropy and the presence of nodes are clearly excluded by the recent study of heat transport in Mo3Sb7 at low temperaturesDong et al. (2014).
Searching for other Mo-based superconductors, which may demonstrate non-typical behavior, we focused on Mo8Ga41 intermetallic compound. Earlier, Bezinge and YvonBezinge and Yvon (1984) reported the superconductivity of Mo8Ga41 at K with the upper critical field T at zero temperature. Mo8Ga41 crystallizes in the centrosymmetric three-dimensional V8Ga41 type of crystal structureYvon (1975); Bezinge and Yvon (1984). The relatively high values of the transition temperature and upper critical field call for a detailed study of both normal- and superconducting-state properties that have not been addressed in the previous literature.
Here, we report crystal growth of the intermetallic Mo8Ga41 as well as the MoVGa41 limited solid solution on its base. Electrical resistivity, isothermal magnetization, magnetic susceptibility and heat capacity measurements, and electronic structure calculations were performed to investigate both normal- and superconducting-state properties. By revisiting Mo8Ga41, we aim to provide insight into microscopic features and electronic structure of this compound.
II Experimental details
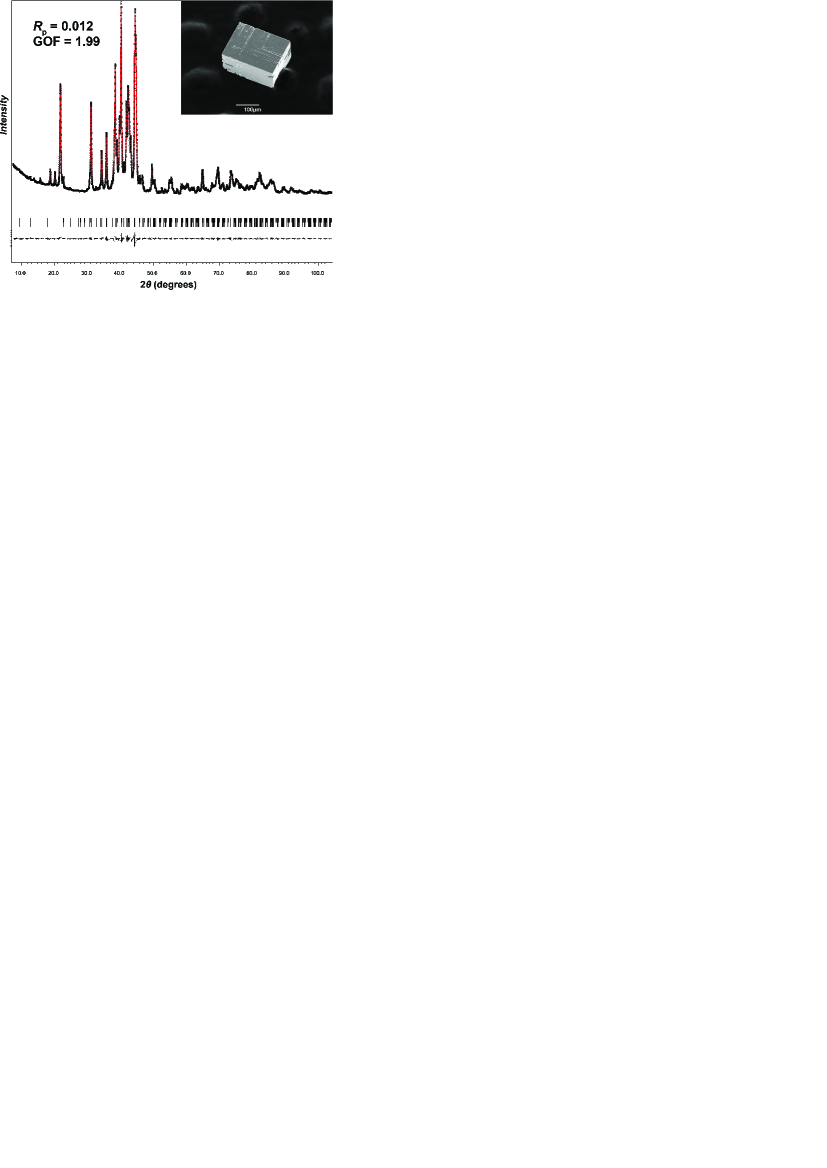
Crystals of MoVGa41 (, 1 and 2) were grown with a high-temperature solution growth method using Ga both as a reagent and flux medium. Mo powder (99.99%, Sigma Aldrich), V pieces (99.9%, Sigma Aldrich) and Ga pieces (99.999%, Sigma Aldrich) were used as starting materials. According to the standard ampoule technique, they were weighed in the Mo:V:Ga molar ratio and placed inside quartz ampoules, which were then sealed under vacuum at pressure less than Torr. Ampoules were annealed in a programmable furnace at 830 ∘C for 55 h and slowly cooled to 170 ∘C at the rate of 4 ∘C/h. After synthesis, the excess of liquid Ga was separated using an Eppendorf 5804R centrifuge, yielding well-shaped silvery-gray crystals (inset of Fig. 1). The obtained crystals were purged from the remainder of Ga metal with diluted 0.5 M HCl during 24 h and washed with distilled water and acetone.
Powder X-ray diffraction data were collected at room temperature using a PANalytical X’Pert3 Powder diffractometer with Cu K radiation in the range between 7.5 ∘ and 104 ∘. The data were analyzed by the Rietveld method in JANA2006 softwarePetříček et al. (2014).
Crystals were analyzed using a scanning electron microscope JSM JEOL 6490-LV operated at 30 kV and equipped with an EDX detection system INCA x-Sight. Before operation, the EDX detection system was optimized using elemental Co as a standard. To perform quantitative elemental analysis, the system was calibrated with the use of elemental Mo and V, and GaP polished samples. All standards are provided by MAC Analytical Standards.
Several rectangular-shaped single crystals of MoVGa41 were picked from the specimens with , 1 and 2 for the subsequent crystal structure determination and refinement. Data sets were collected from the qualitatively best single crystals on a STOE STADIVARI Pilatus diffractometer equipped with a graphite monochromator and a Mo X-ray source ( Å). Details of the single-crystal XRD experiments are presented in Table S1SM . After the numerical absorption correction, which was performed by a multiscan routine, the crystal structure was solved by direct methodsBurla et al. (2003) and refined against with JANA2006 softwarePetříček et al. (2014). The obtained atomic coordinates and selected interatomic distances are listed in Tables S2 and S3SM . The atomic coordinates were standardized by the STRUCTURE TIDY programGelato and Parthé (1987).
Unfortunately, individual single crystals were not large enough for thermodynamic measurements. Therefore, several MoVGa41 (, 1 and 2) crystals were glued together and measured as polycrystalline samples. The temperature dependences of the magnetic susceptibility and isothermal magnetization were measured using a SQUID magnetometer (MPMS, Quantum Design) in magnetic fields between 0 T and 7 T at temperatures between 1.8 K and 300 K. Additionally, isothermal magnetization curves were obtained using the VSM setup of Physical Property Measurement System (PPMS, Quantum Design) in magnetic fields up to 14 T. The heat capacity measurements were performed with a relaxation-type calorimeter (HC option, PPMS, Quantum Design) in magnetic fields between 0 T and 11 T at temperatures between 1.8 K and 20 K.
To investigate transport properties, crystals were crushed in an agate mortar and pressed into rectangular-shaped pellets at the external pressure of 100 bars at room temperature. Densities of the pellets were estimated from their masses and linear sizes to be 87%, 84% and 86% from the theoretical densities for , 1 and 2, respectively. Electrical contacts (Cu wire, 50 m) were fixed using silver-containing epoxy resin (Epotek H20E) hardened at 120 ∘C, and the resistance was measured by the standard four-probe method using the AC transport setup of PPMS in magnetic fields between 0 T and 11 T at temperatures between 1.8 K and 400 K with a field applied perpendicular to the direction of current.
The electronic structure of Mo8Ga41 was calculated within the local density approximation (LDA)Perdew and Wang (1992) of the density functional theory (DFT) as implemented in the full-potential FPLO code (version 14.00-47)Koepernik and Eschrig (1999) with the basis set of local orbitals. The integrations in k-space were performed by the improved tetrahedron methodBlchl et al. (1994) on a grid of k-points for the scalar relativistic calculation. The density of states at the Fermi level in the case of MoVGa41 solid solution was calculated using the rigid band shift approximation.
III RESULTS AND DISCUSSION
III.1 Crystal structure of Mo8Ga41
The powder XRD pattern of crushed crystals of Mo8Ga41 is shown in Fig. 1. All lines in the pattern could be indexed in the (# 148) space group, confirming phase purity of the sample. The respective Rietveld refinement of the data yields the cell parameters Å and Å, which are in good agreement with the previously reported valuesYvon (1975).
A suitable single crystal with the composition Mo8.1(2)Ga40.9(2), confirmed by EDX spectroscopy, was selected from the reaction products to perform structure determination. The collected data could be indexed with the cell parameters Å and Å in the (# 148) space group, which was chosen on the basis of systematic extinction conditions. Atomic positions were determined by direct methods and refined in full-matrix anisotropic approximation. Details of the data collection and refinement are summarized in Table S1, the atomic parameters and selected interatomic distances are given in Tables S2 and S3, respectively. Our refinement shows that Mo8Ga41 crystallizes in the V8Ga41 type of crystal structure, in agreement with the previously reported resultsYvon (1975); Bezinge and Yvon (1984). The refinement indicates the absence of partially occupied positions in the crystal structure, thus confirming that Mo8Ga41 is a stoichiometric compound.
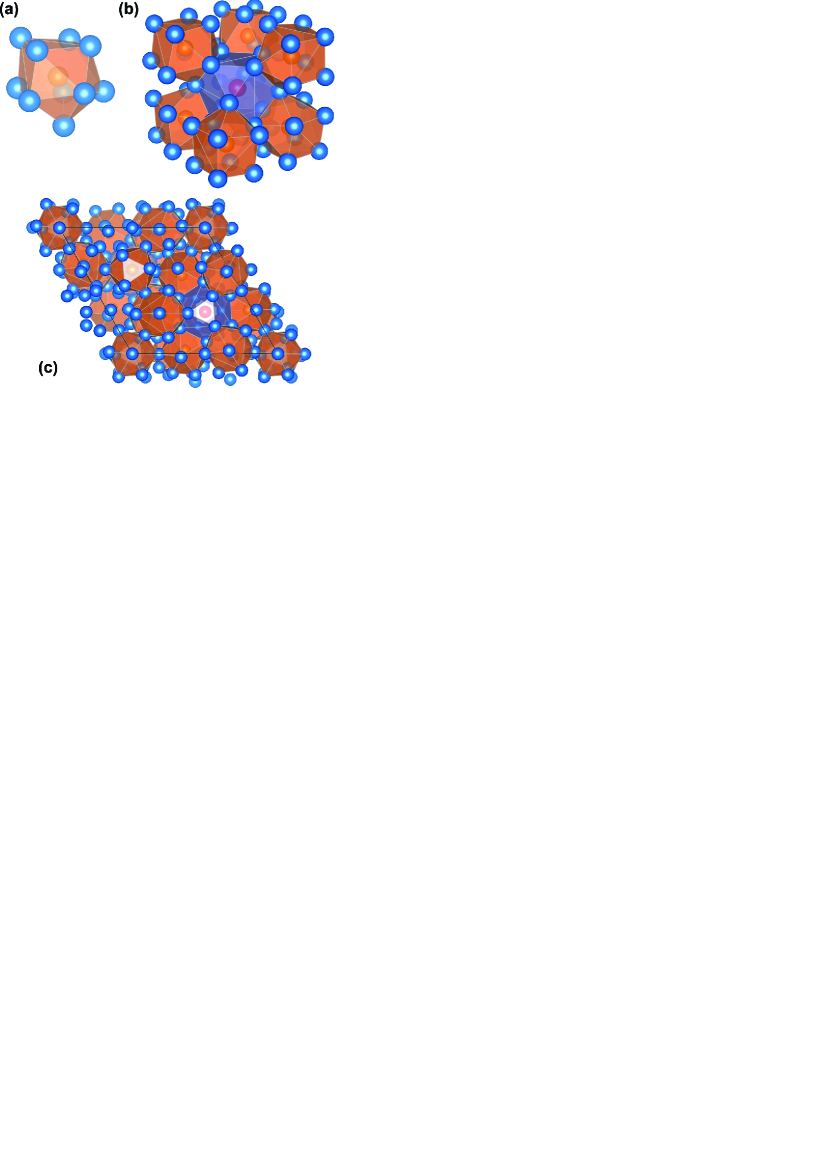
In the Mo8Ga41 crystal structure, Mo and Ga atoms occupy two and nine crystallographic positions, respectively. Mo atoms are well separated from each other, and, consequently, only Ga atoms appear in the first coordination sphere of Mo, which is presented by MoGa10 polyhedra for both the Mo1 and Mo2 positions. The MoGa10 polyhedron (Fig. 2a) consists of one half of a MoGa8/2 cube and one half of a MoGa12/2 icosahedron. MoGa10 polyhedra are interconnected by corners and form the arrangement, in which one triangular face of each polyhedron is shared with a cuboctahedron centered by the unique Ga atom (Fig. 2b). The Ga atom in the centre of a cuboctahedron (crystallographic position 3b (0; 0; 0.5)) has no contacts with Mo atoms in the first coordination sphere. Eight MoGa10 polyhedra are condensed on the faces of a cuboctahedron, which is occupied by one Ga atom, yielding the composition of the compound. This arrangement represents a building block of the Mo8Ga41 crystal structure, which is clearly three-dimensional with Mo atoms being evenly distributed in the matrix of Ga atoms (Fig. 2c).
III.2 Electrical resistivity
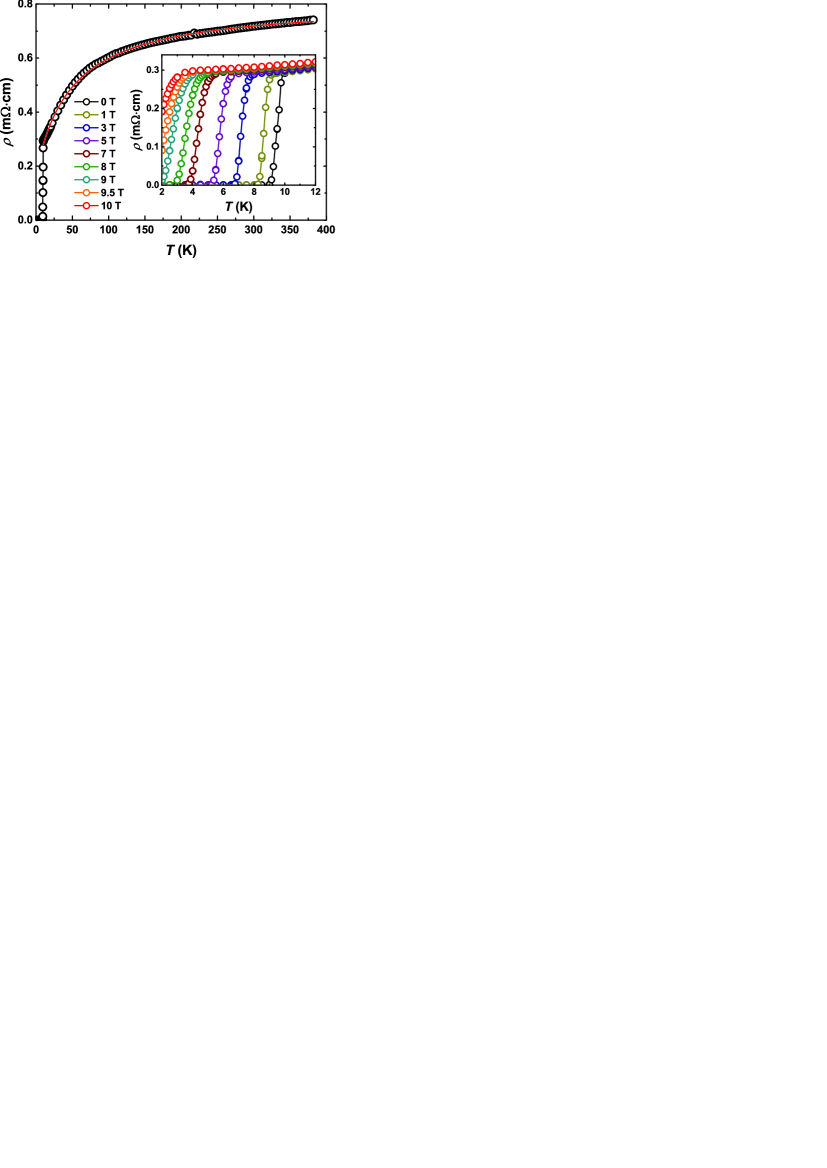
The temperature dependence of the Mo8Ga41 electrical resistivity, measured in zero magnetic field, is shown in Fig. 3. The exhibits metallic behavior with rather high absolute values of resistivity well above the Mott-Ioffe-Regel limit ( m cm). Moreover, at temperatures above 75 K the resistivity grows much slower than at low temperatures. Such behavior was observed in many metallic systems with large resistivityGunnarsson et al. (2003), particularly, in strong-coupled transition-metal A15 superconductorsFisk and Webb (1976). The saturation of resistivity in these compounds occurs when the mean electron free path is comparable to the interatomic distancesGunnarsson et al. (2003); Fisk and Webb (1976). To account for the saturation of resistivity at high temperatures, the parallel resistance model was used, in which . We used a linear behavior for the ideal resistivity: . A fit employing this model is shown in Fig. 3 by the solid red line and yields m cm and m cm.
At low temperatures, the resistivity of Mo8Ga41 clearly indicates a superconducting transition at K, where was determined as an onset temperature of the sharp resisitivity drop. The obtained value of is in agreement with the data reported by Bezinge and YvonBezinge and Yvon (1984). The inset of Fig. 3 shows the around the transition in various magnetic fields. As expected, magnetic field shifts the superconducting transition to lower temperatures. These data were used to extract the upper critical field at the transition temperature , which was determined as an onset temperature of the resistive drop. The upper critical field of Mo8Ga41 is shown in Fig. 8 and will be discussed further in the text.
III.3 Magnetic susceptibility
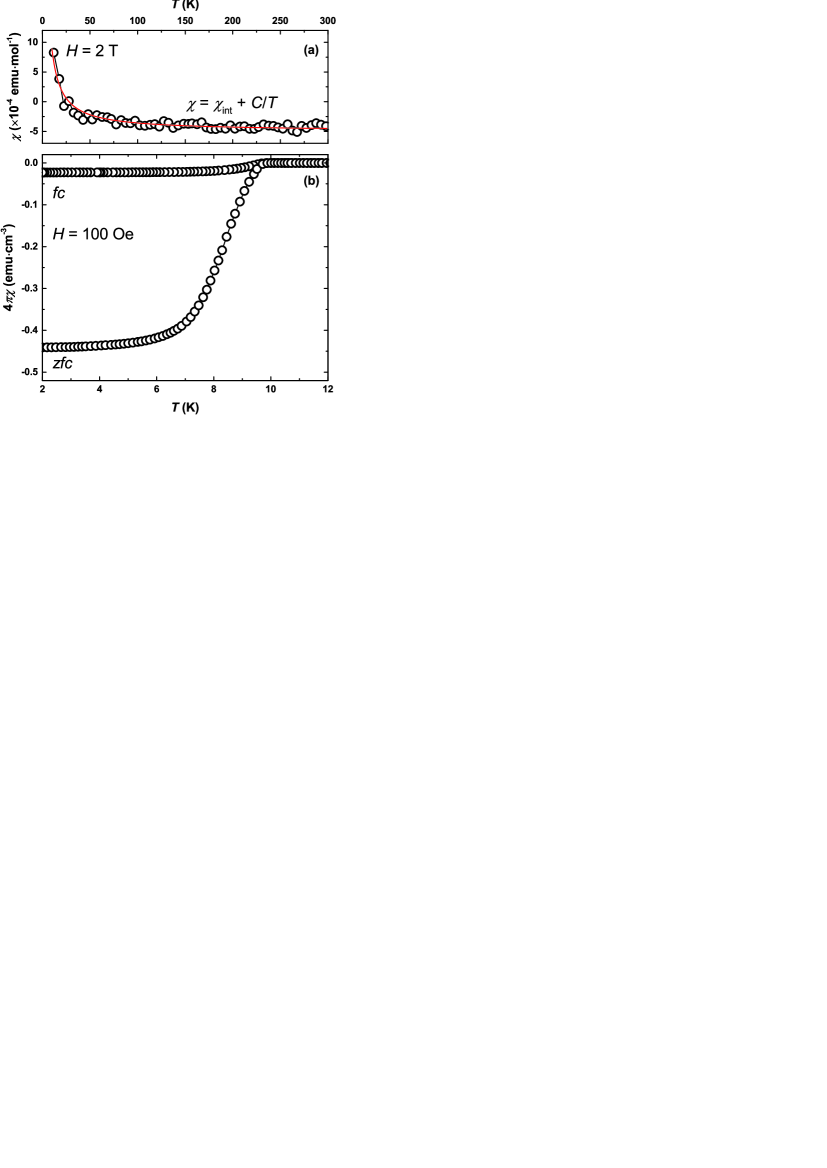
The normal-state magnetic susceptibility of Mo8Ga41, measured in the temperature range between 10 K and 300 K in the T magnetic field, is shown in Fig. 4a. The compound exhibits bulk diamagnetism with the upturn of the magnetic sucseptibility at low temperatures K, which is most likely due to paramagnetic impurities. Temperature dependence of the magnetic susceptibility can be satisfactorily fitted with the equation , resulting in the intrinsic susceptibility emu and emu K . The intrinsic susceptibility includes the following summands: , where is the Pauli paramagnetic spin susceptibility of the conduction electrons, is the diamagnetic orbital contribution from the electrons (ionic or atomic), is the Van Vleck paramagnetic orbital contribution, and is the Landau orbital diamagnetism of the conduction electrons. A realistic estimation of from the above equation is problematic, mostly because of uncertainty in the calculation of value. For instance, the value for Mo ions gradually decreases from emu for to emu for speciesBain and Berry (2008). However, chemical bonding in Mo8Ga41 is neither ionic nor covalent, therefore, the core contribution is hard to estimate precisely.
The sample contains minor amount of paramagnetic impurities resulting in a Curie-like contribution to . The obtained value of is equal to the presence of 3.7 mol.% of the paramagnetic impurity assuming . This impurity contribution can be attributed to the defects induced by the post-synthetic treatment of Mo8Ga41 crystals with diluted 0.5M HCl. However, these impurities should not affect other physical properties, such as electrical resistivity and heat capacity of Mo8Ga41.
The temperature dependence of the zero-field-cooled (zfc) and field-cooled (fc) magnetic susceptibilities of Mo8Ga41, measured in 100 Oe magnetic field, is shown in Fig. 4b. The divergence of the zfc and fc curves indicates a transition to the superconducting state at K, in good agreement with the resistivity data. The fc signal (Meissner effect) is weak, which is most probably due to strong flux line pinning in this type-II superconductor. For the zfc signal, the transition is significantly broadened with temperature, having the width of about 5 K. The reduced volume susceptibility reaches emu at K, however, the data were not corrected for the demagnetization effect, since the sample shape is not well-defined. Assuming the complete diamagnetic response of the specimen, one obtains the demagnetization factor of 2.3, which is somewhat larger than the value of 1.0 expected for an ellipsoid of revolution.
The isothermal magnetization data were used to estimate both lower and upper critical fields of Mo8Ga41 (Fig. 8). was determined as a field, at which the dependence deviates from a linear behavior with the probability of 95% in the low-field data. was determined as a kink on the high-field curve.
III.4 Heat capacity
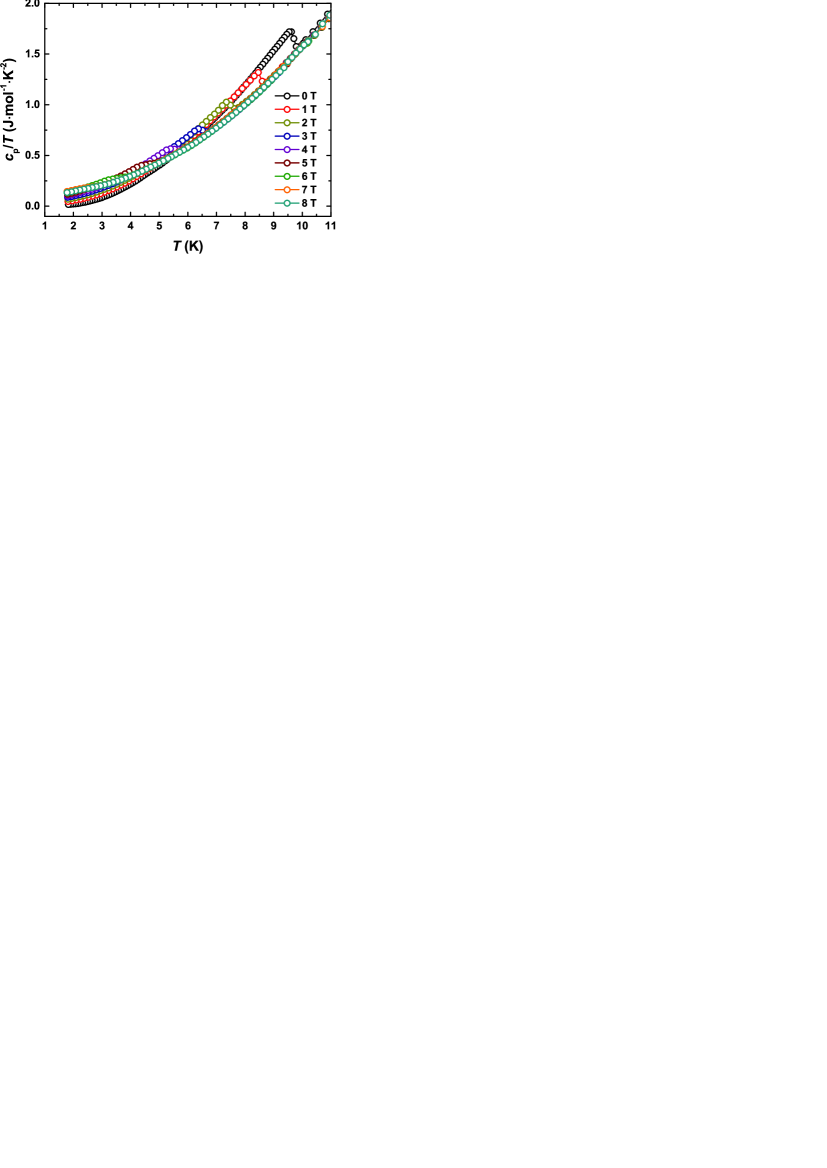
The specific heat versus plot in the temperature range between 1.8 K and 11 K in various magnetic fields is shown in Fig. 5. A sharp anomaly with the transition temperature K is observed in zero magnetic field, confirming bulk superconductivity of Mo8Ga41. The temperature of the transition was determined by a graphical equal-areas approximation (entropy-conserving) for each field . Magnetic field shifts the transition to lower temperatures, and finally, no sign of the transition is observed in the T magnetic field at temperatures above 1.8 K. Using the data obtained in different magnetic fields, we calculated the upper critical field of Mo8Ga41 (Fig. 8).
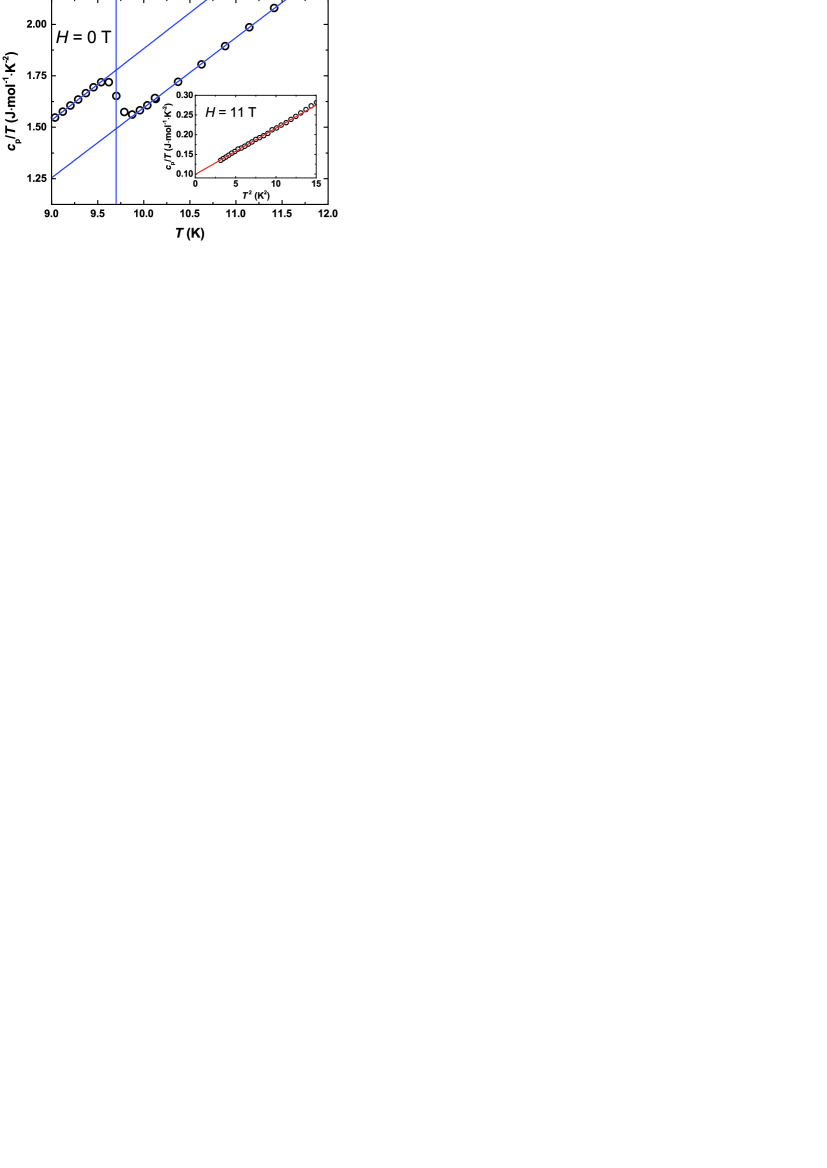
A closer view at the specific heat anomaly in zero magnetic field is presented in Fig. 6. We used line approximation of the data just below and above the transition to extract the value of the jump in the specific heat at . The corresponding construction is shown by blue lines in Fig. 6, with the vertical blue line located at the transition temperature K. According to this approximation, we obtained mJ , although the value might be a bit overestimated by this method due to the smoothness of the superconducting transition.
The normal-state specific heat of Mo8Ga41, measured in the 11 T magnetic field, is shown in the inset of Fig. 6. The versus plot can be fitted by the equation at temperatures between 1.77 K and 3.53 K, giving mJ and mJ , which yields the Debye temperature of K. Thus, the normalized jump of the specific heat at is . This value indicates a much stronger electron-phonon coupling in the superconducting state of Mo8Ga41 than the weak-coupling BCS limit, where is expected. The electron-phonon coupling constant can be estimated using the equation:
| (1) |
where and are the experimental and calculated values of the Sommerfield coefficient of the electronic specific heat, respectively, and is the density of states at the Fermi level. From the band structure calculations we obtained st. , yielding mJ and . In addition, can be estimated in the single-gap superconductivity approximation using McMillan’s formulaMcMillan (1968):
| (2) |
where is the Coulomb pseudopotential, is the Debye temperature, and is the superconducting transition temperature. The Coulomb pseudopotential, , is equal to 0.1 in the case of nearly-free-electron metals, as confirmed empirically for Zn. For many other transition metals, the empirical values of vary only slightly around 0.13, therefore, and 0.15 values could be used for estimating the plausible range of McMillan (1968). The values of K and K, obtained above from the heat capacity data, yield and 1.06 for and 0.15, respectively. Thus, we find a good agreement between the values, calculated using equations (1) and (2). Henceforth, we will take , which corresponds to and mJ .
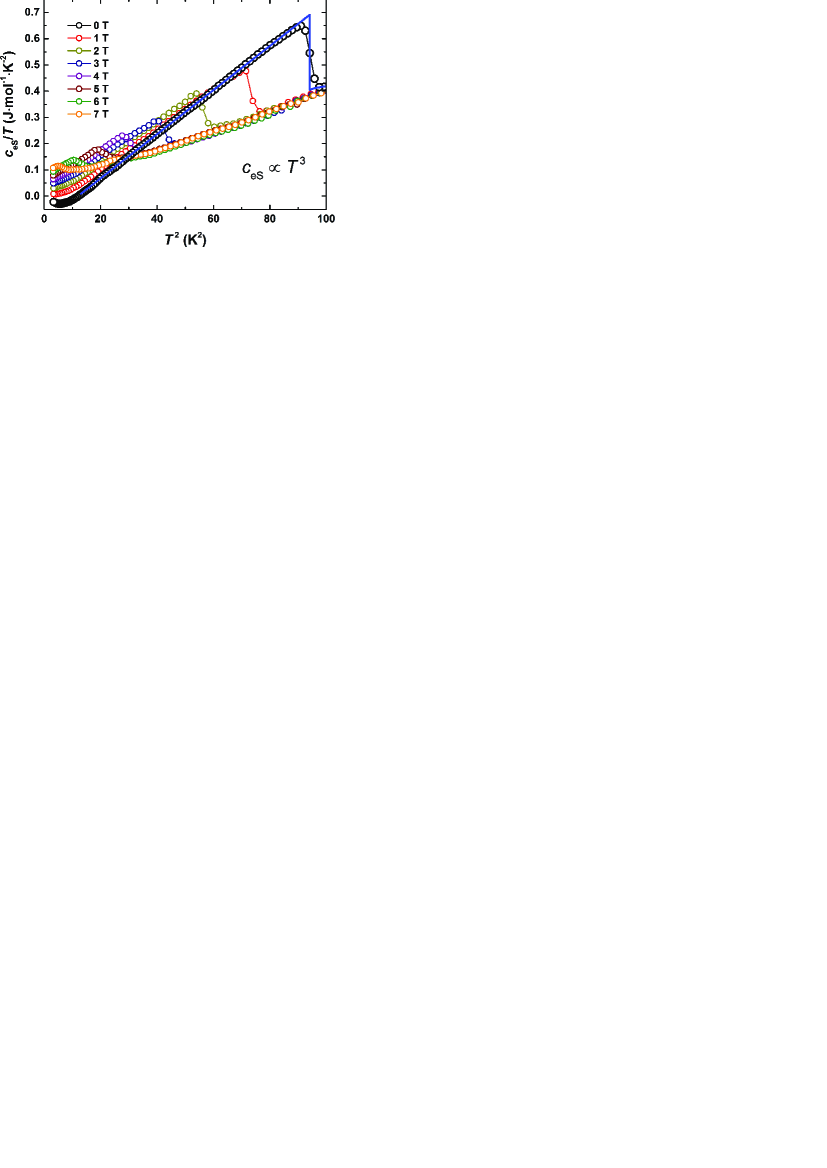
The obtained high value of implies strong electron-phonon coupling in the superconducting state of Mo8Ga41. Together with the unusually high value of , it indicates that the superconductivity of Mo8Ga41 significantly deviates from the BCS limit. To analyze the superconducting state in more detail, we calculated the electronic contribution to the heat capacity by subtracting the lattice term from the data. The resulting versus plot in various magnetic fields is shown in Fig. 7. Unfortunately, the subtraction resulted in negative values of in zero magnetic field below 3.5 K, which is, without doubt, due to the loss of accuracy in the estimation of . However, negative values of are not observed in higher magnetic fields. Moreover, we found that in the superconducting state at temperatures above 3 K (for T the corresponding construction is shown by blue line in Fig. 7). This additionally evidences non-BCS-type superconductivity of Mo8Ga41. At low temperatures, the heat capacity data exhibit an anomaly, which is seen as the upturn of in zero magnetic field. This anomaly may be attributed either to a small fraction of impurities in the specimen or to a non-trivial gap structure of the superconducting state. Due to the low-temperature anomaly, it remains unclear whether or not of Mo8Ga41 is compatible with a nodal structure.
III.5 Lower and upper critical magnetic fields
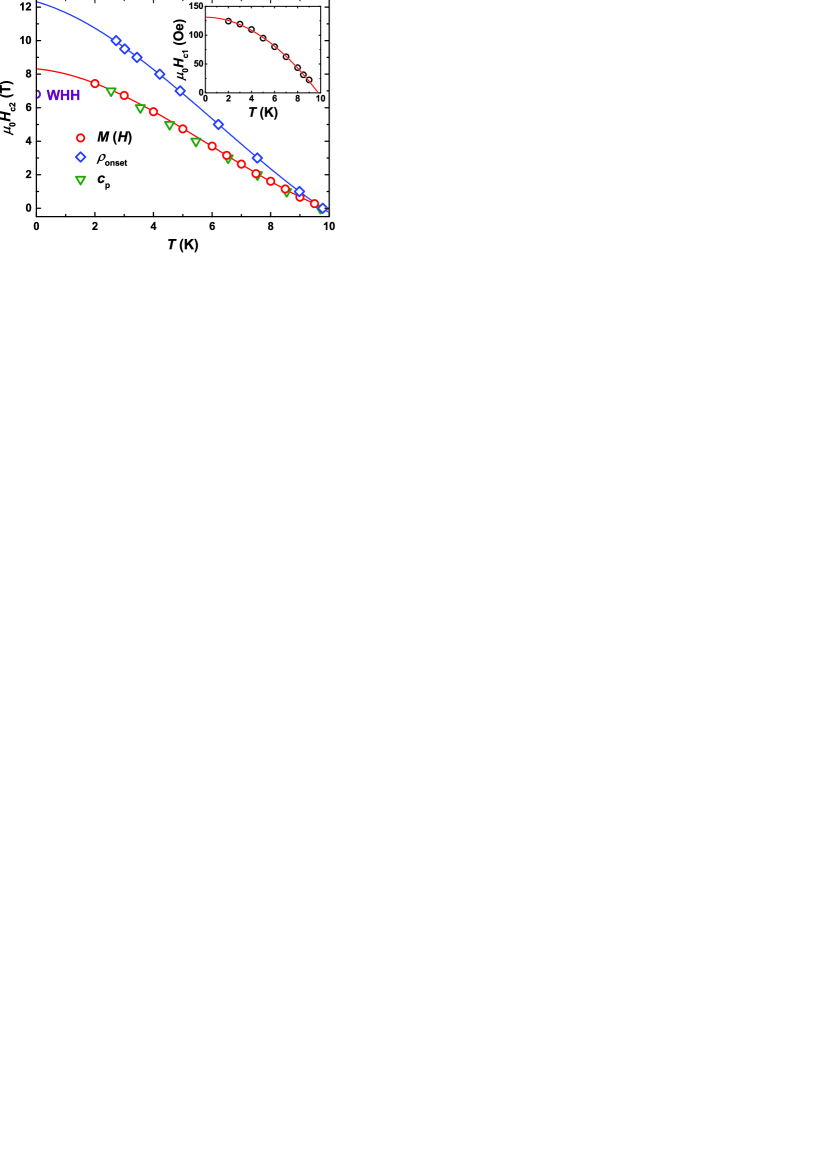
From the magnetic field dependences of magnetization, electrical resistivity and heat capacity, we obtained the upper critical field of Mo8Ga41, which is shown in Fig. 8. The data from and perfectly coincide. The deviation of the upper critical field values, obtained from the resistivity measurements, is likely due to the influence of surface superconductivity, which results in . Regarding details of the resistivity measurements, we expect surface superconductivity emerging in each cross-sectional area of the sample, thus influencing the upper critical field substantially. From a free extrapolation by the second-order polynomial, we obtained T from and T from , yielding . In the ideal case Saint-James et al. (1969), however, deviations are known for a number of type-II superconducting alloys, for which the values of between 1.4 and 2.1 are found experimentallySaint-James et al. (1969); Hempstead and Kim (1964).
We will further discuss from and , only. All the curves vary linearly with down to , thus, the upper critical field can be estimated using the Werthamer-Helfand-Honenberg (WHH) formula for the clean limit: Werthamer et al. (1966). Using the values of T/K and K, we obtained T. Alternatively, a free extrapolation by the second-order polynomial, which is shown by the red line in Fig. 8, leads to the estimated value of the upper critical field T from the data. The observed value shows a clear enhancement with respect to the Werthamer-Helfand-Honenberg prediction, consistent with the strong electron-phonon coupling inferred from the the jump in the specific heat. The value corresponds to the Ginzburg-Landau coherence length of Å, as calculated from , where is the flux quantum . is significantly lower than the Pauli-paramagnetic limit for weak electron-phonon coupling, which is T. The obtained value of yields the Maki parameter , where is the WHH limit of the upper critical field. Alternatively, the Maki parameter can be derived from and using the formula applicable in the dirty limitWerthamer et al. (1966):
| (3) |
where is the experimental value of the Sommerfield coefficient, is the normal-state resistivity extrapolated to zero temperature, and is the molar volume. Using the values of mJ and m cm, we obtained . The difference between the two estimates of may arise from uncertainties in determining the absolute value of resistivity on a polycrystalline sample. Nevertheless, both estimates of indicate that the SC transition should be a second-order phase transition, as expected for a type-II superconductor.
The inset of Fig. 8 shows the lower critical field of Mo8Ga41 obtained from the magnetization data. The data can be satisfactory fitted using the equation . The fitting curve is presented as a red line in the inset of Fig. 8. Assuming that the transition temperature is K, we obtained Oe and . The lower critical field , which indicates the appearance of flux lines in the sample volume, is much lower than the upper critical field of Mo8Ga41, as it is usually observed in type-II superconductors.
III.6 Electronic structure
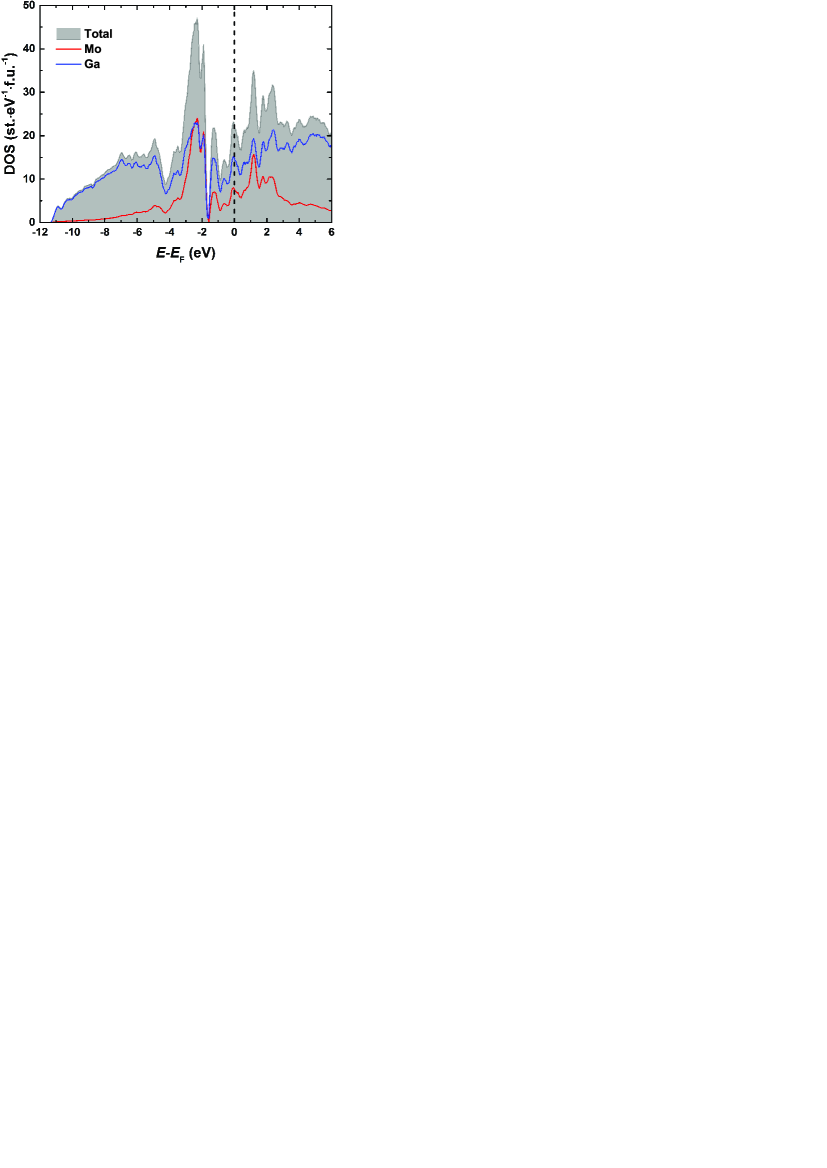
The calculated electronic density of states (DOS) for Mo8Ga41 is shown in Fig. 9. In general, the energy spectrum of Mo8Ga41 is similar to those calculated for the isostructural compounds V8Ga41 and T8GaZnViklund et al. (2001) (T = V, Cr, Mn). The energetically low-lying region between and eV is primarily composed by Ga 4s and 4p contributions with a small admixture of Mo 4d states. At higher energies above eV, the strong bonding between Ga and Mo species is observed. The mixing of Ga 4p and Mo 4d orbitals results in the sharp peak of the DOS reaching almost 50 st. at the relative energy of eV. This peak is separated from the rest of the spectrum by the dip, located at eV. The DOS near the Fermi level at energies between eV and 3 eV also has a sharp peak structure with the Fermi level located close to the local maximum of the DOS, composed mainly of Ga 4p and Mo 4d contributions. The resulting high value of the DOS at the Fermi level is st. yields the bare Sommerfield coefficient of the electronic specific heat mJ .
In the MoVGa41 solid solution, the substitution of V for Mo results in the reduced number of valence electrons per formula unit. Consequently, the Fermi level shifts to lower energies resulting in the density of states at the Fermi level st. and 23.25 st. for and 1.9, respectively. These values only slightly exceed the value obtained for the unsubstituted Mo8Ga41. As a result, the DOS at the Fermi level remains high, thus remaining favorable for the superconductivity. Moreover, a moderate increase of is expected from the derived values of .
III.7 MoVGa41 solid solution
The fact that Mo8Ga41 and V8Ga41 intermetallic compounds possess the same type of crystal structure motivated us to investigate the formation of the MoVGa41 solid solution. Crystals of the solid solution were obtained by the high-temperature gallium flux technique using the Mo:V molar ratio of 7:1 and 6:2 in the reaction mixture for and 2, respectively. The obtained crystals were crushed and analyzed by the standard X-ray diffraction technique, which showed that the specimen with is single-phase, and its diffraction pattern is consistent with the Mo8Ga41 structure type. Moreover, the Mo7.0(2)V1.0(1)Ga41.0(2) elemental composition was determined by EDX spectroscopy, and it perfectly agrees with the nominal one.
According to the XRD results, the specimen with also represents the Mo8Ga41-based solid solution, but additionally it contains a small admixture of the secondary V8Ga41-based phase. For this specimen, the averaged elemental composition of crystals was found to be Mo6.1(1)V1.9(2)Ga41.0(1) by EDXS. All these results suggest the formation of the limited solid solution MoVGa41 with .
Single-crystal XRD experiments were carried out to investigate the crystal structure of the solid solution at room temperature. Details of the crystal data collection and refinement are summarized in Table S1, the obtained atomic parameters and selected interatomic distances are given in Tables S2 and S3, respectively. According to the single-crystal XRD results, the solid solution crystallizes in the parent V8Ga41 type of crystal structure. V atoms substitute Mo atoms almost evenly in two crystallographic positions, as it is seen from the refined occupation factors (s.o.f. in Table S2). Note that the total s.o.f. values were constrained to achieve the compositions determined by EDXS for each sample.
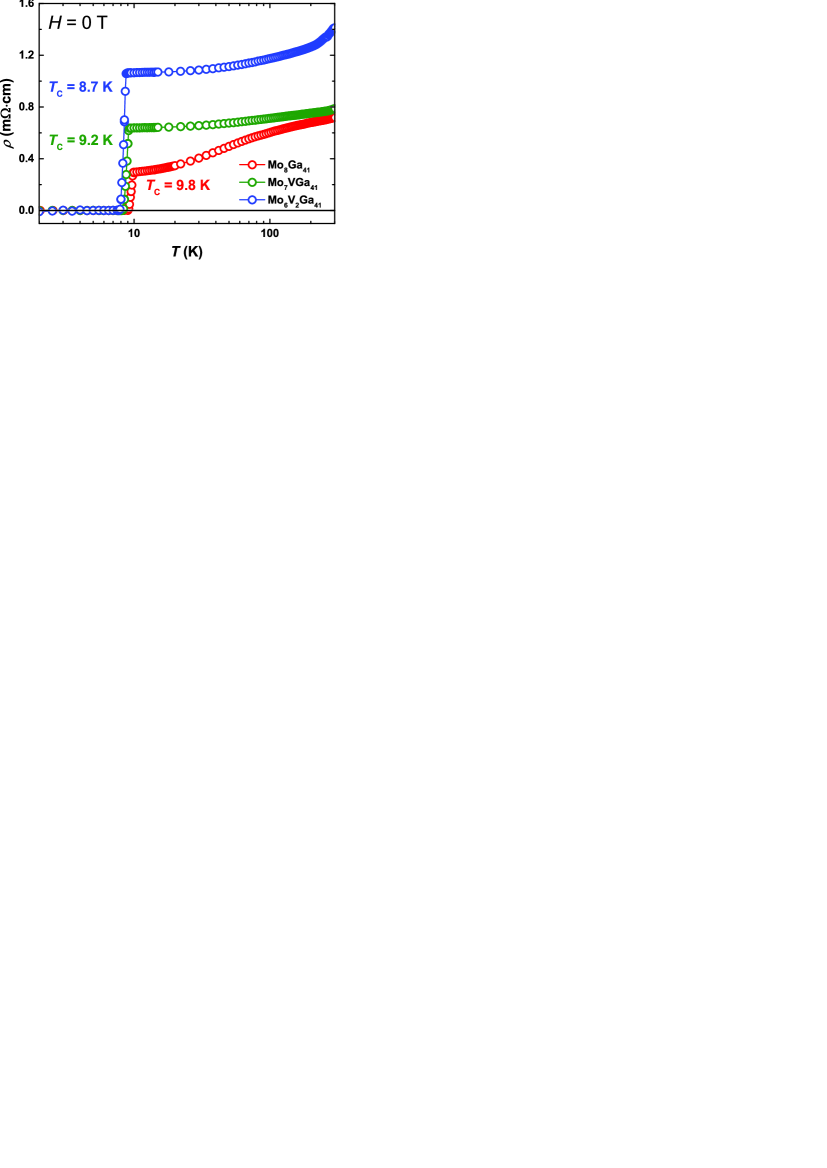
Thermodynamic and transport measurements suggest that the solid solution becomes superconducting at low temperatures, very similar to the parent Mo8Ga41 compound. The curves measured in zero magnetic field for , 1 and 2 are given in Fig. 10. As in the case of Mo8Ga41, the solid solution exhibits metallic behavior with high absolute values of resistivity. The thermodynamic and transport measurements confirm bulk superconductivity of the MoVGa41 solid solution with K, 9.2 K and 8.7 K in zero magnetic field for , 1 and 2, respectively. Thus, the sizable substitution of V for Mo atoms in the crystal structure has rather weak effect on superconductivity, as expected from the high values of for the solid solution. However, the reduction in do not correlate with the evolution of , since the disorder induced by the random arrangement of Mo and V atoms in the crystal structure may also have impact on .
IV Conclusions
Crystals of the intermetallic compound Mo8Ga41 and the limited solid solution on its base, MoVGa41 with , have been grown from the high-temperature Ga flux. Magnetization, specific heat and transport measurements confirm bulk superconductivity of Mo8Ga41 with K. Analysis of the specific heat data gives evidence of various non-BCS-type features: (i) the normalized specific heat jump at , , exceeds significantly the weak-coupling BCS limit, for which . From the specific heat data we estimated the electron-phonon coupling constant , that is consistent with the strong-coupling regime. (ii) The electronic contribution to the specific heat below significantly deviates from the conventional BCS-type behavior, and a power law with is observed above 3 K instead. All these facts evidence the strong-coupling non-BCS-type behavior of Mo8Ga41 and the persistence of this regime upon vanadium doping. Future studies of this material are desirable.
Acknowledgements.
The authors acknowledge insightful discussions with Enno Joon and Walter Schnelle, and thank Victor Tafeenko for the help with single-crystal XRD experiments. The work has been supported by the Russian Foundation for Basic Research, grant #14-03-31181-mol_a, and by the Mobilitas program of the ESF, grant MTT77. A.A.T. is also grateful for the financial support by the Federal Ministry for Education and Research under the Sofja Kovalevskaya Award of the Alexander von Humboldt Foundation. We acknowledge the use of a STOE STADIVARI single-crystal X-ray diffractometer purchased under the Lomonosov MSU program of development.References
- Poole (2000) C. P. Poole, Handbook of superconductivity (Academic Press, London, 2000).
- Morton et al. (1971) N. Morton, B. W. James, G. H. Wostenholm, D. G. Pomfret, M. R. Davies, and J. L. Dykins, J. Less-Common Met. 25, 97 (1971).
- Bauer et al. (2010) E. Bauer, G. Rogl, X. Q. Chen, R. T. Khan, H. Michor, G. Hilscher, E. Royanian, K. Kumagai, D. Z. Li, Y. Y. Li, R. Podloucky, and P. Rogl, Phys. Rev. B 82, 064511 (2010).
- Karki et al. (2010) A. B. Karki, Y. M. Xiong, I. Vekhter, D. Browne, P. W. Adams, D. P. Young, K. R. Thomas, J. Y. Chan, H. Kim, and R. Prozorov, Phys. Rev. B 82, 064512 (2010).
- Bonalde et al. (2011) I. Bonalde, H. Kim, R. Prozorov, C. Rojas, P. Rogl, and E. Bauer, Phys. Rev. B 84, 134506 (2011).
- Bauer et al. (2014) E. Bauer, C. Sekine, U. Sai, P. Rogl, P. K. Biswas, and A. Amato, Phys. Rev. B 90, 054522 (2014).
- Candolfi et al. (2007) C. Candolfi, B. Lenoir, A. Dauscher, C. Bellouard, J. Hejtmánek, E. Šantavá, and J. Tobola, Phys. Rev. Lett. 99, 037006 (2007).
- Tran et al. (2008a) V. H. Tran, W. Miiller, and Z. Bukowski, Phys. Rev. Lett. 100, 137004 (2008a).
- Khasanov et al. (2008) R. Khasanov, P. W. Klamut, A. Shengelaya, Z. Bukowski, I. M. Savić, C. Baines, and H. Keller, Phys. Rev. B 78, 014502 (2008).
- Khasanov et al. (2010) R. Khasanov, A. Shengelaya, I. M. Savić, C. Baines, and H. Keller, Phys. Rev. B 82, 016501 (2010).
- Tran et al. (2008b) V. H. Tran, A. D. Hillier, D. T. Adroja, and Z. Bukowski, Phys. Rev. B 78, 172505 (2008b).
- Tran et al. (2010) V. H. Tran, A. D. Hillier, and D. T. Adroja, Phys. Rev. B 82, 016502 (2010).
- Dong et al. (2014) W. N. Dong, J. Pan, J. Zhang, X. C. Hong, L. P. He, S. Y. Zhou, J. K. Dong, and S. Y. Li, Solid State Communications 195, 84 (2014).
- Bezinge and Yvon (1984) A. Bezinge and K. Yvon, J. Less-Common Met. 99, L27 (1984).
- Yvon (1975) K. Yvon, Acta Cryst. B31, 117 (1975).
- Petříček et al. (2014) V. Petříček, M. Dušek, and L. Palatinus, Z. Kristallogr. 229(5), 345 (2014).
- (17) Tables S1, S2 and S3 are presented as Supplemental materials.
- Burla et al. (2003) M. C. Burla, M. Camalli, B. Carrozzini, G. L. Cascarano, C. Giacovazzo, G. Polidori, and R. Spagna, J. Appl. Cryst. 36, 1103 (2003).
- Gelato and Parthé (1987) L. M. Gelato and E. Parthé, J. Appl. Cryst. 20, 139 (1987).
- Perdew and Wang (1992) J. P. Perdew and Y. Wang, Phys. Rev. B 45, 13244 (1992).
- Koepernik and Eschrig (1999) K. Koepernik and H. Eschrig, Phys. Rev. B 59, 1743 (1999).
- Blchl et al. (1994) P. E. Blchl, O. Jepsen, and O. K. Andersen, Phys. Rev. B 49, 16223 (1994).
- Gunnarsson et al. (2003) O. Gunnarsson, M. Calandra, and J. E. Han, Rev. Mod. Phys. 75, 4 (2003).
- Fisk and Webb (1976) Z. Fisk and G. W. Webb, Phys. Rev. Lett. 36, 1084 (1976).
- Bain and Berry (2008) G. A. Bain and J. F. Berry, J. Chem. Educ. 85(4), 532 (2008).
- McMillan (1968) W. L. McMillan, Phys. Rev. 167, 331 (1968).
- Saint-James et al. (1969) D. Saint-James, G. Sarma, and E. J. Thomas, Type II superconductivity (Elsevier Science & Technology, 1969).
- Hempstead and Kim (1964) C. F. Hempstead and Y. B. Kim, Phys. Rev. Lett. 12, 145 (1964).
- Werthamer et al. (1966) N. R. Werthamer, E. Helfand, and P. C. Honenberg, Phys. Rev. 147, 295 (1966).
- Viklund et al. (2001) P. Viklund, C. Svensson, S. Hull, S. I. Simak, P. Berastegui, and U. Hussermann, Chem. Eur. J. 7(23), 5143 (2001).