11email: gina.santangelo@oa-roma.inaf.it 22institutetext: Osservatorio Astronomico di Roma, via di Frascati 33, 00040 Monteporzio Catone, Italy 33institutetext: LERMA, Observatoire de Paris, PSL Research University, CNRS, UMR 8112, F-75014, Paris France 44institutetext: Sorbonne Universités, UPMC Univ. Paris 6, UMR 8112, LERMA, F-75005, Paris, France 55institutetext: Univ. Grenoble Alpes, IPAG, F-38000 Grenoble, France 66institutetext: CNRS, IPAG, F-38000 Grenoble, France 77institutetext: Laboratoire AIM-Paris-Saclay, CEA/DSM/Irfu – CNRS – Université Paris Diderot, CE-Saclay, 91191 Gif-sur-Yvette, France 88institutetext: IRAM, 300 rue de la Piscine, 38406 Saint Martin d’Hères, France 99institutetext: Max-Planck-Institut für Radioastronomie, Auf dem Hügel 69, 53121 Bonn, Germany 1010institutetext: ESO, Karl-Schwarzschild-Strasse 2 D-85748 Garching bei München, Germany
NGC1333-IRAS4A as seen by the CALYPSO IRAM-PdBI survey††thanks: Based on observations carried out with the IRAM Plateau de Bure Interferometer. IRAM is supported by INSU/CNRS (France), MPG (Germany), and IGN (Spain).
Jet multiplicity in the proto-binary system NGC1333-IRAS4A
Abstract
Context. Owing to the paucity of sub-arcsecond (sub)mm observations required to probe the innermost regions of newly forming protostars, several fundamental questions are still being debated, such as the existence and coevality of close multiple systems.
Aims. We study the physical and chemical properties of the jets and protostellar sources in the NGC1333-IRAS4A proto-binary system using continuum emission and molecular tracers of shocked gas.
Methods. We observed NGC1333-IRAS4A in the SiO(65), SO(6554), and CO(21) lines and the continuum emission at 1.3, 1.4, and 3 mm using the IRAM Plateau de Bure Interferometer in the framework of the CALYPSO large program.
Results. We clearly disentangle for the first time the outflow emission from the two sources A1 and A2. The two protostellar jets have very different properties: the A1 jet is faster, has a short dynamical timescale (103 yr), and is associated with H2 shocked emission, whereas the A2 jet, which dominates the large-scale emission, is associated with diffuse emission, bends, and emits at slower velocities. The observed bending of the A2 jet is consistent with the change of propagation direction observed at large scale and suggests jet precession on very short timescales (200600 yr). In addition, a chemically rich spectrum with emission from several complex organic molecules (e.g. HCOOH, CH3OCHO, CH3OCH3) is only detected towards A2. Finally, very high-velocity shocked emission (50 km s-1) is observed along the A1 jet. An LTE analysis shows that SiO, SO, and H2CO abundances in the gas phase are enhanced up to (34)10-7, (1.41.7)10-6, and (37.9)10-7, respectively.
Conclusions. The intrinsic different properties of the jets and driving sources in NGC1333-IRAS4A suggest different evolutionary stages for the two protostars, with A1 being younger than A2, in a very early stage of star formation previous to the hot-corino phase.
Key Words.:
Stars: formation – Stars: low-mass – ISM: jets and outflows – ISM: individual objects: NGC1333-IRAS4A – ISM: molecules1 Introduction
Although multiple systems are a common outcome of the star formation process, the mechanism for their formation is still being debated (e.g. Tohline 2002; Reipurth et al. 2014, and references therein). In this context, information about the system’s multiplicity, coevality, and environment are particularly crucial. The ideal laboratories for these studies are very young sources that have not undergone significant evolution and are thus likely keep a memory of the initial physical and chemical conditions. Class 0 protostars, with lifetimes of less than a few 105 yr, represent the earliest stage of low-mass star formation, when most of the mass is still in the form of a dense infalling envelope (e.g. André et al. 2000; Evans et al. 2009). Once it is sufficiently luminous, the central protostar radiatively heats the surrounding inner envelope, and grain mantle evaporation occurs, which triggers a hot-corino chemistry rich in complex organic molecules (COMs) (van Dishoeck & Blake 1998; Ceccarelli 2004; Bottinelli et al. 2004). Protostars also drive fast jets (e.g. Arce et al. 2007; Ray et al. 2007; Frank et al. 2014) that impact the high-density parent cloud and generate shock fronts. This leads to significant enhancements in the abundance of several molecules, such as H2O, CH3OH, and SiO (e.g. van Dishoeck & Blake 1998). High angular resolution studies of Class 0 protostars are thus needed to probe the innermost regions (100 AU) with the aim of disentangling the emission originating from the different processes: the launch of the jet, the outflow cavity emission, and the chemistry of the hot corino. We present here new observations of molecular tracers of shocked gas and continuum emission towards the NGC1333-IRAS4A protostellar system (hereafter IRAS4A) located at 235 pc (Hirota et al. 2008). Observations are part of the Continuum and Lines in Young ProtoStellar Objects (CALYPSO)111http://irfu.cea.fr/Projects/Calypso large program, aimed at studying a large sample of Class 0 protostars at sub-arcsecond resolution with the IRAM Plateau de Bure Interferometer (hereafter PdBI).
IRAS4A has been identified as a binary Class 0 system using mm interferometry (Jennings et al. 1987; Sandell et al. 1991; Lay et al. 1995; Looney et al. 2000). Since the binary components have never been resolved in the infrared band, the luminosity of each protostar is not known. The bolometric luminosity of the IRAS4A system has been derived by Enoch et al. (2009) to be 4.2 and later by Kristensen et al. (2012) and Karska et al. (2013) to be 9.1 using PACS continuum measurements. The two Class 0 components, IRAS4A1 and IRAS4A2 (hereafter A1 and A2), have a separation of only about 1.8′′ (420 AU). A1 is more than three times brighter in the millimetre and centimetre continuum than its companion A2 (Looney et al. 2000; Reipurth et al. 2002; Jørgensen et al. 2007), whereas it is weaker in NH3 emission (Choi et al. 2007). The IRAS4A system is associated with a spectacular large-scale (a few arcminutes) bipolar outflow (PA45∘) observed in several tracers, such as CO, SiO, and H2O (e.g. Blake et al. 1995; Choi 2001, 2005; Yıldız et al. 2012; Santangelo et al. 2014). A shorter southern monopolar blue-shifted lobe (PA10∘) is observed in SiO by Choi (2005) with no clear northern counterpart. However, none of the observations to date resolve the emission within 10′′ from the protostars and therefore they do not allow us to disentangle the outflow emission and directly identify the driving sources. In this context, the new high angular resolution observations of CO, SiO, and SO presented here allow us to probe the innermost region of IRAS4A. The goal is to study jet multiplicity and the physical and chemical properties of the jet and the driving sources.
2 Observations
IRAS4A was observed at 1.3, 1.4, and 3 mm with the IRAM PdBI between February 2011 and February 2013 using both the A and C configurations. The baseline range of the observations is 15762 m, which allows us to recover emission on scales from 18′′ to 035 at 1.3 mm. WideX backends were used to cover the full 3.8 GHz spectral window at the spectral resolution of 2 MHz (2.7 km s-1 at 1.4 mm). In addition, higher resolution backends were employed to observe the SiO(54), SO(6554), and CO(21) lines at 217.105, 219.949, and 230.538 GHz. Calibration was carried out following standard procedures, using GILDAS-CLIC222http://www.iram.fr/IRAMFR/GILDAS/. The phase RMS is 50∘ and 80∘ for the A and C tracks, with precipitable water vapour (PWV) between 0.5 mm and 2 mm and system temperatures between 100 K and 250 K. The uncertainty on the absolute flux scale is 10%. The synthesised FWHM beam is 0704 (PA = 19∘) at 1.3 mm, 1108 (19∘) at 1.4 mm, and 1813 (39∘) at 3 mm. The typical RMS noise per 1 km s-1 channel is 8 mJy/beam at 1.3 mm, 10 mJy/beam at 1.4 mm, and 3 mJy/beam at 3 mm.
3 Results
3.1 Continuum emission: source multiplicity and properties
| Fluxa𝑎aa𝑎aFluxes are measured by integrating over 1′′. The uncertainty on the absolute flux is 10%, which translates into an uncertainty of 15% on the spectral indexes (see Sect. 3.1). | ||||
| Source | (J2000) | (J2000) | 1.3mm | 3mm |
| (03h 29m) | (31∘ 13′) | (mJy) | (mJy) | |
| A1 | 1053 | 310 | 1230 | 144 |
| A2 | 1042 | 323 | 369 | 40 |
| A3 | 1044 | 359 | 187 | 2 |
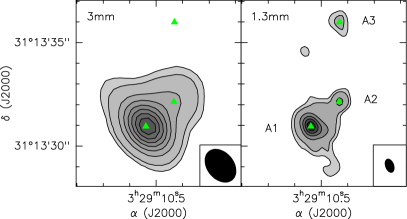
Emission maps of the 1.3 and 3 mm continuum are shown in Fig. 1. Both known protostars A1 and A2 are detected in the continuum emission at all frequencies with A1 being brighter than A2. They are well resolved at 1.3 mm, with a separation of 18. In addition, a third continuum source (hereafter A3) is detected for the first time only at 1.3 mm at a position (02, 37) offset from A2. Positions and integrated fluxes of the three continuum sources are derived by performing a power-law fit to the continuum visibilities of the detected sources (see Table 1).
We estimate the spectral index of the continuum emission (where flux density is ) for the three detected sources. Spectral indexes of 2.3 and 2.4 are obtained for sources A1 and A2, respectively, which are consistent with dust thermal radiation from embedded protostellar objects. On the other hand, the non-detection of source A3 at 1.4 and 3 mm implies a steep spectrum for this source with a spectral index 4.9 (based on the upper limit on the 3 mm flux density), which is not consistent with a protostellar nature. Compact continuum emission along protostellar jets has already been observed in other sources (e.g. Gueth et al. 2003; Maury et al. 2010; Codella et al. 2014); envelope emission or shock-heated dust along the jet have been suggested as possible explanations for the origin of these features. However, a larger statistically suitable sample is crucial in order to assess this issue. A detailed analysis of the continuum emission in the whole CALYPSO sample will be presented in a forthcoming paper.
3.1.1 Hot corino at A2
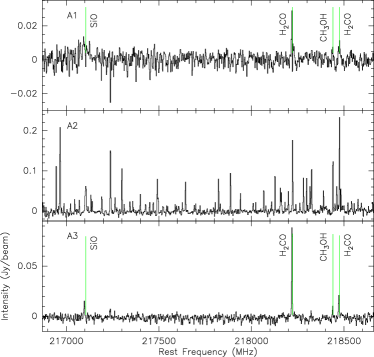
Figure 2 presents the WideX spectra observed at the three continuum source positions. A chemically rich spectrum is detected only towards A2, highlighting a hot-corino chemistry for this protostar. As already shown by Taquet et al. (2015), emission from several COMs is indeed observed at A2, such as CH3OH (methanol), HCOOH (formic acid), CH3OCHO (methyl formate), and CH3OCH3 (dimethyl ether); similar molecules are observed towards the Class 0 protostar IRAS2A (Maury et al. 2014). A detailed identification and analysis of the detected lines will be presented in a forthcoming paper. For the scope of this paper, this emission is indicative of a rich hot-corino chemistry associated with source A2. On the other hand, only SiO, H2CO, and CH3OH are clearly detected towards the continuum sources A1 and A3.
3.1.2 Infall signatures
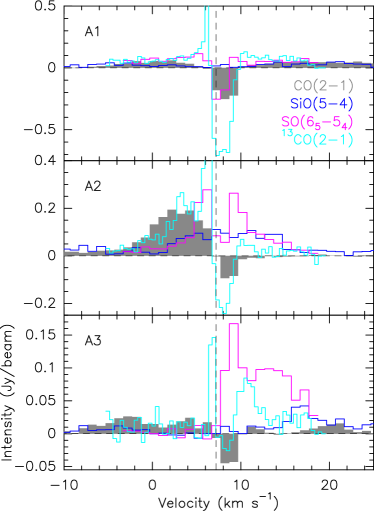
Figure 3 presents the high-resolution spectra at the continuum source positions of the selected molecular species. Absorption is detected towards A1 and A2 in 12CO, 13CO, and SO at similar slightly red-shifted velocities (8.2 km s-1). In particular, the 13CO spectra show inverse P-Cygni profiles, which are indicative of infall motions. Similar profiles were previously detected in H2CO and CS with PdBI and NRO-NMA by Di Francesco et al. (2001). The authors modelled the emission with a two-layer radiative transfer code and interpreted it as infall in the warm gas associated with the young stellar objects. Inverse P-Cygni profiles were also observed in 13CO with the SMA by Jørgensen et al. (2007) and interpreted as larger scale infall motions in the ambient cloud or outer envelope rather than collapse onto the central protostars. For the first time, we spatially resolve the absorption and detect infall signatures associated with both known protostars A1 and A2 at similar velocity. Whether the detected spectra presented here probe infall towards each source or global infall of a common envelope is not clear from our data and a detailed modelling of the line profiles is certainly needed in order to resolve this issue. However, this is beyond the scope of this paper. We note that infall motions on larger scales associated with the envelope of IRAS4A were observed in HCN by Choi et al. (1999) and in CS, C34S, and N2H+ by Belloche et al. (2006).
Interestingly, red-shifted absorption is also detected in 12CO and 13CO towards the newly detected continuum source A3.
3.2 Line emission: jet multiplicity
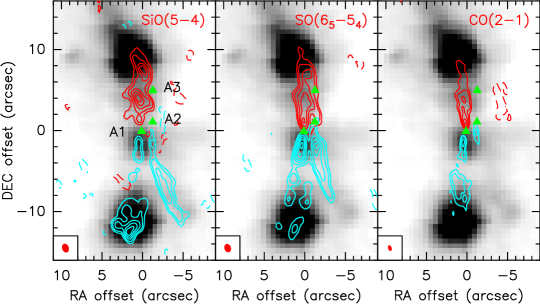
Figure 4 shows the velocity-integrated emission of SiO(54), SO(6554), and 12CO(21) towards IRAS4A, in comparison with the Spitzer-IRAC map of band 2 at 4.5 m. This IRAC band covers several H2 emission lines, which are particularly strong in shocked regions making IRAC images good tracers of H2 emission (e.g. Reach et al. 2006; Neufeld & Yuan 2008). For the first time the bipolar outflow is clearly disentangled in the southern blue-shifted emission into two different flows tracing the jets driven by the A1 and A2 protostars. SiO emission is detected for the first time in IRAS4A at close distance from the continuum sources, inside 10′′ (2400 AU, see Choi 2005; Choi et al. 2006). Strong IRAC H2 emission is only associated with the jet from A1, which possibly indicates a stronger shock or the presence of denser ambient material. In particular, the bright southern and northern H2 knots in the IRAC map coincide with the tips of the blue-shifted and red-shifted (see also Fig. 5) A1 lobes seen in our SiO map. Since there is no H2 or single-dish CO outflow signature further along the A1 jet axis, as can be seen on larger scales from the IRAC and APEX maps in Santangelo et al. (2014), it appears that here we are tracing the terminal shocks, where the A1 outflow impacts the ambient cloud. Remarkably, our observations detect a sharp bend to the south-west of the blue-shifted A2 jet at a distance of about 4′′ from the driving source. On the other hand, emission from the two sources cannot be disentangled in the velocity-integrated SiO red-shifted northern emission, possibly because geometric effects cause mixing of the emission; possible additional confusion may be due to the presence of the continuum source A3.
The two jets are also unraveled in the SO emission. The SO morphology is different with respect to SiO, with the latter peaking at the tip of the blue-shifted lobe of the A1 outflow, in association with the IRAC H2 emission, and clearly delineating the A2 jet over more than 10′′ all the way down to the source, whereas the SO emission peaks closer to the protostars. Finally, in the CO emission only the A1 jet is clearly detected; the strongest peak of the blue-shifted lobe appears to be shifted with respect to the IRAC H2 and SiO emissions, further suggesting a chemical differentiation in the jet. Faint and compact blue-shifted CO emission associated with the A2 jet is only detected close to the driving source, before the bend.
3.3 Line emission: jet kinematics
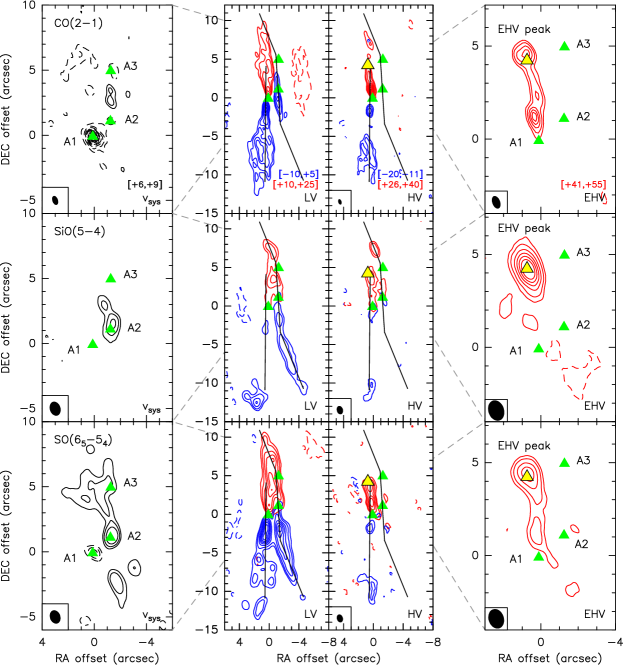
A more detailed view of the region, showing in particular the multiplicity and differentiation of the A1 and A2 jets, is given by the channel maps of the molecular emission presented in Fig. 5. Four velocity ranges are identified in CO, SiO, and SO emissions, corresponding to the systemic (1.5 km s-1), low-velocity (LV, from 2.5 km s-1 to 17.5 km s-1), high-velocity (HV, from 18.5 km s-1 to 32.5 km s-1 and from 18.5 km s-1 to 27.5 km s-1), and extremely high-velocity (EHV, from 33.5 km s-1 to 47.5 km s-1) gas. Compact and spatially unresolved absorption is detected around systemic velocity (7.2 km s-1, Belloche et al. 2006) towards A1, A2, and A3 in CO emission and only towards A1 in SO, as already shown in Sect. 3.1.2. An extended structure with A2 at the vertex is seen in SO emission at the systemic velocity, possibly probing the hot corino and outflow cavity walls (see also Sect. 3.1.1 and Codella et al. 2014, for NGC1333-IRAS2A).
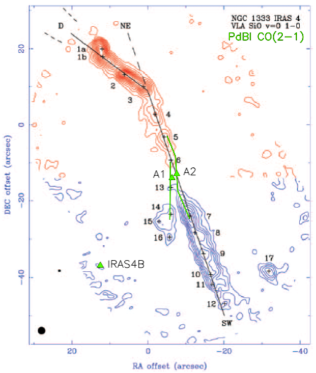
The molecular emissions integrated over the higher velocity channels show that we are finally able to disentangle both the blue- and red-shifted outflow emissions associated with the two protostars A1 and A2. In particular, we resolve the red-shifted counterpart of the A1 southern outflow for the first time. The A1 jet appears to be faster than the A2 jet as shown by its association with HV and EHV emissions; in particular, jet-like gas at red-shifted EHV is detected in association with the A1 jet, showing a strong compact peak about 4′′ north with respect to A1. On the other hand, the A2 jet is brightest in the LV range, with only faint molecular line emission in the HV range. The sharp bend of the A2 jet observed at these small scales in the velocity-integrated blue-shifted SiO and SO emissions (see previous section) is detected in the LV and HV channel maps. They also clearly show a symmetric bending in the northern red-shifted A2 jet emission at about 4′′ from A2, which is close to the continuum source A3. The symmetric morphology of the bend suggests a jet precession on very short timescales. Indeed, assuming an observed velocity of 1020 km s-1 (see Fig. 3) and an inclination with respect to the line of sight of about 45∘60∘ (see Yıldız et al. 2012), the dynamical age of the bend is about 200600 yr. After this bending, the axes of the A2 jet correspond to the axes of the large-scale SiO and CO outflow emissions (see e.g. Blake et al. 1995; Girart et al. 1999; Choi 2001, 2005, and Fig. 7 in Appendix A), confirming that the large-scale outflow emission is driven by the A2 protostar. In this context, the non-detection of CO(21) emission associated with the A2 jet at distance larger than 3′′ even in the LV range may be due to the filtering out of extended emission by the interferometer, given the high angular resolution at 1.3 mm.
4 Analysis and discussion
4.1 Chemical abundances in the A1 jet at the EHV peak
| LV (925 km s-1) | (E)HV (2655 km s-1) | |||||||||
|---|---|---|---|---|---|---|---|---|---|---|
| =40 K | =300 K | =40 K | =300 K | |||||||
| Mol. | a𝑎aa𝑎a(12C/13C)77 (Wilson & Rood 1994). | a𝑎aa𝑎a(12C/13C)77 (Wilson & Rood 1994). | b𝑏bb𝑏b(12CO/H2). | b𝑏bb𝑏b(12CO/H2). | ||||||
| (K km s-1) | (cm-2) | (10-8) | (cm-2) | (10-8) | (K km s-1) | (cm-2) | (10-8) | (cm-2) | (10-8) | |
| 13CO | 8.6 | 1.21016 | – | 6.41016 | – | – | – | – | – | – |
| 12COc𝑐cc𝑐cThe 12CO(21) data have been convolved to match the angular resolution at 1.4 mm (1108). | – | – | – | – | – | 31.4 | 2.01016 | – | 1.11017 | – |
| SiO | – | – | – | – | – | 61.9 | 8.31013 | 41 | 3.21014 | 29 |
| SO | 14.4 | 1.81014 | 1.9 | 7.31014 | 1.5 | 28.7 | 3.51014 | 170 | 1.51015 | 140 |
| p-H2CO | 14.6 | 1.51014 | 1.7 | 2.11015 | 4.3 | 5.8 | 6.21013 | 30 | 8.51014 | 79 |
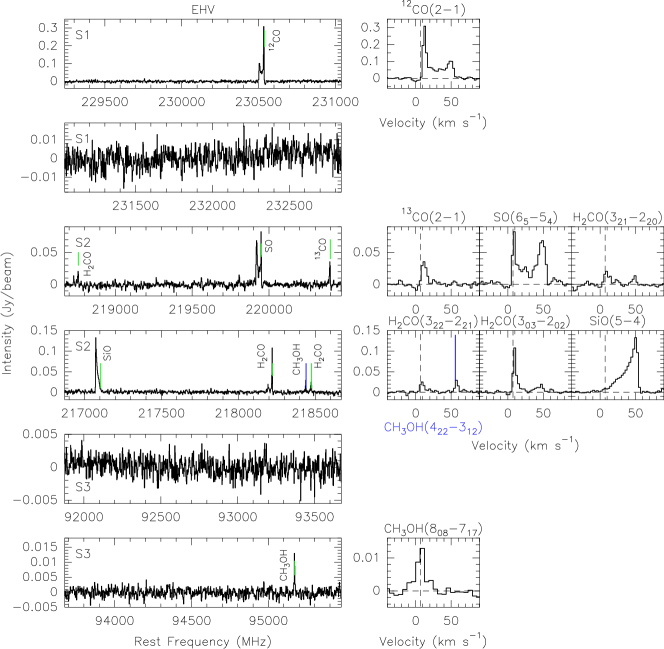
Red-shifted EHV (4155 km s-1) emission is detected in CO, SiO, SO, and H2CO (see Figs. 5, 6, and 8). It shows a compact (1611 from visibility fitting) morphology in the SiO emission with the emission peak located (07, 43) offset from A1, whereas a more elongated and collimated structure pointing to A1 is detected in the CO and SO emissions.
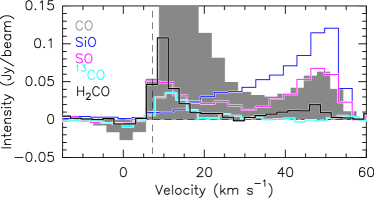
A line profile comparison at the EHV peak reveals that CO, SO, and H2CO show an emission peak at low velocity (10 km s-1) and a secondary EHV peak around 50 km s-1; the non-detection of EHV 13CO is due to a lack of sensitivity (if CO is optically thin, the expected 13CO at the EHV peak of 12CO is approximately the same as the rms noise). On the other hand, the SiO line profile presents an emission peak at 50 km s-1 with a wing extending down to the systemic velocity. We note that this is the first detection of SiO emission at such high velocity in this source (Choi 2005; Choi et al. 2011). The similarity between peak velocities and line profiles of the molecules detected at EHV suggests that they share a common origin, tracing the primary molecular jet (see also Codella et al. 2014).
Abundances of the detected species have been derived under the assumption of LTE conditions, using CO as a proxy for H2 emission. The emission has been divided into two velocity ranges: LV (925 km s-1) and (E)HV (2655 km s-1). For the analysis, two values of temperature have been considered: 40 and 300 K. Since 12CO emission is optically thick at velocities close to systemic (11), we use 13CO (0.1) to derive abundances in the LV range, assuming optically thin conditions and 12C/13C77 (Wilson & Rood 1994). On the other hand, abundances in the (E)HV component were obtained using 12CO (14), assuming a typical CO abundance of 10-4. Abundance enhancements are derived for all species in the high-velocity gas (Table 2) and suggest a shock origin. In particular, a SiO abundance of (2.94.1)10-7 is derived in the high-velocity gas, consistent with previous single-dish estimates in Class 0 outflows (e.g. Bachiller & Pérez Gutiérrez 1997; Tafalla et al. 2010) and in agreement with current shock model predictions (Gusdorf et al. 2008a, b; Guillet et al. 2009, 2011). However, we note that Cabrit et al. (2012) showed that PdBI SiO(54) emission in the HH212 protostellar jet can be optically thick at high velocities and derived an SiO abundance up to about 310-6.
It has been observed that the SO abundance is enhanced by two orders of magnitude from (1.51.9)10-8 in the low-velocity gas to (1.41.7)10-6 in the high-velocity gas. The derived abundances are slightly higher than the values observed by Bachiller & Pérez Gutiérrez (1997) and Tafalla et al. (2010), i.e. (23)10-7, although their estimates are based on single-dish observations. On the other hand, an SO abundance of 210-6 is derived by Lee et al. (2010) in the HH211 Class 0 jet from SMA interferometric observations. Pineau des Forets et al. (1993) and Flower & Pineau des Forets (1994) modelled SO emission in C-type shocks and predicted an increase of SO abundance in shock regions with maximum values of a few 10-7, consistent with our estimates.
Finally, an enhancement of the p-H2CO abundance from (1.74.3)10-8 to (37.9)10-7 is observed between the low- and high-velocity gas components. This is not in agreement with the estimates for Class 0 outflows by Tafalla et al. (2010), who reported higher abundance values in the low-velocity gas (a few 10-8 with respect to 10-8 for the high-velocity gas). Their results, however, are based on single-dish observations. It is worth noting that this molecule is expected to be released from icy mantles, which would support our detection of an abundance increase in fast shocks. Given the size of the beam, the estimated H2CO abundances are in agreement with C-type shock models including grain-grain processing, as described in Anderl et al. (2013).
4.2 Different properties of the A1 and A2 jets
The new PdBI data presented in this paper highlight the intrinsic differences between the jets driven by the two protostars A1 and A2. In particular, the jets present different morphologies with the A2 jet bending on small scales in a mirror-symmetric S-shaped pattern, while the A1 jet is C-shaped with the blue- and red-shifted emissions both tilted to the east of A1. The A1 jet appears to be faster than the A2 jet, as can be seen from its association with bright HV and EHV emissions, whereas the A2 jet is mainly detected in the LV range. Finally, the A2 jet shows a large spatial extent on the sky of more than 4′, while the A1 jet is only about 20′′ long. Three possible explanations may be invoked in order to account for the different observational characteristics of the jets associated with the two protostars: 1) different inclinations for the jets, 2) different masses for the driving sources, or 3) different ages for jets and driving sources.
A jet inclination effect could explain the large difference in projected lengths for the two outflows. In this case, assuming the same intrinsic length for both jets (about 120′′ for each lobe), the projected length of the A1 jet (about 13′′ in the blue-shifted lobe) suggests that it should be viewed at about 6∘ from pole-on. This is, however, statistically very unlikely and not consistent with the morphology of the emission we observed (see Cabrit & Bertout 1986, 1990, for a review).
In the second case, since it is expected that more massive objects drive faster jets 555The outflow velocity is related to the escape speed of the driving object, thus it increases as the square root of the mass of the central object (e.g. Banerjee & Pudritz 2006)., we would expect A1 to be more massive than A2. Indeed, A1 represents the source driving the faster jet. Moreover, the detection of brighter continuum emission associated with A1 (see Sect. 3.1) may be interpreted as a larger envelope mass and, hence perhaps, larger protostellar mass. However, this scenario is not supported by our WideX spectra at the positions of the detected continuum sources (see Fig. 2). In fact, a chemically rich spectrum, with emission from several COMs, is detected only towards A2, highlighting a hot-corino chemistry for this protostar.
In the third case, A1 is expected to be younger than A2, as already suggested by Choi et al. (2007, 2010, 2011) based on the disks and outflows properties from VLA NH3 and SiO observations. This view is supported by the detection of a hot-corino chemistry only towards A2 (see Sect. 3.1.1 and Fig. 2). Along with a slower jet driven by A2, associated with weaker H2 shocked emission, a different chemistry may indicate a later evolutionary stage for this source. Indeed the lack of a detectable hot corino at A1 suggests a lower internal luminosity than at A2; in particular, the region where the dust temperature is high enough (100 K) for the icy mantles to sublimate should be much smaller and more heavily beam diluted than at A2. This would imply a smaller stellar mass and/or earlier evolutionary stage for A1. Further support for this view is given by the short dynamical timescale of the A1 jet. In fact, for the farthest SiO knot along the A1 jet, assuming an observed velocity of 1020 km s-1 (see Fig. 3), we can estimate a dynamical age of 103 yr. The A1 jet indeed appears as an intrinsically very young outflow. On the other hand, according to Awad et al. (2010), the chemically rich emission detected at A2 suggests an age of 104105 yr for this source, which is in agreement with the collapse age of 5104 yr derived by Choi et al. (2010) from the rotation kinematics of the disk in NH3.
5 Summary and conclusions
Our new PdBI observations of the IRAS4A binary system finally allowed us to clearly disentangle the jet emission from the Class 0 driving protostars, revealing the intrinsic different properties of the two jets. The detection of such a tight and collimated protobinary system is challenging for current theoretical models of multiple system formation. We propose that the observed properties of the jets can be explained with different evolutionary stages for the two driving protostars. In particular, the younger source (A1) drives a fast collimated jet associated with bright H2 emission, whereas its sibling protostar (A2) powers a slower precessing jet and is associated with a rich hot-corino chemistry. However, a difference in the protostellar masses may not be excluded with certainty. Indeed, information on the individual luminosities of the protostars would be crucial in order to confirm the proposed scenario. Finally, jet variability, in particular episodic ejection (see e.g. Codella et al. 2014), may also play a role.
Acknowledgements.
We thank Serena Viti and Brunella Nisini for fruitful discussions and helpful inputs on this project. We are very grateful to the IRAM staff, whose dedication allowed us to carry out the CALYPSO project. This work was partly supported by the ASI–INAF project 01/005/11/0, the PRIN INAF 2012 – JEDI, and the Italian Ministero dell’Istruzione, Università e Ricerca through the grant Progetti Premiali 2012 – iALMA.References
- Anderl et al. (2013) Anderl, S., Guillet, V., Pineau des Forêts, G., & Flower, D. R. 2013, A&A, 556, A69
- André et al. (2000) André, P., Ward-Thompson, D., & Barsony, M. 2000, Protostars and Planets IV, 59
- Arce et al. (2007) Arce, H. G., Shepherd, D., Gueth, F., et al. 2007, Protostars and Planets V, 245
- Awad et al. (2010) Awad, Z., Viti, S., Collings, M. P., & Williams, D. A. 2010, MNRAS, 407, 2511
- Bachiller & Pérez Gutiérrez (1997) Bachiller, R., & Pérez Gutiérrez, M. 1997, ApJ, 487, L93
- Banerjee & Pudritz (2006) Banerjee, R., & Pudritz, R. E. 2006, ApJ, 641, 949
- Belloche et al. (2006) Belloche, A., Hennebelle, P., & André, P. 2006, A&A, 453, 145
- Blake et al. (1995) Blake, G. A., Sandell, G., van Dishoeck, E. F., et al. 1995, ApJ, 441, 689
- Bottinelli et al. (2004) Bottinelli, S., Ceccarelli, C., Lefloch, B., et al. 2004, ApJ, 615, 354
- Cabrit & Bertout (1986) Cabrit, S., & Bertout, C. 1986, ApJ, 307, 313
- Cabrit & Bertout (1990) Cabrit, S., & Bertout, C. 1990, ApJ, 348, 530
- Cabrit et al. (2012) Cabrit, S., Codella, C., Gueth, F., & Gusdorf, A. 2012, A&A, 548, LL2
- Ceccarelli (2004) Ceccarelli, C. 2004, Star Formation in the Interstellar Medium: In Honor of David Hollenbach, 323, 195
- Choi et al. (1999) Choi, M., Panis, J.-F., & Evans, N. J., II 1999, ApJS, 122, 519
- Choi (2001) Choi, M. 2001, ApJ, 553, 219
- Choi (2005) Choi, M. 2005, ApJ, 630, 976
- Choi et al. (2006) Choi, M., Hodapp, K. W., Hayashi, M., et al. 2006, ApJ, 646, 1050
- Choi et al. (2007) Choi, M., Tatematsu, K., Park, G., & Kang, M. 2007, ApJ, 667, L183
- Choi et al. (2010) Choi, M., Tatematsu, K., & Kang, M. 2010, ApJ, 723, L34
- Choi et al. (2011) Choi, M., Kang, M., Tatematsu, K., Lee, J.-E., & Park, G. 2011, PASJ, 63, 1281
- Codella et al. (2014) Codella, C., Maury, A. J., Gueth, F., et al. 2014, A&A, 563, L3
- Di Francesco et al. (2001) Di Francesco, J., Myers, P. C., Wilner, D. J., Ohashi, N., & Mardones, D. 2001, ApJ, 562, 770
- Enoch et al. (2009) Enoch, M. L., Evans, N. J., II, Sargent, A. I., & Glenn, J. 2009, ApJ, 692, 973
- Evans et al. (2009) Evans, N. J., II, Dunham, M. M., Jørgensen, J. K., et al. 2009, ApJS, 181, 321
- Flower & Pineau des Forets (1994) Flower, D. R., & Pineau des Forets, G. 1994, MNRAS, 268, 724
- Frank et al. (2014) Frank, A., Ray, T. P., Cabrit, S., et al. 2014, Protostars and Planets VI, 451
- Girart et al. (1999) Girart, J. M., Crutcher, R. M., & Rao, R. 1999, ApJ, 525, L109
- Gueth et al. (2003) Gueth, F., Bachiller, R., & Tafalla, M. 2003, A&A, 401, L5
- Guillet et al. (2009) Guillet, V., Jones, A. P., & Pineau Des Forêts, G. 2009, A&A, 497, 145
- Guillet et al. (2011) Guillet, V., Pineau Des Forêts, G., & Jones, A. P. 2011, A&A, 527, AA123
- Gusdorf et al. (2008a) Gusdorf, A., Cabrit, S., Flower, D. R., & Pineau Des Forêts, G. 2008a, A&A, 482, 809
- Gusdorf et al. (2008b) Gusdorf, A., Pineau Des Forêts, G., Cabrit, S., & Flower, D. R. 2008b, A&A, 490, 695
- Hirota et al. (2008) Hirota, T., Bushimata, T., Choi, Y. K., et al. 2008, PASJ, 60, 37
- Jennings et al. (1987) Jennings, R. E., Cameron, D. H. M., Cudlip, W., & Hirst, C. J. 1987, MNRAS, 226, 461
- Jørgensen et al. (2007) Jørgensen, J. K., Bourke, T. L., Myers, P. C., et al. 2007, ApJ, 659, 479
- Karska et al. (2013) Karska, A., Herczeg, G. J., van Dishoeck, E. F., et al. 2013, A&A, 552, AA141
- Kristensen et al. (2012) Kristensen, L. E., van Dishoeck, E. F., Bergin, E. A., et al. 2012, A&A, 542, A8
- Lay et al. (1995) Lay, O. P., Carlstrom, J. E., & Hills, R. E. 1995, ApJ, 452, L73
- Lee et al. (2010) Lee, C.-F., Hasegawa, T. I., Hirano, N., et al. 2010, ApJ, 713, 731
- Looney et al. (2000) Looney, L. W., Mundy, L. G., & Welch, W. J. 2000, ApJ, 529, 477
- Maret et al. (2004) Maret, S., Ceccarelli, C., Caux, E., et al. 2004, A&A, 416, 577
- Maury et al. (2010) Maury, A. J., André, P., Hennebelle, P., et al. 2010, A&A, 512, AA40
- Maury et al. (2014) Maury, A. J., Belloche, A., André, P., et al. 2014, A&A, 563, L2
- Neufeld & Yuan (2008) Neufeld, D. A., & Yuan, Y. 2008, ApJ, 678, 974
- Pineau des Forets et al. (1993) Pineau des Forets, G., Roueff, E., Schilke, P., & Flower, D. R. 1993, MNRAS, 262, 915
- Ray et al. (2007) Ray, T., Dougados, C., Bacciotti, F., Eislöffel, J., & Chrysostomou, A. 2007, Protostars and Planets V, 231
- Reach et al. (2006) Reach, W. T., Rho, J., Tappe, A., et al. 2006, AJ, 131, 1479
- Reipurth et al. (2002) Reipurth, B., Rodríguez, L. F., Anglada, G., & Bally, J. 2002, AJ, 124, 1045
- Reipurth et al. (2014) Reipurth, B., Clarke, C. J., Boss, A. P., et al. 2014, Protostars and Planets VI, 267
- Sandell et al. (1991) Sandell, G., Aspin, C., Duncan, W. D., Russell, A. P. G., & Robson, E. I. 1991, ApJ, 376, L17
- Santangelo et al. (2014) Santangelo, G., Nisini, B., Codella, C., et al. 2014, A&A, 568, AA125
- Tafalla et al. (2010) Tafalla, M., Santiago-García, J., Hacar, A., & Bachiller, R. 2010, A&A, 522, AA91
- Taquet et al. (2015) Taquet, V., López-Sepulcre, A., Ceccarelli, C., et al. 2015, arXiv:1502.06427
- Tohline (2002) Tohline, J. E. 2002, ARA&A, 40, 349
- van Dishoeck & Blake (1998) van Dishoeck, E. F., & Blake, G. A. 1998, ARA&A, 36, 317
- Viti et al. (2004) Viti, S., Collings, M. P., Dever, J. W., McCoustra, M. R. S., & Williams, D. A. 2004, MNRAS, 354, 1141
- Wilson & Rood (1994) Wilson, T. L., & Rood, R. 1994, ARA&A, 32, 191
- Yıldız et al. (2012) Yıldız, U. A., Kristensen, L. E., van Dishoeck, E. F., et al. 2012, A&A, 542, A86
Appendix A Comparison with large-scale emission
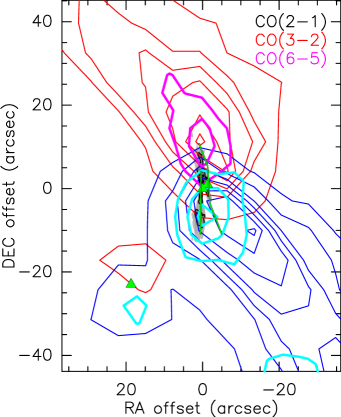
In this section, a comparison between the IRAM-PdBI CO(21) data presented in this paper and the large-scale emission is presented. In particular, VLA SiO emission data from Choi (2005) and single-dish CO data by Yıldız et al. (2012) are shown. The comparison shows the change of propagation direction from north-south to about in the large-scale CO emission (see also Blake et al. 1995; Girart et al. 1999; Choi 2001, 2005), which also seems to be consistent with the large-scale SiO data. Our possible evidence of precession in the A2 jet on very small scales (Fig. 5) is consistent with the large-scale CO and SiO morphologies, confirming that the A2 jet dominates the large-scale emission. Moreover, the non-detection in the IRAM-PdBI data of CO(21) emission associated with the A2 jet at distances larger than about 3′′ from the source is possibly due to filtering of large-scale emission by the interferometer, suggesting that the CO emission associated with the A2 jet is quite extended.
Appendix B WideX spectra at the EHV peak
Figure 8 shows the additional lines detected in the WideX spectra at the peak of the EHV gas that are analysed and discussed in the main text (see also Fig. 6 and Sect. 4.1). In particular, the CO(21), SO(6554), H2CO(321220), and H2CO(303202) lines show a double-peaked profile with a velocity component peaking around the systemic velocity and a secondary velocity component around 50 km s-1; the SiO(54) line profile presents a broad wing emission that peaks at 50 km s-1 and extends down to the systemic velocity; finally, the 13CO(21), H2CO(322221), CH3OH(422312), and CH3OH(808717) line profiles show a single emission peak around systemic velocity, possibly due to a lack of sensitivity.