11email: podigachoski@astro.rug.nl
The far-infrared emission of the radio-loud quasar 3C 318
3C 318, a radio-loud quasar at =1.574, is a subgalactic-sized radio source, and a good test-bed for the interplay between black hole and galaxy growth in the high- Universe. Based on its IRAS, ISO, and SCUBA detections, it has long been considered as one of the most intrinsically luminous (LIR ¿ 1013 L⊙) infrared sources in the Universe. Recent far-infrared data from the Herschel Space Observatory reveal that most of the flux associated with 3C 318 measured with earlier instruments in fact comes from a bright nearby source. Optical imaging and spectroscopy show that this infrared-bright source is a strongly star-forming pair of interacting galaxies at =0.35. Adding existing Spitzer and SDSS photometry, we perform a spectral energy distribution analysis of the pair, and find that it has a combined infrared luminosity of LIR = 1.5 1012 L⊙, comparable to other intermediate-redshift ultra-luminous infrared galaxies studied with Herschel. Isolating the emission from 3C 318’s host, we robustly constrain the level of star formation to a value a factor of three lower than that published earlier, which is more in line with the star formation activity found in other Herschel-detected 3CR objects at similar redshift.
Key Words.:
galaxies: active – galaxies: high-redshift – galaxies: star formation – infrared: galaxies – quasars: individual (3C 318)1 Introduction
Powerful, high-redshift, radio-loud active galactic nuclei (AGN) provide a unique opportunity to study the interplay between the growth of the black hole and that of the host galaxy when both processes went through their peak activity.
The Revised Third Cambridge Catalogue of radio sources (hereafter 3CR; Bennett, 1962; Spinrad et al., 1985) contains some of the most luminous radio galaxies (RGs) and quasars (QSRs) in the high- Universe, which have been studied with virtually all space telescopes (e.g. Best et al., 1998; Haas et al., 2008; Leipski et al., 2010; Wilkes et al., 2013; Chiaberge et al., 2015). Podigachoski et al. (2015, hereafter P15) recently performed a comprehensive study of this sample using far-infrared (FIR) data from the Herschel Space Observatory (Pilbratt et al., 2010), covering the last remaining spectral window in the study of these landmark objects. In that work, we found evidence for strong star formation (SF) activity in about 40% of 3CR hosts, at the level of several hundred solar masses per year, comparable to the SF activity in equally massive, non-AGN hosts at similar redshift.
3C 318 (Spinrad & Smith, 1976) is a QSR at a spectroscopically measured redshift of =1.574 (Willott et al., 2000). It is a compact steep-spectrum (CSS), presumably young radio source, with a projected radio extent of 7 kpc (Mantovani et al., 2010). Adopting a typical speed of radio-jet expansion of about 10% of the speed of light suggests that the jets were triggered 0.1 Myr ago. 3C 318 is one of the highest redshift sources detected with the IRAS telescope (Hes et al., 1995), and is also detected with SCUBA at 850 m (Willott et al., 2002). These two strong detections suggested that 3C 318 is unusually bright in the infrared. Given the steep-spectrum nature of the radio source, it is clear that the dominant emission in the infrared is thermal dust emission in its host galaxy. Taking into account the AGN contribution to the 850 m flux, estimated from the synchrotron spectral slope, Willott et al. (2007) reported a hyper-luminous star formation rate (SFR) of 1700 M⊙ yr-1. Heywood et al. (2013) targeted the ground-state CO line in 3C 318, and found that the molecular gas with an estimated mass of 3.7 (0.4) 1010 (/0.8) M⊙ is spatially offset from the position of the QSR. These authors argued that 3C 318 is either undergoing a major merger (whereby the starburst is taking place in a nearby merging galaxy), or is a highly-disturbed system. Such an amount of molecular gas combined with the estimated SFR result in a gas-depletion time scale of about 20 Myr in this system.
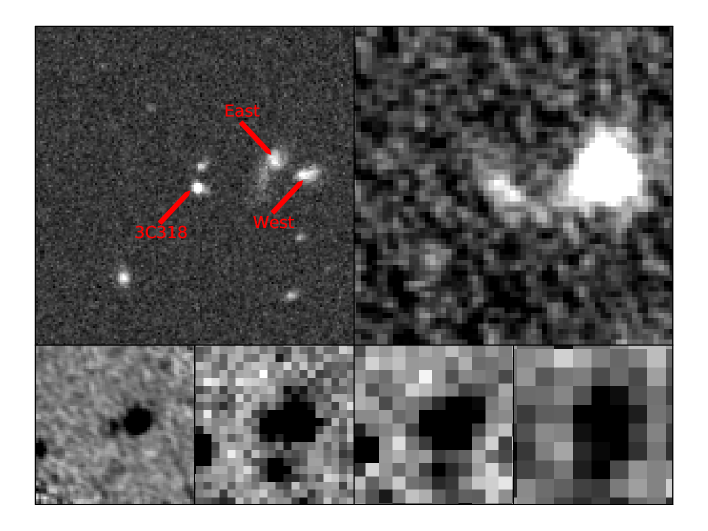
As already noted by Spinrad & Smith (1976), a faint pair of interacting galaxies is visible in their optical image111Note that the scale provided with their optical image is incorrect, and that their redshift of 3C 318 was later updated to be (Willott et al., 2000). about 20 west of 3C 318. The r-band SDSS-field of 3C 318 is shown in Fig. 1, with the position of 3C 318 and the galaxy pair (East and West) marked. The pair emits prominently in the Herschel maps published by P15. Given the poor angular resolution of IRAS, it is clear that the pair contributes significantly to the measured IRAS flux. Here, we assess the nature of the interacting galaxies by spectroscopically measuring their redshifts, and analysing their spectral energy distributions (SEDs). Using this newly acquired information, we update the SED of 3C 318’s host, and modify several physical properties related to this peculiar object.
2 Existing and new observations of 3C 318 and the nearby galaxy pair
3C 318 is one of the strongest submillimetre (SCUBA) sources (F850μm = 7.8 1.0 mJy) detected by Willott et al. (2002). Given that it is also detected with MAMBO (F1.25mm = 5.6 1.4 mJy; Haas et al., 2006), it is clear that part of the SCUBA flux is contributed by non-thermal (synchrotron) emission from 3C 318’s radio core. Extrapolating from core radio data, Haas et al. (2006) estimated this contribution to be 3.5 mJy, which means that about 4.3 mJy are due to thermal radiation from dust in 3C 318’s host.
3C 318 and its surroundings were observed with the Spitzer Space Telescope (Werner et al., 2004) with all three imaging instruments: IRAC at 3.6, 4.5, 5.8, and 8.0 m, IRS-16 peak-up array at 16 m, and MIPS at 24 m. Details of the data reduction and photometry were published by Haas et al. (2008). The photometry is presented in Table 1.
The Herschel observations of the field around 3C 318 were obtained as part of our Guaranteed Time project: The Herschel Legacy of distant radio-loud AGN (PI: Barthel). Five-band photometric measurements were carried out using both imaging instruments, PACS (Poglitsch et al., 2010) at 70 and 160 m, and SPIRE (Griffin et al., 2010) at 250, 350, and 500 m. Data reduction was performed as described by P15. In Fig 1, 3C 318 can be clearly seen in the final PACS and SPIRE 250 m maps, but the interacting galaxies are unresolved, and deblending of the pair is not possible. The galaxy pair and 3C 318 fall within the same beam in the 350 and 500 m SPIRE bands. While 3C 318 can still have significant emission in the SPIRE 350 and 500 m bands, it is evident that most of the FIR emission comes from the galaxy pair. The 3C 318 flux densities in the PACS bands were obtained as outlined in P15, using apertures of 4 and 6 radius, for PACS 70 m and PACS 160 m, respectively. Integrated PACS flux densities for the galaxy pair were measured using a 6 and 12 aperture in PACS 70 m and 160 m, respectively. SPIRE photometry followed the procedure adopted by P15. Given the steep radio spectrum of 3C 318, no synchrotron contribution is expected in the SPIRE bands. All flux densities measured from the Herschel bands are listed in Table 1.
To determine the redshift of the pair of galaxies, and hence quantify the contribution of 3C 318 to the integrated flux density in the 350 and 500 m SPIRE bands, we obtained optical spectra for each of the two galaxies with the ACAM instrument on the William Herschel Telescope (WHT) on February 7, 2014. The long-slit spectra were reduced using standard packages within IRAF. Identifying emission lines from [O II], H , [O III], and H in the noisy spectra, we measure the redshift for each galaxy to be =0.350.01, with a relative velocity difference of 300 km . Additional optical data (ugriz bands) for the pair of interacting galaxies were obtained from SDSS222http://www.sdss.org/dr12/. The flux densities in the optical bands are also listed in Table 1.
| Band | 3C 318 | East galaxy | West galaxy | Galaxy pair | 3C 318 and pair |
|---|---|---|---|---|---|
| SDSS u [Jy] | … | 3 2 | 6 2 | … | … |
| SDSS g [Jy] | … | 26 1 | 15 7 | … | … |
| SDSS r [Jy] | … | 72 2 | 48 1 | … | … |
| SDSS i [Jy] | … | 108 2 | 77 1 | … | … |
| SDSS z [Jy] | … | 141 10 | 112 7 | … | … |
| IRAC 3.6 [Jy] | 343 51 | 247 24 | 289 28 | … | … |
| IRAC 4.5 [Jy] | 427 64 | 238 23 | 293 29 | … | … |
| IRAC 5.8 [Jy] | 571 86 | 212 21 | 315 31 | … | … |
| IRAC 8.0 [Jy] | 806 121 | 540 54 | 933 93 | … | … |
| IRS 16 [Jy] | 1960 294 | 540 54 | 1500 150 | … | … |
| MIPS 24 [Jy] | 3400 510 | 1140 114 | 3000 300 | … | … |
| PACS 70 [mJy] | 17.2 1.8 | 58 | 163 | 221.2 3.8 | … |
| PACS 160 [mJy] | 38.3 4.2 | 73 | 205 | 277.5 6.1 | … |
| SPIRE 250 [mJy] | 35.9 6.1 | 43 | 120 | 163.4 6.1 | … |
| SPIRE 350 [mJy] | 11 | … | … | … | 91.3 6.2 |
| SPIRE 500 [mJy] | 16 | … | … | … | 46.6 6.3 |
| SCUBA 850 [mJy] | 4.3 | … | … | … | … |
3 Results and discussion
The availability of photometric data over a large wavelength range allows us to obtain reasonable estimates of the galaxies’ physical properties using an SED fitting approach. To this end, we use the code MAGPHYS444Publicly available at http://www.iap.fr/magphys/magphys/MAGPHYS.html, which follows the approach outlined by da Cunha et al. (2008). This largely empirical (but physically motivated) code interprets the infrared SEDs of galaxies consistently with the emission at shorter wavelengths assuming (1) that only starlight heats the dust and (2) that the luminosity absorbed by dust is re-emitted in the infrared domain. For details related to the adopted stellar populations and dust attenuation we refer the reader to da Cunha et al. (2008). Using minimization, the code constrains several physical properties related to the stars and the interstellar medium of the probed galaxies.
| Mstellar | LIR | Mdust | ||
|---|---|---|---|---|
| [M⊙] | [L⊙] | [M⊙] | ||
| East galaxy | 5.0 1010 | 3.9 1011 | 1.6 108 | 2.7 |
| West galaxy | 8.0 1010 | 1.1 1012 | 4.6 108 | 1.3 |
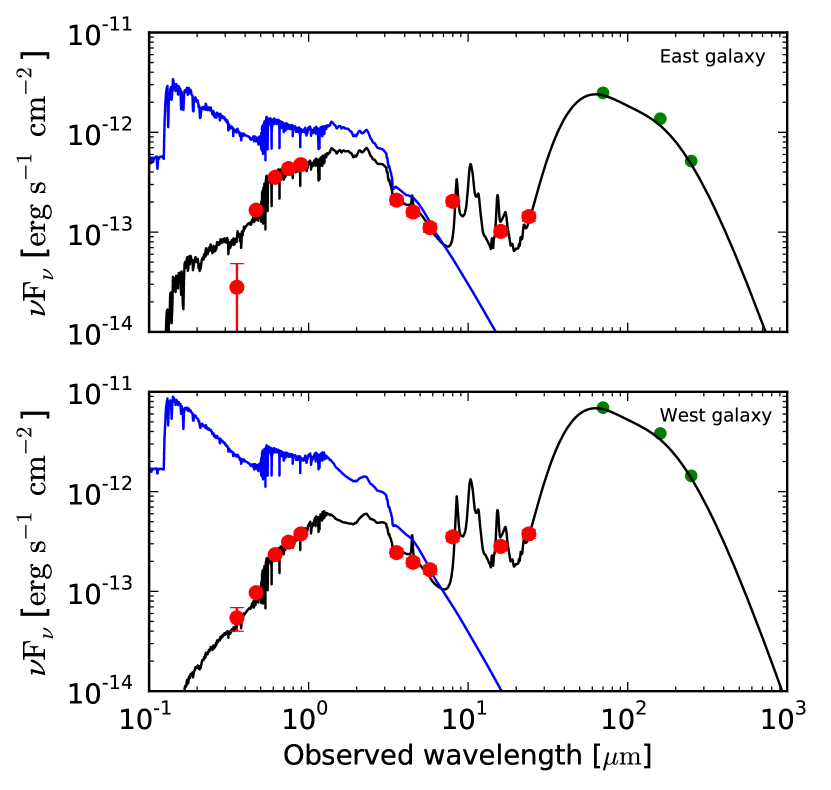
Figure 2 shows the best-fit SEDs for the two interacting galaxies as determined by MAGPHYS using the SDSS and Spitzer photometry listed in Table 1, and the redshift of the interacting pair determined from the optical spectra. The fits are remarkably good despite the lack of constraints in the FIR domain, and both galaxies are best fitted with dusty starburst templates. Both galaxies are characterized by a considerable amount of dust attenuation and have their IRAC 8.0 m and IRS 16 m fluxes dominated by emission from polycyclic aromatic hydrocarbon features. As a result from the low signal-to-noise u-band photometry for the East galaxy, its best-fit is slightly worse than that of the West galaxy. No differences in the derived paramaters were found when performing the fit without taking this data point into account. The results, listed in Table 2, suggest that relative to the East galaxy, the West galaxy has a factor of 1.6 higher stellar mass (Mstellar), and a factor of 2.8 higher infrared luminosity (LIR). We adopt the LIR ratio between the two galaxies, and use it to estimate the contribution of each individual galaxy to the integrated flux density measured in the three shortest Herschel bands (see Table 1). We perform additional fits using these estimated flux densities in addition to the SDSS and Spitzer flux densities, and find similar physical properties (within 10%) confirming that the fits obtained without the Herschel constraints are remarkably robust. For completeness, we overplot the estimated Herschel photometry in Fig. 2 (green points). The morphology and size of the interacting pair of galaxies are comparable to those of the well-known Antennae (NGC 4038/NGC 4039, e.g. Whitmore & Schweizer, 1995), which have a total FIR luminosity of LFIR 1.3 1011 L⊙ (Klaas et al., 2010). The total infrared luminosity of the pair is in line with Herschel-studied ULIRGs at 0.2 0.9 (Magdis et al., 2014).
Willott et al. (2000) presented the hitherto obtained radio to X-ray SED of 3C 318 and determined that its infrared luminosity, LFIR, greatly exceeds 1013 L⊙. Correcting for the non-thermal core emission, Willott et al. (2007) modified it to a value of LFIR 1013 L⊙, placing 3C 318 at the border between what is known in the literature as ultra-luminous (ULIRG) and hyper-luminous (HyLIRG) infrared galaxies. Using better quality Spitzer and Herschel data, P15 fitted the infrared SED of 3C 318 obtaining LSF = 3.4 1012 L⊙, firmly establishing the ULIRG nature of 3C 318.
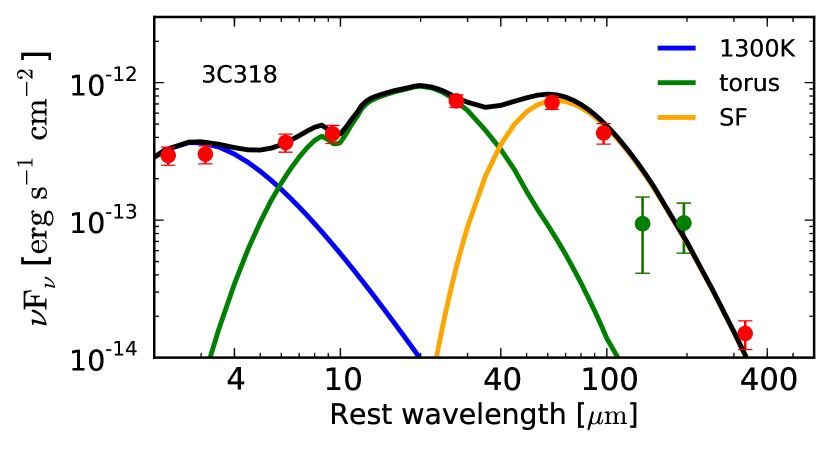
Here we revisit the infrared SED of 3C 318 using the just obtained SPIRE 350 and 500 m photometry. To isolate the signal from 3C 318, we use the best-fits for the pair galaxies determined by MAGPHYS, extrapolate the flux densities at these two bands, and finally subtract them from the integrated values given in Table 1. Following P15, we fit 3C 318’s infrared SED using the sum of three components accounting for the emission from AGN-heated hot dust close to sublimation temperature (represented by a blackbody with a fixed temperature of 1300 K), the AGN-heated warm dust (torus) emission (represented by a model from the library of Hönig & Kishimoto, 2010), and the SF-heated dust on the scale of the host galaxy (represented by a modified blackbody with a fixed emissivity index).
The best-fit SED, presented in Fig. 3, represents the photometric data points well, except for the SPIRE 350 m point. Integrating under the AGN and SF related components gives LAGN = 7.6 1012 L⊙ and LSF = 3.4 1012 L⊙, comparable to what was found for other SPIRE detected sources from the same 3CR catalogue (P15). The LSF value obtained here is a factor of three lower than that determined by Willott et al. (2007). Consequently, the gas-depletion time scale (or SF efficiency) of 3C 318 is a factor of three longer than that computed by Heywood et al. (2013) based on a molecular gas mass of 3.7 (0.4) 1010 (/0.8) M⊙, and equals about 60 Myr. These numbers place 3C 318 well below the LFIR-L’CO relation for high- submillimetre galaxies reported by Bothwell et al. (2013), but still imply strong SF activity in its host galaxy. Note that part of the measured infrared flux density in the Herschel bands could also be attributed to the close companion south-west of 3C 318, noted by Willott et al. (2000) and seen in Fig. 1. Whether this companion is at the same redshift as 3C 318, and possibly interacting with it, remains to be seen. Future ALMA studies will likely provide an improved view of the dust and molecular gas emission surrounding 3C 318.
4 Conclusion
Herschel imaging of the field centered on the radio-loud quasar 3C 318 reveals that the infrared emission detected with earlier instruments comes from a pair of interacting galaxies close (in projection) to 3C 318. Using optical spectroscopy, we determine the redshift of the pair to be =0.35. We perform a spectral energy distribution analysis of the pair, and constrain its infrared luminosity to LIR = 1.5 1012 L⊙, comparable to the luminosity of other ultra-luminous infrared galaxies at that redshift. We quantify the emission of 3C 318’s host galaxy in Herschel bands where it is blended with the galaxy pair, and find that its luminosity due to SF activity is LSF = 3.4 1012 L⊙, a factor of three lower than found in previous studies. Further ALMA studies are needed to get an improved understanding of the dust emission in 3C 318’s host.
Acknowledgements.
PP acknowledges the Nederlandse Organisatie voor Wetenschappelijk Onderzoek (NWO) for a PhD fellowship. The authors acknowledge Javier Mendez for obtaining the optical spectroscopy, Steve Willner for providing the Spitzer photometry, Scott Trager for helping with the redshift determination, and Wouter Karman for useful comments. Herschel is an ESA space observatory with science instruments provided by European-led Principal Investigator consortia and with important participation from NASA. This work is partly based on observations made with the Spitzer Space Telescope, which is operated by the Jet Propulsion Laboratory, California Institute of Technology under a contract with NASA. Funding for the Sloan Digital Sky Survey IV has been provided by the Alfred P. Sloan Foundation and the Participating Institutions. SDSS-IV acknowledges support and resources from the Center for High-Performance Computing at the University of Utah. The SDSS web site is www.sdss.org. This research made use of APLpy, an open-source plotting package for Python hosted at http://aplpy.github.com.References
- Bennett (1962) Bennett, A. S. 1962, MmRAS, 68, 163
- Best et al. (1998) Best, P. N., Longair, M. S., & Roettgering, H. J. A. 1998, MNRAS, 295, 549
- Bothwell et al. (2013) Bothwell, M. S., Smail, I., Chapman, S. C., et al. 2013, MNRAS, 429, 3047
- Chiaberge et al. (2015) Chiaberge, M., Gilli, R., Lotz, J. M., & Norman, C. 2015, ApJ, 806, 147
- da Cunha et al. (2008) da Cunha, E., Charlot, S., & Elbaz, D. 2008, MNRAS, 388, 1595
- Griffin et al. (2010) Griffin, M. J., Abergel, A., Abreu, A., et al. 2010, A&A, 518, L3
- Haas et al. (2006) Haas, M., Chini, R., Müller, S. A. H., Bertoldi, F., & Albrecht, M. 2006, A&A, 445, 115
- Haas et al. (2008) Haas, M., Willner, S. P., Heymann, F., et al. 2008, ApJ, 688, 122
- Hes et al. (1995) Hes, R., Barthel, P. D., & Hoekstra, H. 1995, A&A, 303, 8
- Heywood et al. (2013) Heywood, I., Martínez-Sansigre, A., Willott, C. J., & Rawlings, S. 2013, MNRAS, 435, 3376
- Hönig & Kishimoto (2010) Hönig, S. F., & Kishimoto, M. 2010, A&A, 523, A27
- Klaas et al. (2010) Klaas, U., Nielbock, M., Haas, M., Krause, O., & Schreiber, J. 2010, A&A, 518, L44
- Leipski et al. (2010) Leipski, C., Haas, M., Willner, S. P., et al. 2010, ApJ, 717, 766
- Magdis et al. (2014) Magdis, G. E., Rigopoulou, D., Hopwood, R., et al. 2014, ApJ, 796, 63
- Mantovani et al. (2010) Mantovani, F., Rossetti, A., Junor, W., Saikia, D. J., & Salter, C. J. 2010, A&A, 518, AA33
- Pilbratt et al. (2010) Pilbratt, G. L., Riedinger, J. R., Passvogel, T., et al. 2010, A&A, 518, LL1
- Podigachoski et al. (2015) Podigachoski, P., Barthel, P. D., Haas, M., et al. 2015 (P15), A&A, 575, A80
- Poglitsch et al. (2010) Poglitsch, A., Waelkens, C., Geis, N., et al. 2010, A&A, 518, L2
- Spinrad & Smith (1976) Spinrad, H., & Smith, H. E. 1976, ApJ, 206, 355
- Spinrad et al. (1985) Spinrad, H., Marr, J., Aguilar, L., & Djorgovski, S. 1985, PASP, 97, 932
- Werner et al. (2004) Werner, M. W., Roellig, T. L., Low, F. J., et al. 2004, ApJS, 154, 1
- Whitmore & Schweizer (1995) Whitmore, B. C., & Schweizer, F. 1995, AJ, 109, 960
- Wilkes et al. (2013) Wilkes, B. J., Kuraszkiewicz, J., Haas, M., et al. 2013, ApJ, 773, 15
- Willott et al. (2000) Willott, C. J., Rawlings, S., & Jarvis, M. J. 2000, MNRAS, 313, 237
- Willott et al. (2002) Willott, C. J., Rawlings, S., Archibald, E. N., & Dunlop, J. S. 2002, MNRAS, 331, 435
- Willott et al. (2007) Willott, C. J., Martínez-Sansigre, A., & Rawlings, S. 2007, AJ, 133, 564