Triangulum II: a very metal-poor and dynamically hot stellar system
Abstract
We present a study of the recently discovered compact stellar system Triangulum II. From observations conducted with the DEIMOS spectrograph on Keck II, we obtained spectra for 13 member stars that follow the CMD features of this very faint stellar system and include two bright red giant branch stars. Tri II has a very negative radial velocity () that translates to and confirms it is a Milky Way satellite. We show that, despite the small data set, there is evidence that Tri II has complex internal kinematics. Its radial velocity dispersion increases from in the central to outwards. The velocity dispersion of the full sample is inferred to be . From the two bright RGB member stars we measure an average metallicity , placing Tri II among the most metal-poor Milky Way dwarf galaxies. In addition, the spectra of the fainter member stars exhibit differences in their line-widths that could be the indication of a metallicity dispersion in the system. All these properties paint a complex picture for Tri II, whose nature and current state are largely speculative. The inferred metallicity properties of the system however lead us to favor a scenario in which Tri II is a dwarf galaxy that is either disrupting or embedded in a stellar stream.
Subject headings:
Local Group — galaxies: individual: Tri II — galaxies: kinematics and dynamics1. Introduction
A large number of faint and small stellar systems have been uncovered over the last decade thanks to wide photometric surveys. The harvest of such objects, which started with Willman 1 (Willman et al., 2005) and then Segue 1 (Belokurov et al., 2007), blossomed through systematic searches of the Sloan Digital Sky Survey (SDSS; Belokurov et al., 2009) and, more recently, of the Dark Energy Survey (DES; Bechtol et al., 2015; Drlica-Wagner et al., 2015; Koposov et al., 2015) and the Panoramic Telescope and Rapid Response System 1 (Pan-STARRS1; Laevens et al., 2015b, a). The photometric properties of many of these systems ambiguously locate them in a region of parameter space where dwarf galaxies appear to mix with globular clusters (Gilmore et al., 2007). Spectroscopic studies of their stars are therefore unavoidable to show that they are either dynamically cold and display no metallicity dispersion (e.g., Laevens 1; Kirby et al., 2015), as expected for globular clusters, or that they are dynamically hot (e.g., Segue 1; Geha et al., 2009), have a metallicity dispersion (e.g., Segue 2; Kirby et al., 2013a), and/or lie on the luminosity–metallicity relation followed by dwarf galaxies (e.g., Hydra II and Draco II; Kirby et al., 2015; Martin et al., 2015).
Although they are expected by the dozen in simulations (Tollerud et al., 2008; Bullock et al., 2010), only a handful of these faint and small stellar systems have so far been confirmed as dwarf galaxies. Any new addition to the list is particularly valuable as these objects are among the most promising for the indirect detection of the elusive dark matter particle (e.g., Geringer-Sameth et al., 2015). Their small baryonic component () makes them hard to find and study but, at the same time, gives powerful insight into the interplay of physical processes that drive galaxy formation at low masses and in shallow potential wells. The characterization of these systems is, however, made difficult by the potential presence of binary stars that can significantly inflate the intrinsic velocity dispersion of a system with a velocity dispersion of only a few (McConnachie & Côté, 2010). In addition, the usual assumption of dynamical equilibrium can be inappropriate for systems that are often found within of the Galactic center, further impeding their study (e.g., Willman 1; Willman et al., 2011). Finally, the difficulty to disentangle member stars from foreground contamination can sometimes further compound the analysis of these faint objects (e.g., Bonnivard et al., 2015).
In this paper, we report a spectroscopic study of the Triangulum II (Tri II) stellar system discovered by Laevens et al. (2015b) in Pan-STARRS1 and confirmed with deep Large Binocular Camera (LBC) photometry. Tri II is very faint (), fairly compact (), and located at from the Sun, or from the Galactic center. So far as one can infer from the photometry, it appears to contain only old and metal-poor stars.
We present the Keck II/DEIMOS data used for the analysis in section 2 of this paper, the results of the spectroscopic study in section 3, while section 4 is devoted to a discussion on our findings.
2. Observations and data
Two masks targeting Tri II potential member stars were observed during the night of September 17, 2015, with the DEep Imaging Multi-Object Spectrograph (DEIMOS) on Keck II (Faber et al., 2003) under reasonably good conditions (0.7–1.0 seeing and % humidity; PI: Rich, program ID: 2015B_U064D). The LBC photometry used by Laevens et al. (2015b) to confirm the discovery of the satellite were used to place slits on stars selected in the color-magnitude diagram (CMD) to follow the system’s main sequence turn off (MSTO), sub-giant branch (SGB), and red giant branch (RGB). The selection was purposefully tight around the sharp MSTO and loose around the RGB region that cannot be selected out of the MW foreground contamination from the photometry alone.
Each mask was integrated for 3600s, split into 3 sub-exposures for cosmic-ray removal. The spectrograph was set up with the 1200 lines/mm grating, which translates to per pixel in the Calcium ii triplet (CaT) region we focus on. The full spectra cover the range 6600–9400. Raw frames are processed through our own pipeline, which we developed over the years to specifically reduce DEIMOS spectra. We refer the reader to Ibata et al. (2011) for an overview of the details of the processing, and the results of using the pipeline on high quality data. Briefly, the reduction method calibrates each pixel of the original spectroscopic frame in both wavelength and spatial position on the sky. In this way the data retain their original pixel binning, and one avoids introducing the correlated noise that occurs when spectra are extracted and co-added. The wavelength solution is given by a fit to arc-lamp frames taken immediately after the science frames. We also allow for a wavelength re-calibration using the Fraunhofer A band in the range 7595–7630 in order to perform small telluric corrections when the signal to noise of the spectra is sufficient. A two-dimensional sky spectrum model is built for each slitlet following a procedure inspired by the method of Kelson (2003). Finally, the radial velocity (and corresponding uncertainty) of the target stars is measured by fitting a simple Gaussian model of the Ca II triplet lines to the pixel data minus the sky spectrum. Only stars with large enough signal-to-noise ( per pixel) and velocity uncertainties lower than are kept for the analysis, leaving a total sample of 50 stars.
Velocity uncertainties measured by the pipeline are known not to fully account for low level systematics. Following Ibata et al. (2011), we add an uncertainty floor of in quadrature to the velocity uncertainties measured directly from the spectra. Finally, we measure the equivalent widths of the CaT lines and their uncertainties by independently fitting to the three lines Moffat functions shifted to the velocity of a given star (Ibata et al., 2005).
Unless specified otherwise, radial velocities reported in this paper are heliocentric velocities, corrected from the motion of the Earth around the Sun, but not corrected for the Solar motion. The known and derived properties of Tri II are summarized in Table 1 and the properties of the spectroscopic sample stars are listed below in Table 2.
| RA111from Laevens et al. (2015b) (ICRS) | 02:13:17.4 |
|---|---|
| Deca (ICRS) | +36:10:42.4 |
| Heliocentric distancea ( kpc) | |
| Galactocentric distancea ( kpc) | |
| a (′) | |
| a () | |
| a | |
| a | |
| Global kinematics | |
| () | |
| () | |
| () | |
| Inner kinematics () | |
| () | |
| () | |
| Outer kinematics () | |
| () | |
| () | |
3. Analysis
3.1. Velocities
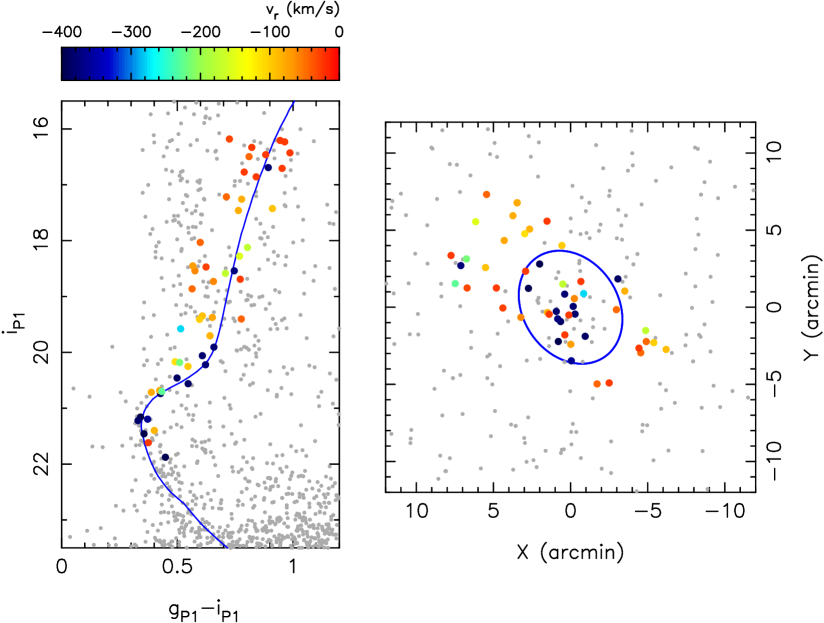
Stars with good quality spectra are displayed in Figure 1 over the CMD of Tri II in the left-hand panel and over the spatial distribution of possible Tri II stars in the right-hand panel. A group of stars with highly negative velocities, shown in dark-blue, is almost perfectly aligned with the favored old and metal-poor isochrone of Laevens et al. (2015b, and ). Most of these stars are MSTO or SGB stars but the sample also contains 2 RGB stars that shall prove valuable to derive the metallicity of Tri II. A large fraction of the stars with very negative velocities is also concentrated within the half-light radius of Tri II represented by the blue ellipse, even though some member stars are also located beyond and throughout the region covered by the DEIMOS masks.
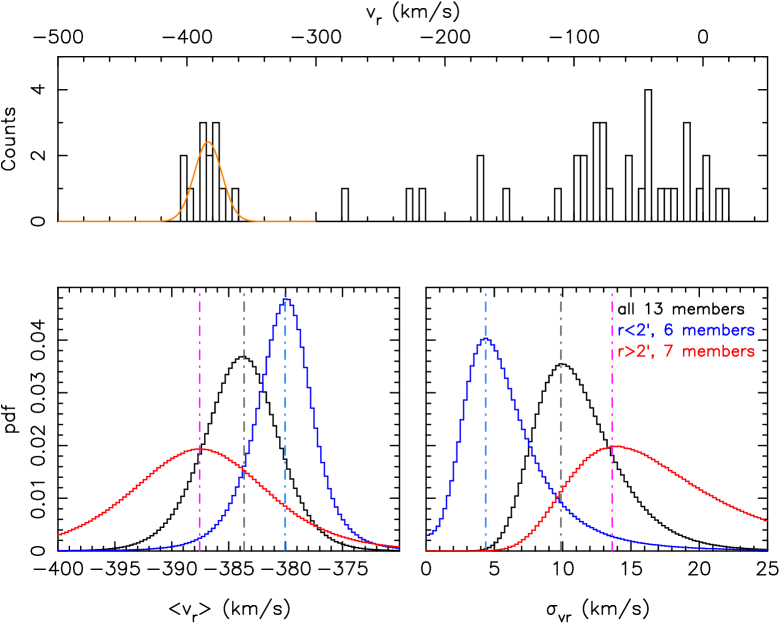
The velocity distribution of the sample stars shown in the top panel of Figure 2 reveals the velocity peak produced by Tri II stars. Located around , it appears completely isolated from the MW foreground contamination and confirms that all the stars shown in dark blue in Figure 1 are member stars. The velocity peak is also surprisingly wide. Fitting a Gaussian distribution to the 13 member stars corroborates this first impression as we infer a velocity dispersion of around a systemic velocity of (see the bottom panels of Figure 2 for the parameters’ probability distribution functions or pdfs). Such a value is at odds with velocity dispersion measurements usually obtained in similarly faint and compact MW systems. Recent studies consistently infer values of, at most, a few (Martin et al., 2007a; Simon & Geha, 2007; Geha et al., 2009; Willman et al., 2011; Kirby et al., 2013b, 2015; Martin et al., 2015).
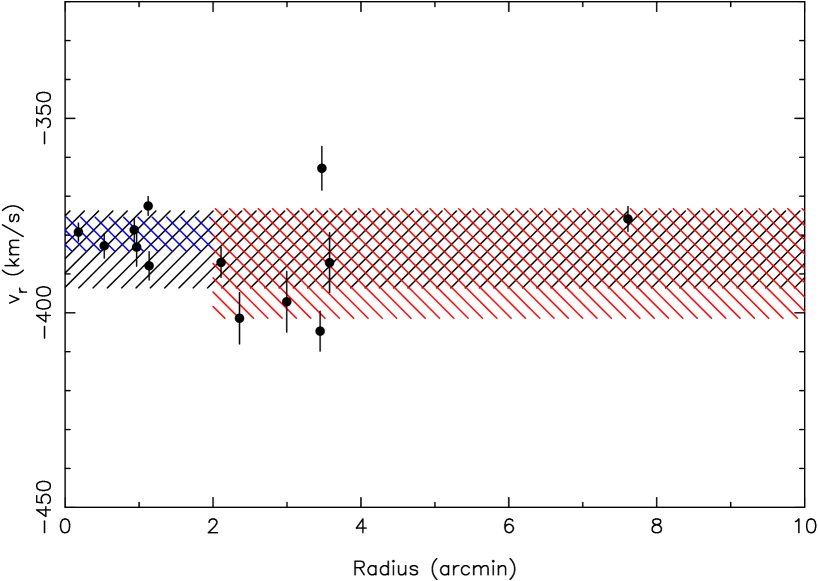
Figure 3 shows, however, that the radial velocities of member stars appear to flare up with distance from the center of the system. The central half of the sample is much more closely aligned in velocity than its outer half. Fitting the velocity distribution for the 6 member stars within yields and , whereas the outermost 7 stars yield and . While the systemic velocities of the inner and outer samples are compatible, this is hardly the case for the velocity dispersion measurements (see pdfs in the bottom panels of Figure 2). Although we cannot completely rule out the compatibility of the two measurements inferred from a small number of stars in both samples, we find that the velocity dispersions are nevertheless discrepant at the level, confirming the visual impression from Figure 3.
The large velocity dispersion of the outer sample is robust to the velocity uncertainties as it remains present, even if we increase the uncertainty floor to the unlikely value of . We also checked for the presence of a velocity gradient as a function of position that could artificially give the impression of the flaring from stars with significantly different velocities on opposite sides of the system. No such gradient was found in the data.
3.2. Metallicities

Two of the observed member stars (stars 40 & 46 in Table 2) are RGB stars bright enough to allow for a determination of their metallicity via a measure of the equivalent widths of the CaT lines. Starkenburg et al. (2010) has calibrated the relation between the equivalent widths of the second and third Caii lines, , down to very low metallicities (). We first convert the magnitudes of the two stars to magnitudes with the Tonry et al. (2012) color equation and, using the Starkenburg et al. (2010) relation, we calculate for both RGB stars. These very low metallicity values are confirmed by the inspection of the spectra (top two panels of Figure 4) that both exhibit very weak CaT lines. Assuming a Gaussian metallicity distribution function, we infer a mean metallicity for Tri II, which is therefore among the most metal-poor MW satellites.
It is harder to provide a definite conclusion on the presence or absence of a metallicity dispersion in Tri II since two stars alone cannot rule out the presence of a dispersion, even if they are measured to have the same metallicity. Moreover, the other observed member stars are located far below the horizontal branch of the system and the horizontal branch marks the faint limit to which the Starkenburg et al. (2010) relation has been calibrated. Finally, directly extracting a measure of Fe line strengths from DEIMOS spectra with is fraught with peril.
We note however that the three Tri II stars above the SGB that have similar colors (), magnitudes (), and signal-to-noise (), have inconsistent equivalent widths with , , and from the brighter to the fainter star (stars # 20, 21, and 31 from Table 2, respectively). Moreover, none of these stars show strong Nai doublet lines (8183 and 8192) that would indicate that they are foreground contaminants. These differences are directly visible on the spectra (lower three panels of Figure 4) and could be interpreted as evidence of a metallicity dispersion in Tri II. Blindly applying the Starkenburg et al. (2010) relation for these stars that are fainter than the magnitude range over which it was calibrated222However, see Leaman et al. (2013) and their study of the metal-poor globular cluster M15 for which the calibration is shown to hold magnitudes below this system’s horizontal branch. yields tentative metallicities of , , and , respectively. From the 5 brightest confirmed Tri II members, we infer and a large metallicity dispersion of dex. We nevertheless stress that direct measurements are needed from higher spectra to bolster this marginal conclusion.
4. Discussion
We obtained spectra for 13 member stars in the very faint MW satellite Tri II. These stars follow the CMD features of the stellar system and include mainly MSTO and SGB stars, as well as two bright RGB stars. With , Tri II has a very negative radial velocity that translates to . We have further shown that, as far as we can tell from only 13 member stars, the internal kinematics of Tri II appear complex with evidence for a radial velocity dispersion increase from in the central to outwards. The velocity dispersion of the full sample is inferred to be . Finally, the two bright RGB member stars are both measured to have and point to Tri II being among the most metal-poor MW satellites. The spectra of fainter member stars exhibit differences in their line-widths that could be due to a metallicity dispersion in the system.
At the distance of Tri II ( from the Galactic center), such a fast infalling velocity is not unexpected for a satellite bound to the MW. It does, however, rule out any association with the numerous stellar structures found nearby in the Milky Way halo. TriAnd (Rocha-Pinto et al., 2004), TriAnd 2 (Martin et al., 2007b), or the PAndAS MW stream (Martin et al., 2014) all have positive (Deason et al., 2014). Tri II is also unrelated to the Segue 2 satellite that is located only away but has a very different velocity (; Belokurov et al., 2009).
But what is the nature of Tri II? Taken at face value, the large global velocity dispersion, the very low-metallicity, and the potential metallicity dispersion seem to point towards Tri II being a dwarf galaxy rather than a globular cluster. However, the complex kinematics of the system question the assumption of dynamical equilibrium that is required to translate a large velocity dispersion into a large mass and mass-to-light ratio.
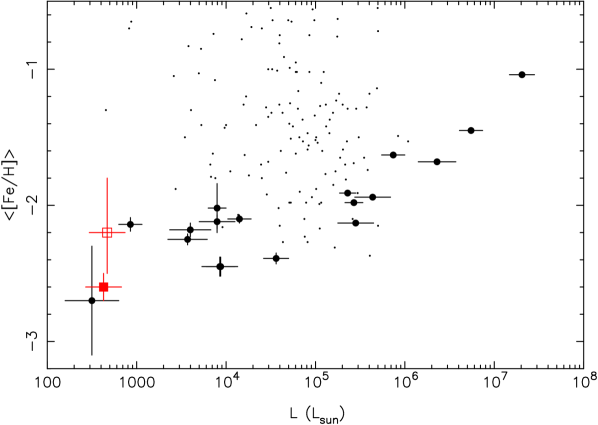
Can discriminate between globular cluster and dwarf galaxy? Irrespective of its velocity dispersion, Tri II is among the most metal-poor systems known. No globular cluster is known with a metallicity below (Harris, 1996) and only the Segue 1, Bootes II, and Reticulum II dwarf galaxies, with whom Tri II shares many similar properties (total luminosity, size, distance), are as metal-poor with (Norris et al., 2010) or (Simon et al., 2011) for Segue 1, (Koch & Rich, 2014) for Bootes II, and (Simon et al., 2015) or (Walker et al., 2015) for Reticulum II. Figure 5 shows that Tri II is in agreement with the dwarf galaxy metallicity–luminosity relation of Kirby et al. (2013b), even if we include the 3 stars with tentative metallicity measurements for the inference of the mean metallicity (hollow red square). By analogy, the metallicity of the system therefore appears to favor the dwarf galaxy hypothesis, which would be bolstered further by the marginal evidence of a metallicity dispersion.
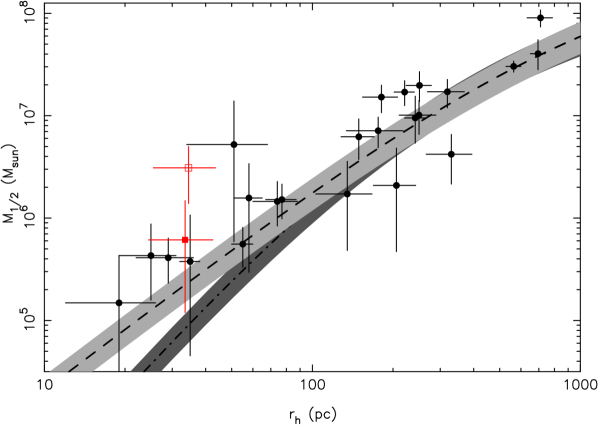
What is the dynamical mass of Tri II? It is hard to tell if one takes the increase in the velocity dispersion with radius as a sign that the system is out of equilibrium. On the other hand, if one assumes that the change in is an (unlikely ) statistical fluctuation and that the global velocity dispersion measured at is representative of the true properties of Tri II, one can easily note that it is a significant outlier among other dwarf galaxies of this size, as displayed in Figure 6. Equation (1) of Wolf et al. (2010), relates the mass within the 3-dimensional half-light radius, , to the half-light radius and velocity dispersion of a bound system in equilibrium and, in the case of Tri II, yields and in Solar units. It would mean that Tri II is almost an order of magnitude more massive than Segue 1 or Reticulum II and, by a wide margin, the most dark matter system known in the universe. Such a large mass seems very improbable.
Could MW contaminants pollute the velocity peak? This also appears unlikely as the inflated velocity dispersion in the outskirts of Tri II is not driven by any single outlier (see Figure 3). The very negative systemic velocity of Tri II also means it is improbable for the spectroscopic data set to contain more than a single contaminating halo star, if any.
Is Tri II disrupting and/or embedded in a stellar stream? After ruling out that Tri II is in equilibrium or contaminated by MW halo stars, the most likely hypothesis is that the observed increase in the velocity dispersion with radius is genuine. The large velocity dispersion beyond would then be produced by stars that are not bound to the body of the satellite. This seems at odds with the current measure of the half-light radius of Tri II (′; Laevens et al. 2015b), but this measure could be systematically biased by the comparatively small LBC field of view (Muñoz et al., 2012). In fact, the spatial distribution of possible satellite member stars exhibits what could be a more compact central core within surrounded by a more diffuse component (see the right-hand panel of Figure 1 from Laevens et al. 2015b). Upcoming wider and deeper photometric data will allow us to robustly investigate this morphology.
If this core really is the true extent of the main body of Tri II, the velocity dispersion we measure from the inner half of the spectroscopic sample () would be more representative of the satellite’s intrinsic properties and would yield a consistent picture with the very faint dwarf galaxies Segue 1 (Simon et al., 2011), Reticulum II (Simon et al., 2015; Walker et al., 2015), or Draco II (Martin et al., 2015), as can be seen in Figure 6. The only conundrum would then be whether Tri II is disrupted by tidal interactions with the Milky Way, or if it is in equilibrium but embedded in a stellar stream. Such a stellar stream could, for instance, be produced by a potentially more massive dwarf galaxy it would have been a satellite of in the past (e.g., Wheeler et al., 2015). The large negative velocity of the system however likely rules out a system that has just now been tidally disrupted after a pericentric passage. The fact that the star with the most discrepant spectrum among those shown in Figure 4 (star 31) is also the only one beyond could point towards the latter hypothesis but this is hardly conclusive.
At the moment, the puzzling properties of Tri II mean that its nature and current state are largely speculative. We favor the scenario in which Tri II is a dwarf galaxy that is either disrupting or embedded in a stellar stream but cannot completely rule out that it could be a disrupting globular cluster. Whatever the true nature of the satellite, it exhibits unexpected properties that make it very exciting and call for more observations to understand its complexity.
| # | RA | Dec | R333Distance from Tri II’s centroid (′) | S/N | Member? | EW2+3 | |||||
|---|---|---|---|---|---|---|---|---|---|---|---|
| (ICRS) | (ICRS) | (′) | () | () | (per pixel) | () | |||||
| 1 | 33.1946678 | 36.1328316 | 6.8 | 19.955 | 19.347 | 2.8 | 23.2 | N | |||
| 2 | 33.2111244 | 36.1401672 | 5.9 | 20.006 | 19.410 | 2.6 | 13.2 | N | |||
| 3 | 33.4113731 | 36.2505836 | 6.1 | 20.026 | 19.375 | 2.6 | 15.5 | N | |||
| 4 | 33.3050842 | 36.1931953 | 1.2 | 20.092 | 19.578 | 2.9 | 13.4 | N | |||
| 5 | 33.3774185 | 36.2628899 | 5.7 | 20.344 | 19.702 | 2.8 | 12.0 | N | |||
| 6 | 33.3839149 | 36.2578049 | 5.6 | 20.658 | 20.168 | 3.8 | 7.3 | N | |||
| 7 | 33.3341675 | 36.2451935 | 4.0 | 20.799 | 20.253 | 3.5 | 7.1 | N | |||
| 8 | 33.2591667 | 36.2090836 | 3.6 | 21.165 | 20.737 | 7.7 | 4.9 | Y | |||
| 9 | 33.3639183 | 36.2251930 | 3.4 | 21.499 | 21.158 | 5.1 | 3.8 | Y | |||
| 10 | 33.4349174 | 36.3003044 | 9.1 | 20.180 | 19.403 | 4.1 | 7.0 | N | |||
| 11 | 33.3940010 | 36.2913055 | 7.6 | 21.106 | 20.682 | 4.6 | 4.8 | N | |||
| 11 | 33.3940010 | 36.2913055 | 7.6 | 21.101 | 20.714 | 4.6 | 4.8 | N | |||
| 12 | 33.2499161 | 36.1958885 | 3.7 | 18.036 | 17.258 | 2.3 | 48.1 | N | |||
| 13 | 33.2220421 | 36.1532211 | 5.1 | 19.294 | 18.586 | 2.4 | 26.5 | N | |||
| 14 | 33.2612076 | 36.1757774 | 3.0 | 19.427 | 18.863 | 2.5 | 19.4 | N | |||
| 15 | 33.3087502 | 36.2062492 | 1.8 | 17.416 | 16.429 | 2.3 | 54.4 | N | |||
| 16 | 33.3540840 | 36.2714462 | 5.8 | 17.152 | 16.330 | 2.3 | 67.3 | N | |||
| 17 | 33.3997078 | 36.2773628 | 7.0 | 18.224 | 17.460 | 2.3 | 45.1 | N | |||
| 18 | 33.4496231 | 36.2708626 | 8.3 | 19.047 | 18.278 | 2.6 | 17.8 | N | |||
| 19 | 33.3174171 | 36.1878624 | 0.6 | 19.387 | 18.731 | 2.4 | 22.2 | N | |||
| 20 | 33.3305016 | 36.1926117 | 0.9 | 20.565 | 19.907 | 2.9 | 11.7 | Y | 444These stars are fainter that the magnitude range over which the Starkenburg et al. (2010) relation was calibrated; their measurements should therefore be taken with cautious. | ||
| 21 | 33.3165016 | 36.1710815 | 0.5 | 20.667 | 20.059 | 3.1 | 10.8 | Y | |||
| 22 | 33.3029175 | 36.1470566 | 2.1 | 20.957 | 20.458 | 3.8 | 7.6 | Y | |||
| 23 | 33.3359184 | 36.1629181 | 1.1 | 21.109 | 20.562 | 3.6 | 7.1 | Y | |||
| 24 | 33.3416672 | 36.1738892 | 1.0 | 21.552 | 21.222 | 4.9 | 5.3 | Y | |||
| 25 | 33.3214149 | 36.1205826 | 3.5 | 21.568 | 21.196 | 5.6 | 4.5 | Y | |||
| 26 | 33.3535004 | 36.1727219 | 1.5 | 21.799 | 21.398 | 8.2 | 3.5 | N | |||
| 27 | 33.3389587 | 36.1414452 | 2.4 | 21.814 | 21.458 | 6.6 | 4.2 | Y | |||
| 28 | 33.3247490 | 36.1699982 | 0.5 | 21.991 | 21.616 | 6.9 | 3.5 | N | |||
| 29 | 33.3789597 | 36.1988907 | 3.0 | 22.326 | 21.877 | 7.8 | 3.1 | Y | |||
| 30 | 33.4619598 | 36.2307205 | 7.4 | 20.690 | 20.180 | 2.9 | 11.2 | N | |||
| 31 | 33.4694176 | 36.2234154 | 7.6 | 20.845 | 20.223 | 3.1 | 9.8 | Y | |||
| 32 | 33.4769173 | 36.2040291 | 7.6 | 21.132 | 20.700 | 3.5 | 6.8 | N | |||
| 33 | 33.2707901 | 36.0966949 | 5.5 | 17.659 | 16.706 | 2.4 | 53.3 | N | |||
| 34 | 33.2869987 | 36.0956383 | 5.3 | 18.630 | 18.031 | 2.4 | 31.0 | N | |||
| 35 | 33.2285843 | 36.1292763 | 5.4 | 17.306 | 16.496 | 2.3 | 60.3 | N | |||
| 36 | 33.2309570 | 36.1342239 | 5.2 | 19.463 | 18.691 | 2.4 | 21.5 | N | |||
| 37 | 33.2211685 | 36.1413040 | 5.4 | 17.928 | 17.216 | 2.3 | 46.5 | N | |||
| 38 | 33.4219170 | 36.1992760 | 5.0 | 17.195 | 16.231 | 2.3 | 78.9 | N | |||
| 39 | 33.4609985 | 36.1992493 | 6.8 | 16.906 | 16.181 | 2.4 | 57.1 | N | |||
| 40 | 33.3189583 | 36.1793900 | 0.2 | 17.585 | 16.692 | 2.3 | 73.3 | Y | |||
| 41 | 33.3302078 | 36.1485825 | 1.8 | 17.699 | 16.858 | 2.3 | 54.9 | N | |||
| 42 | 33.3511658 | 36.1708603 | 1.5 | 17.561 | 16.772 | 2.3 | 57.2 | N | |||
| 43 | 33.4364586 | 36.2213593 | 6.1 | 18.337 | 17.426 | 2.3 | 39.8 | N | |||
| 44 | 33.3328743 | 36.2034149 | 1.6 | 18.925 | 18.122 | 4.8 | 30.0 | N | |||
| 45 | 33.3890419 | 36.1674995 | 3.3 | 19.115 | 18.539 | 2.4 | 25.2 | N | |||
| 46 | 33.3397484 | 36.1659431 | 1.1 | 19.286 | 18.540 | 2.4 | 26.4 | Y | |||
| 47 | 33.3222084 | 36.1384430 | 2.4 | 19.019 | 18.452 | 2.4 | 25.7 | N | |||
| 48 | 33.3827095 | 36.2173882 | 3.7 | 17.149 | 16.205 | 2.3 | 70.2 | N | |||
| 49 | 33.4824982 | 36.2344437 | 8.4 | 17.344 | 16.462 | 2.3 | 61.6 | N | |||
| 50 | 33.4132080 | 36.1776123 | 4.4 | 19.096 | 18.472 | 2.4 | 26.9 | N |
References
- Bechtol et al. (2015) Bechtol, K., Drlica-Wagner, A., Balbinot, E., Pieres, A., Simon, J. D., Yanny, B., Santiago, B., Wechsler, R. H., Frieman, J., Walker, A. R., Williams, P., Rozo, E., Rykoff, E. S., Queiroz, A., Luque, E., Benoit-Levy, A., Bernstein, R. A., Tucker, D., Sevilla, I., Gruendl, R. A., da Costa, L. N., Fausti Neto, A., Maia, M. A. G., Abbott, T., Allam, S., Armstrong, R., Bauer, A. H., Bernstein, G. M., Bertin, E., Brooks, D., Buckley-Geer, E., Burke, D. L., Carnero Rosell, A., Castander, F. J., D’Andrea, C. B., DePoy, D. L., Desai, S., Diehl, H. T., Eifler, T. F., Estrada, J., Evrard, A. E., Fernandez, E., Finley, D. A., Flaugher, B., Gaztanaga, E., Gerdes, D., Girardi, L., Gladders, M., Gruen, D., Gutierrez, G., Hao, J., Honscheid, K., Jain, B., James, D., Kent, S., Kron, R., Kuehn, K., Kuropatkin, N., Lahav, O., Li, T. S., Lin, H., Makler, M., March, M., Marshall, J., Martini, P., Merritt, K. W., Miller, C., Miquel, R., Mohr, J., Neilsen, E., Nichol, R., Nord, B., Ogando, R., Peoples, J., Petravick, D., Plazas, A. A., Romer, A. K., Roodman, A., Sako, M., Sanchez, E., Scarpine, V., Schubnell, M., Smith, R. C., Soares-Santos, M., Sobreira, F., Suchyta, E., Swanson, M. E. C., Tarle, G., Thaler, J., Thomas, D., Wester, W., & Zuntz, J. 2015, ArXiv e-prints, arXiv:1503.02584
- Belokurov et al. (2009) Belokurov, V., Walker, M. G., Evans, N. W., Gilmore, G., Irwin, M. J., Mateo, M., Mayer, L., Olszewski, E., Bechtold, J., & Pickering, T. 2009, MNRAS, 397, 1748
- Belokurov et al. (2007) Belokurov, V., Zucker, D. B., Evans, N. W., Kleyna, J. T., Koposov, S., Hodgkin, S. T., Irwin, M. J., Gilmore, G., Wilkinson, M. I., Fellhauer, M., Bramich, D. M., Hewett, P. C., Vidrih, S., De Jong, J. T. A., Smith, J. A., Rix, H.-W., Bell, E. F., Wyse, R. F. G., Newberg, H. J., Mayeur, P. A., Yanny, B., Rockosi, C. M., Gnedin, O. Y., Schneider, D. P., Beers, T. C., Barentine, J. C., Brewington, H., Brinkmann, J., Harvanek, M., Kleinman, S. J., Krzesinski, J., Long, D., Nitta, A., & Snedden, S. A. 2007, ApJ, 654, 897
- Bonnivard et al. (2015) Bonnivard, V., Combet, C., Daniel, M., Funk, S., Geringer-Sameth, A., Hinton, J. A., Maurin, D., Read, J. I., Sarkar, S., Walker, M. G., & Wilkinson, M. I. 2015, MNRAS, 453, 849
- Bressan et al. (2012) Bressan, A., Marigo, P., Girardi, L., Salasnich, B., Dal Cero, C., Rubele, S., & Nanni, A. 2012, MNRAS, 427, 127
- Bullock et al. (2010) Bullock, J. S., Stewart, K. R., Kaplinghat, M., Tollerud, E. J., & Wolf, J. 2010, ApJ, 717, 1043
- Collins et al. (2014) Collins, M. L. M., Chapman, S. C., Rich, R. M., Ibata, R. A., Martin, N. F., Irwin, M. J., Bate, N. F., Lewis, G. F., Peñarrubia, J., Arimoto, N., Casey, C. M., Ferguson, A. M. N., Koch, A., McConnachie, A. W., & Tanvir, N. 2014, ApJ, 783, 7
- Deason et al. (2014) Deason, A. J., Belokurov, V., Hamren, K. M., Koposov, S. E., Gilbert, K. M., Beaton, R. L., Dorman, C. E., Guhathakurta, P., Majewski, S. R., & Cunningham, E. C. 2014, MNRAS, 444, 3975
- Drlica-Wagner et al. (2015) Drlica-Wagner, A., Bechtol, K., Rykoff, E. S., Luque, E., Queiroz, A., Mao, Y.-Y., Wechsler, R. H., Simon, J. D., Santiago, B., Yanny, B., Balbinot, E., Dodelson, S., Fausti Neto, A., James, D. J., Li, T. S., Maia, M. A. G., Marshall, J. L., Pieres, A., Stringer, K., Walker, A. R., Abbott, T. M. C., Abdalla, F. B., Allam, S., Benoit-Levy, A., Bernstein, G. M., Bertin, E., Brooks, D., Buckley-Geer, E., Burke, D. L., Carnero Rosell, A., Carrasco Kind, M., Carretero, J., Crocce, M., da Costa, L. N., Desai, S., Diehl, H. T., Dietrich, J. P., Doel, P., Eifler, T. F., Evrard, A. E., Finley, D. A., Fosalba, P., Frieman, J., Gaztanaga, E., Gerdes, D. W., Gruen, D., Gruendl, R. A., Gutierrez, G., Honscheid, K., Kuehn, K., Kuropatkin, N., Lahav, O., Martini, P., Miquel, R., Nord, B., Ogando, R., Plazas, A. A., Reil, K., Roodman, A., Sako, M., Sanchez, E., Scarpine, V., Schubnell, M., Sevilla-Noarbe, I., Smith, R. C., Soares-Santos, M., Sobreira, F., Suchyta, E., Swanson, M. E. C., Tarle, G., Tucker, D., Vikram, V., Wester, W., Zhang, Y., & Zuntz, J. 2015, ArXiv e-prints
- Faber et al. (2003) Faber, S. M., Phillips, A. C., Kibrick, R. I., Alcott, B., Allen, S. L., Burrous, J., Cantrall, T., Clarke, D., Coil, A. L., Cowley, D. J., Davis, M., Deich, W. T. S., Dietsch, K., Gilmore, D. K., Harper, C. A., Hilyard, D. F., Lewis, J. P., McVeigh, M., Newman, J., Osborne, J., Schiavon, R., Stover, R. J., Tucker, D., Wallace, V., Wei, M., Wirth, G., & Wright, C. A. 2003, in Society of Photo-Optical Instrumentation Engineers (SPIE) Conference Series, Vol. 4841, Instrument Design and Performance for Optical/Infrared Ground-based Telescopes, ed. M. Iye & A. F. M. Moorwood, 1657–1669
- Geha et al. (2009) Geha, M., Willman, B., Simon, J. D., Strigari, L. E., Kirby, E. N., Law, D. R., & Strader, J. 2009, ApJ, 692, 1464
- Geringer-Sameth et al. (2015) Geringer-Sameth, A., Koushiappas, S. M., & Walker, M. G. 2015, Phys. Rev. D, 91, 083535
- Gilmore et al. (2007) Gilmore, G., Wilkinson, M. I., Wyse, R. F. G., Kleyna, J. T., Koch, A., Evans, N. W., & Grebel, E. K. 2007, ApJ, 663, 948
- Harris (1996) Harris, W. E. 1996, AJ, 112, 1487
- Ibata et al. (2005) Ibata, R., Chapman, S., Ferguson, A. M. N., Lewis, G., Irwin, M., & Tanvir, N. 2005, ApJ, 634, 287
- Ibata et al. (2011) Ibata, R., Sollima, A., Nipoti, C., Bellazzini, M., Chapman, S. C., & Dalessandro, E. 2011, ApJ, 738, 186
- Kelson (2003) Kelson, D. D. 2003, PASP, 115, 688
- Kirby et al. (2013a) Kirby, E. N., Boylan-Kolchin, M., Cohen, J. G., Geha, M., Bullock, J. S., & Kaplinghat, M. 2013a, ApJ, 770, 16
- Kirby et al. (2013b) Kirby, E. N., Cohen, J. G., Guhathakurta, P., Cheng, L., Bullock, J. S., & Gallazzi, A. 2013b, ApJ, 779, 102
- Kirby et al. (2015) Kirby, E. N., Simon, J. D., & Cohen, J. G. 2015, ApJ, 810, 56
- Koch & Rich (2014) Koch, A., & Rich, R. M. 2014, ApJ, 794, 89
- Koposov et al. (2015) Koposov, S. E., Belokurov, V., Torrealba, G., & Wyn Evans, N. 2015, ArXiv e-prints, arXiv:1503.02079
- Laevens et al. (2015a) Laevens, B. P. M., Martin, N. F., Bernard, E. J., Schlafly, E. F., Sesar, B., Rix, H.-W., Bell, E. F., Ferguson, A. M. N., Slater, C. T., Sweeney, W. E., Wyse, R. F. G., Huxor, A. P., Burgett, W. S., Chambers, K. C., Draper, P. W., Magnier, E. A., Metcalfe, N., Tonry, J. L., Wainscoat, R. J., & Waters, C. 2015a, ArXiv e-prints
- Laevens et al. (2015b) Laevens, B. P. M., Martin, N. F., Ibata, R. A., Rix, H.-W., Bernard, E. J., Bell, E. F., Sesar, B., Ferguson, A. M. N., Schlafly, E. F., Slater, C. T., Burgett, W. S., Chambers, K. C., Flewelling, H., Hodapp, K. A., Kaiser, N., Kudritzki, R.-P., Lupton, R. H., Magnier, E. A., Metcalfe, N., Morgan, J. S., Price, P. A., Tonry, J. L., Wainscoat, R. J., & Waters, C. 2015b, ApJ, 802, L18
- Leaman et al. (2013) Leaman, R., Venn, K. A., Brooks, A. M., Battaglia, G., Cole, A. A., Ibata, R. A., Irwin, M. J., McConnachie, A. W., Mendel, J. T., Starkenburg, E., & Tolstoy, E. 2013, ApJ, 767, 131
- Martin et al. (2015) Martin, N. F., Geha, M., Ibata, R. A., Collins, M. L. M., Laevens, B. P. M., Bell, E. F., Rix, H.-W., Ferguson, A. M. N., Chambers, K. C., Wainscoat, R. J., & Waters, C. 2015, ArXiv e-prints
- Martin et al. (2007a) Martin, N. F., Ibata, R. A., Chapman, S. C., Irwin, M., & Lewis, G. F. 2007a, MNRAS, 380, 281
- Martin et al. (2007b) Martin, N. F., Ibata, R. A., & Irwin, M. 2007b, ApJ, 668, L123
- Martin et al. (2014) Martin, N. F., Ibata, R. A., Rich, R. M., Collins, M. L. M., Fardal, M. A., Irwin, M. J., Lewis, G. F., McConnachie, A. W., Babul, A., Bate, N. F., Chapman, S. C., Conn, A. R., Crnojević, D., Ferguson, A. M. N., Mackey, A. D., Navarro, J. F., Peñarrubia, J., Tanvir, N. T., & Valls-Gabaud, D. 2014, ApJ, 787, 19
- McConnachie (2012) McConnachie, A. W. 2012, AJ, 144, 4
- McConnachie & Côté (2010) McConnachie, A. W., & Côté, P. 2010, ApJ, 722, L209
- Muñoz et al. (2012) Muñoz, R. R., Padmanabhan, N., & Geha, M. 2012, ApJ, 745, 127
- Norris et al. (2010) Norris, J. E., Wyse, R. F. G., Gilmore, G., Yong, D., Frebel, A., Wilkinson, M. I., Belokurov, V., & Zucker, D. B. 2010, ApJ, 723, 1632
- Rocha-Pinto et al. (2004) Rocha-Pinto, H. J., Majewski, S. R., Skrutskie, M. F., Crane, J. D., & Patterson, R. J. 2004, ApJ, 615, 732
- Simon et al. (2015) Simon, J. D., Drlica-Wagner, A., Li, T. S., Nord, B., Geha, M., Bechtol, K., Balbinot, E., Buckley-Geer, E., Lin, H., Marshall, J., Santiago, B., Strigari, L., Wang, M., Wechsler, R. H., Yanny, B., Abbott, T., Bauer, A. H., Bernstein, G. M., Bertin, E., Brooks, D., Burke, D. L., Capozzi, D., Carnero Rosell, A., Carrasco Kind, M., D’Andrea, C. B., da Costa, L. N., DePoy, D. L., Desai, S., Diehl, H. T., Dodelson, S., Cunha, C. E., Estrada, J., Evrard, A. E., Fausti Neto, A., Fernandez, E., Finley, D. A., Flaugher, B., Frieman, J., Gaztanaga, E., Gerdes, D., Gruen, D., Gruendl, R. A., Honscheid, K., James, D., Kent, S., Kuehn, K., Kuropatkin, N., Lahav, O., Maia, M. A. G., March, M., Martini, P., Miller, C. J., Miquel, R., Ogando, R., Romer, A. K., Roodman, A., Rykoff, E. S., Sako, M., Sanchez, E., Schubnell, M., Sevilla, I., Smith, R. C., Soares-Santos, M., Sobreira, F., Suchyta, E., Swanson, M. E. C., Tarle, G., Thaler, J., Tucker, D., Vikram, V., Walker, A. R., Wester, W., & The DES Collaboration. 2015, ApJ, 808, 95
- Simon & Geha (2007) Simon, J. D., & Geha, M. 2007, ApJ, 670, 313
- Simon et al. (2011) Simon, J. D., Geha, M., Minor, Q. E., Martinez, G. D., Kirby, E. N., Bullock, J. S., Kaplinghat, M., Strigari, L. E., Willman, B., Choi, P. I., Tollerud, E. J., & Wolf, J. 2011, ApJ, 733, 46
- Starkenburg et al. (2010) Starkenburg, E., Hill, V., Tolstoy, E., González Hernández, J. I., Irwin, M., Helmi, A., Battaglia, G., Jablonka, P., Tafelmeyer, M., Shetrone, M., Venn, K., & de Boer, T. 2010, A&A, 513, A34
- Tollerud et al. (2008) Tollerud, E. J., Bullock, J. S., Strigari, L. E., & Willman, B. 2008, ApJ, 688, 277
- Tonry et al. (2012) Tonry, J. L., Stubbs, C. W., Lykke, K. R., Doherty, P., Shivvers, I. S., Burgett, W. S., Chambers, K. C., Hodapp, K. W., Kaiser, N., Kudritzki, R.-P., Magnier, E. A., Morgan, J. S., Price, P. A., & Wainscoat, R. J. 2012, ApJ, 750, 99
- Walker et al. (2015) Walker, M. G., Mateo, M., Olszewski, E. W., Bailey, III, J. I., Koposov, S. E., Belokurov, V., & Evans, N. W. 2015, ApJ, 808, 108
- Wheeler et al. (2015) Wheeler, C., Oñorbe, J., Bullock, J. S., Boylan-Kolchin, M., Elbert, O. D., Garrison-Kimmel, S., Hopkins, P. F., & Kereš, D. 2015, MNRAS, 453, 1305
- Willman et al. (2005) Willman, B., Blanton, M. R., West, A. A., Dalcanton, J. J., Hogg, D. W., Schneider, D. P., Wherry, N., Yanny, B., & Brinkmann, J. 2005, AJ, 129, 2692
- Willman et al. (2011) Willman, B., Geha, M., Strader, J., Strigari, L. E., Simon, J. D., Kirby, E., Ho, N., & Warres, A. 2011, AJ, 142, 128
- Wolf et al. (2010) Wolf, J., Martinez, G. D., Bullock, J. S., Kaplinghat, M., Geha, M., Muñoz, R. R., Simon, J. D., & Avedo, F. F. 2010, MNRAS, 406, 1220