The Evolution of Gas and Star Formation from z=3 to z=0
Abstract
The cosmic star formation rate density first increases with time towards a pronounced peak 10 Gyrs ago (or z=1-2) and then slows down, dropping by more than a factor 10 since z=1. The processes at the origin of the star formation quenching are not yet well identified, either the gas is expelled by supernovae and AGN feedback, or prevented to inflow. Morphological transformation or environment effects are also invoked. Recent IRAM/NOEMA and ALMA results are reviewed about the molecular content of galaxies and its dynamics, as a function of redshift. Along the main sequence of massive star forming galaxies, the gas fraction was higher in the past (up to 80%), and galaxy disks were more unstable and more turbulent. The star formation efficiency increases with redshift, or equivalently the depletion time decreases, whatever the position of galaxies, either on the main sequence or above. Attempts have been made to determine the cosmic evolution of the H2 density, but deeper ALMA observations are needed to effectively compare with models.
keywords:
Galaxies, Star formation, AGN, Interstellar medium, Molecular gas1 Introduction
The cosmic star formation and its evolution through the Hubble time is now well established (e.g. Madau & Dickinson 2014). One of the main issue is to understand the rather fast winding down of star formation after z=2, both globally and also in individual galaxies. The suppression of star formation in galaxies appears rather sudden and therefore is called quenching; this has been revealed by their bimodal distribution, between a blue cloud of galaxies actively forming stars, and a red sequence of dead objects. The paucity of galaxies in an intermediate sequence (e.g. Baldry et al. 2006) means that the quenching time-scale is typically smaller than 1 Gyr. However the quenching mechanism is hard to identify. In a recent study of 56 GOODS galaxies at z=1.7, Mancini et al. (2015) found an equal proportion of AGN in both star forming and quenched galaxies, and their morphology, traced by the bulge to disk ratio or their Sersic index, was also comparable over a large range of specific star formation rate (SFR).
Since star formation is directly linked to the amount of molecular gas present, and in which state, it is primordial to determine the gas fraction as a function of redshift, and also the star formation efficiency (SFE), defined by the ratio between SFR and gas mass. In the recent years, a large variety of data have been obtained, with somewhat discrepant results, revealing either low or high SFE at high redshift. In sub-millimeter galaxies (SMG), and ultra-luminous starbursts (ULIRGs) the SFE increases with redshift, and the depletion time (the inverse of SFE) which is of the order of 0.5-1Gyr for ULIRGs at z 0 becomes as low as 10-100 Myr at z=1-2 (Greve et al. 2005, Combes et al. 2011, 2013). But there exists a population of massive BzK galaxies, selected from their near-IR and optical colors, which are also actively forming stars (they are ULIRGs), but with a lower efficiency, with a depletion time-scale of the order of 0.3 Gyr at z 1.5 (Daddi et al. 2008), i.e. similar to local ULIRGs. This might be due to their extended molecular component (10 kpc scales), and their low density state, revealed by their low excitation: the CO emission as a function of the upper level peaks at , as in the Milky Way (Dannerbauer et al 2009), justifiying the adoption of the standard CO-to-H2 conversion factor (5 times that adopted for ULIRGs). Let us recall that local main-sequence galaxies, such as the Milky Way, have a depletion time-scale of the order of 2 Gyr (Bigiel et al. 2011).
2 Starburst galaxies
In a recent work with IRAM and ALMA, Silverman et al. (2015) detected CO emission in 7 galaxies from COSMOS, with SFR 300-800 M⊙/yr, at 1.4 z 1.7. Their gas fraction was determined to be 30-50%, and their global SFE is enhanced, although the objects are unresolved, and the starbursting regions cannot be separated.
To trace redshift evolution, and in particular the winding down of star formation after z=1, the intermediate redshift epoch 0.2 z 1 is a key region to explore. We have observed the gas content of ULIRGs at these intermediate z, to make the link with local starbursts (Combes et al. 2011, 2013). Out of 69 ULIRG, 33 were detected in CO emission, with variable excitation. Some of the objects have a lower H2 density, which can be explained in terms of at least two components. The objects where an interferometric map is available show the separation of the molecular emission in a nuclear starburst and an extended gas disk of scale 20 kpc. The presence of such an extended component may explain lower SFE, in particular when low gas excitation suggests a higher CO-to-H2 conversion ratio.
This study at intermediate z, compared to all other starburst data, showed that both gas fraction and SFE increase with redshift, by a factor 3, between z=0 and 1, with or without taking into account upper limits.
Recently, the Bzk galaxies at z=1.5, which show globally low excitation of the CO lines at low were observed to have quite high CO(5-4) fluxes, revealing a second component of more excited, denser and warmer molecular gas (Daddi et al. 2015). For this excited component, the objects have the same correlations than for ULIRGs, confirming that the starburst occurs either in a separate nuclear region, or in hot and dense star forming clumps. In local starbursts, the total CO SLEDs observed with Herschel reveal a very large variety of shapes, revealing several molecular components (Mashian et al 2015), suggesting that the overall CO-to-H2 conversion ratio could explore even wider ranges than expected, from =0.4 to 5 M⊙/(K km/s pc2) for the M(H2) to L’CO ratio.
3 Main sequence galaxies
Most of the cosmic star formation ( 90%) occurs in the main sequence galaxies, and only about 10% in starbursts. The main sequence is clearly defined in an SFR versus stellar mass diagram as a power-law of slope slightly lower than 1. This power-law is similar at all redshift ranges, but the zero point is increasing with redshift, following the evolution of the cosmic star formation rate density described in the introduction. Large surveys of hundred thousands of galaxies locally (SDSS) or at high redshift (GOODS, COSMOS, ..) have shown a correlation between morphology and stellar populations since z2.5 (Wuyts et al. 2011): blue star forming galaxies on the main sequence are exponential disks (Sersic index near 1), while quiescent red systems are of de Vaucouleurs type (Sersic index more near 4).
With the goal to explore the molecular gas content of main sequence galaxies, we undertook the PHIBSS project (Plateau de Bure HIgh z Blue Sequence Survey, Tacconi et al. 2010, 2013). In the first part of the project, 52 galaxies were detected at IRAM in the CO(3-2) line at z=1.2 and 2.3. The targets were selected to be massive (M 2.5 1010 M⊙) star forming galaxies (SFR 30 M⊙/yr). Adopting a standard CO-to-H2 conversion ratio for these main sequence objects, molecular masses were found between 1010 and 3 1011 M⊙, corresponding to gas fraction in average of 33% at z=1.2 and 47% at z=2.3. The SFE was found to increase slightly with z, and the depletion time scale is in average 0.7 Gyr at z=1.2.
The CO detection rate was quite high (85%), in these « normal » massive Star Forming Galaxies (SFG). Some were mapped at high spatial resolution, and a rather regular velocity field was found, confirming the absence of major mergers. At z=1.2, it was possible to resolve four galaxy disks in clumps with the help of the velocity information, both with CO and [OII] lines (gas content and SFR), since there is a good correlation between molecular and ionised gas. This allowed us to draw a resolved Kennicutt-Schmidt (KS) relation (Freundlich et al. 2013). The high-z points extend the local KS relation towards high gas and SFR surface densities, with the same slope. For one galaxy at z=1.5, it was possible to observe the H line at high resolution from the ground (Genzel et al. 2013). The KS slope depends strongly on the dust extinction model adopted, but falls around 1.
The evolution of specific SFR with redshift was compatible with the results of optical surveys, provided that the depletion time is varying on the main sequence as =1.5/(1+z) Gyr. The PHIBSS project is now being extended with the goal of observing CO lines in about 150 galaxies, exploring also intermediate redshifts (z=0.5-0.7), and some galaxies departing from the main sequence, either starbursts above the MS or quiescent galaxies below (PHIBSS2). Detecting smaller masses, and bright galaxies with more spatial resolution and/or more molecular lines in addition will be attempted with ALMA.
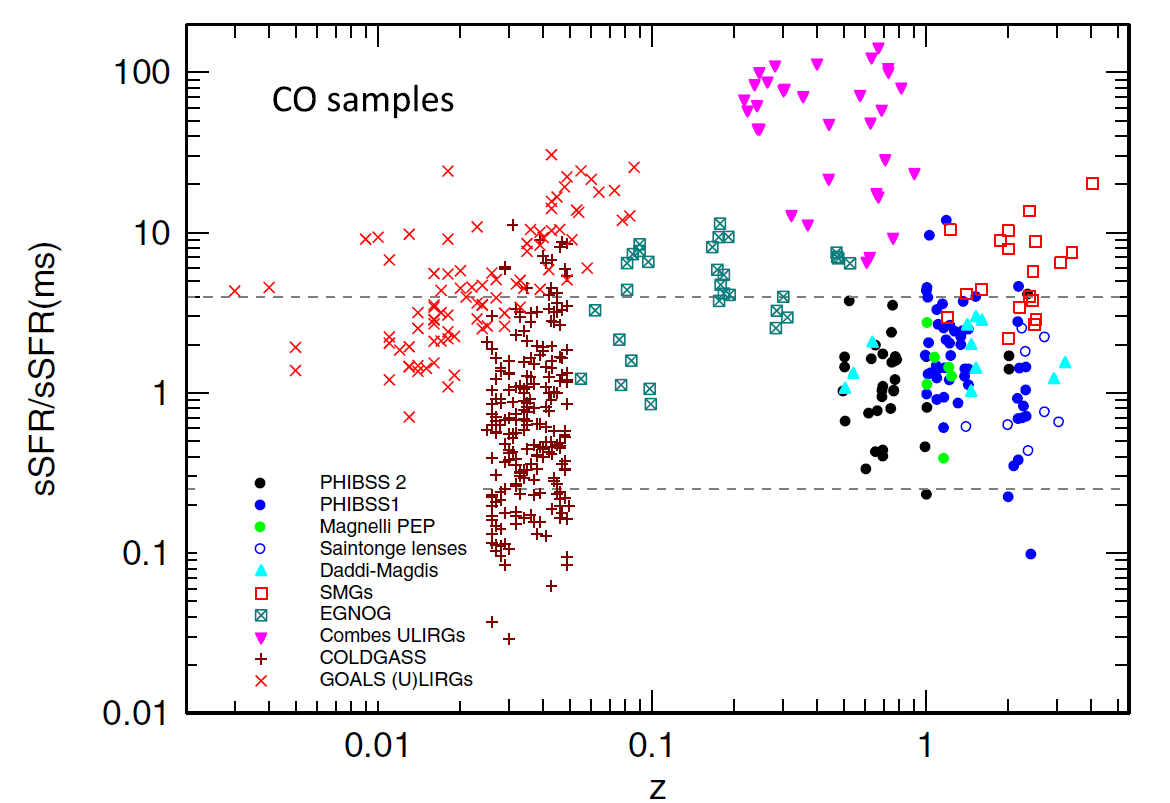
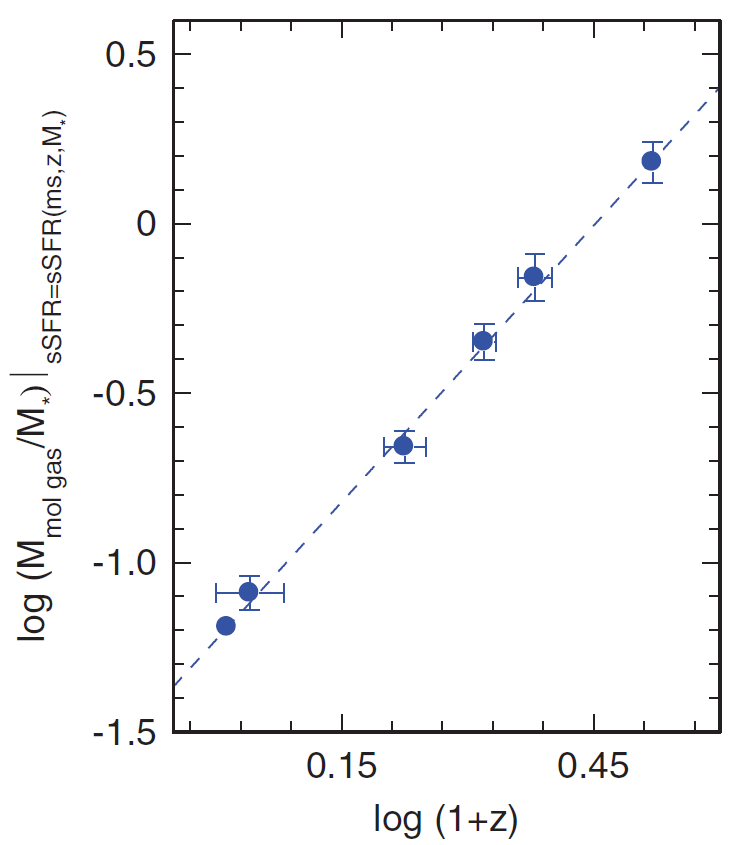
The first results and the scaling relations obtained on the main sequence, by comparison with all other data with CO detections at high redshift (cf Fig 1), were presented in Genzel et al. (2015). On the MS, the gas fraction increases regularly with z, as shown in Fig 2.
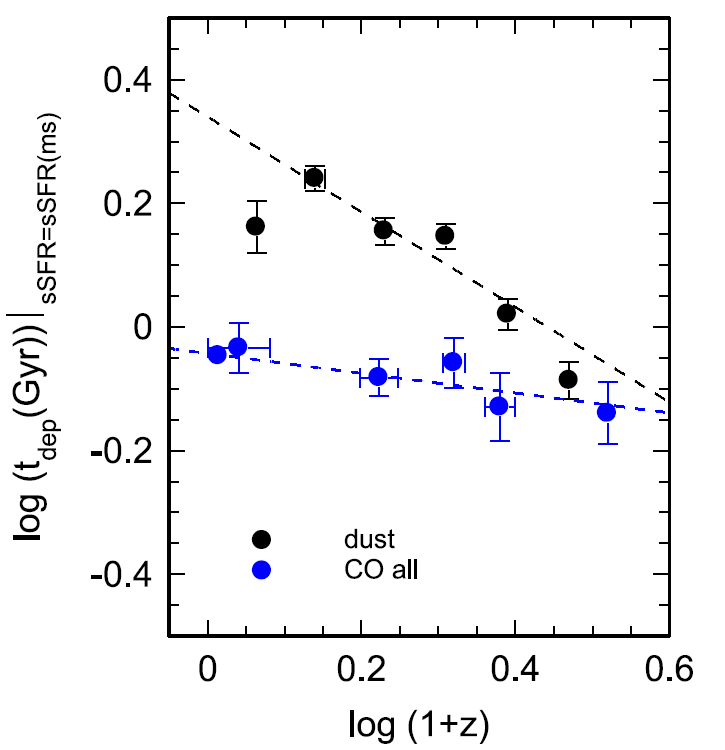
Fig 3 displays the depletion time as a function of redshift, for the galaxies on the main sequence. There is a slight decrease, and the effect depends on the way the molecular gas content is estimated, either from the CO line, or from the dust emission.
A recent survey with ALMA of the continuum dust emission of 180 star forming galaxies between z=1 and 6.4 results in slightly different results (Scoville et al. 2015). The gas fraction estimated from the dust emission, assuming a constant dust temperature, is also highly increasing with redshift, reaching values as high as 50-80%. The depletion time-scale is found to be the same for starbursts and main sequence galaxies; it decreases strongly with redshift, to reach 200 Myr at z, therefore 10 times lower than for local MS galaxies.
4 The cosmic H2 density
One of the key issues to understand the cosmic star formation history is to observe the cosmic evolution of the H2 density. Theoretical considerations and semi-analytical models predict that the molecular gas density must increase with redshift, and dominate over the atomic gas in galaxies (Obreschkow & Rawlings, 2009, Obreschkow et al. 2009). The phase transition from atomic to molecular hydrogen is favored by pressure (Blitz & Rosolowsky 2006), while surface density and consequently the pressure is higher in high-z galaxies. The modelisation predicts a molecular-to-atomic ratio H2/HI varying as (1+z)m, with m as high as 1.6. Some models however predict flatter evolutions of the H2 density at high z (Lagos et al. 2011, Popping et al. 2014).
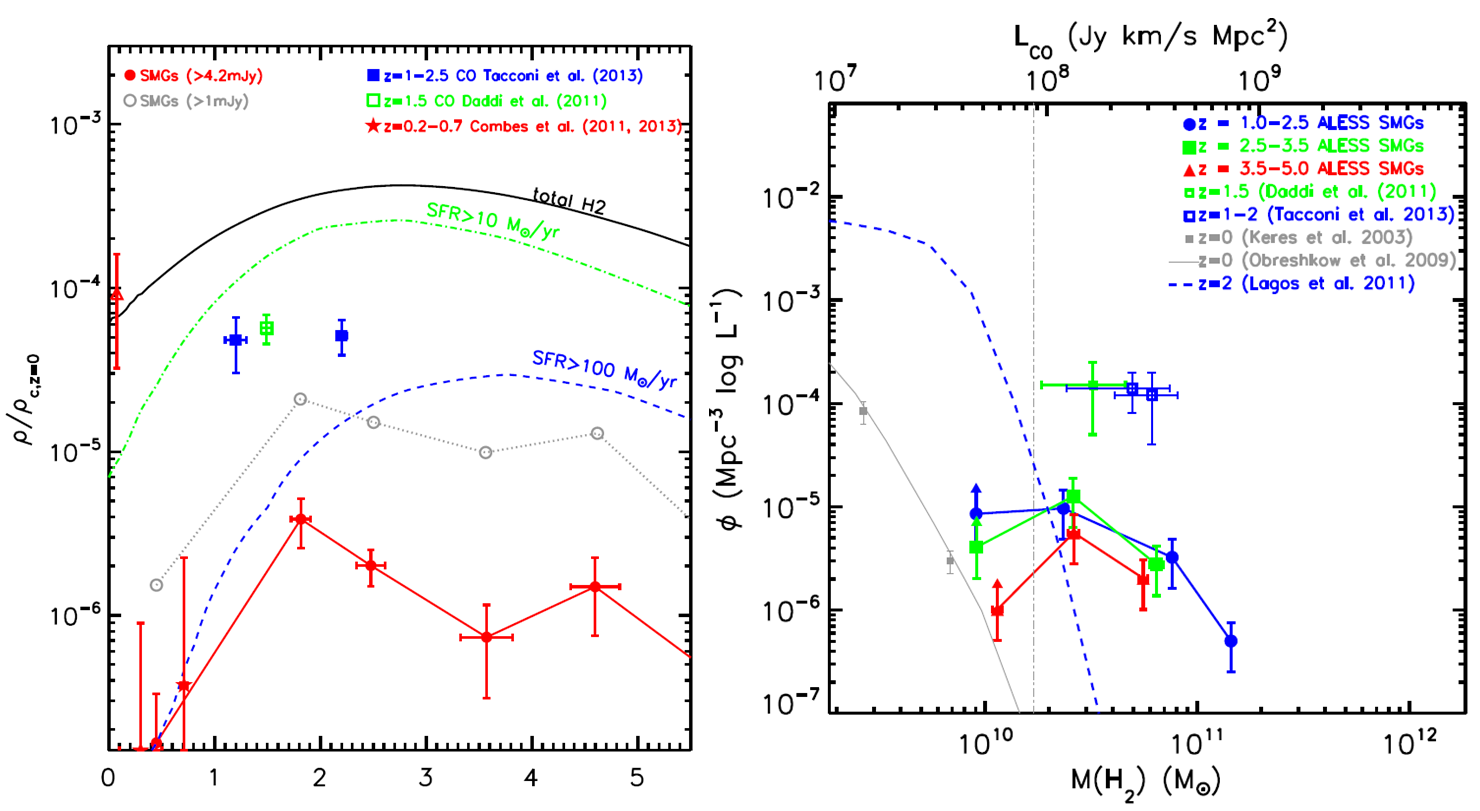
Decarli et al. (2014) and Walter et al. (2014) have attempted to constrain the H2 density by observing a large cosmic volume of 7000 Mpc3, in the Hubble deep field North with Plateau de Bure. They separate the results in three redshift bins: z0.45, 1.01z1.89 and z2. A blind molecular line survey has been carried out through scanning the whole 3mm band. The blind detection of 17 CO lines, together with the upper limits obtained by stacking the observations towards spectroscopically identified objects, constrain the CO luminosity functions at the corresponding redshifts. The results show that optical/mid-IR bright galaxies contribute less than 50% to the star formation rate density at 1 z 3, and the normalised density (H2) at high z tends to be higher than the predictions.
It might be easier and certainly quicker to determine the evolution of the H2 density from dust emission surveys. A recent 870m continuum survey with ALMA of 99 SMG in the Extended Chandra Deep Field South (Swinbank et al. 2014) has discovered that the well detected sources (S870 4.2 mJy) are in average ULIRGs with SFR=300 M⊙/yr, and dust temperatures of 32 K. They contribute to only 1-2% of SFR. The extrapolation of the counts down to S 1 mJy through stacking shows that these sources contribute to 20% of the cosmic star formation density over z=1-4 (see Fig 4). Deriving H2 masses from dust masses, the average SFE is found rather high, with depletion time-scale of 130 Myr.
5 Conclusions
It is now well established that galaxies at high redshift have a larger gas fraction than local ones, whatever their position on the main sequence or above, in the starburst domain. The gas fraction can reach 50% and above.
There is not yet a consensus on the exact evolution of the star formation efficiency with redshift. The inverse of the SFE, the depletion time scale, is decreasing with redshift, however the amplitude of its variation with z is still debated. The various results depend on the way to estimate the total molecular gas amount, either from CO lines or from dust emission. The results may also depend on the definition of the Main Sequence (e.g. Renzini & Peng, 2015).
A higher SFE at high z might be explained by a higher surface density of molecular gas, if the Kennicutt-Schmidt relation is non-linear, which is not yet well known. Alternatively, a starburst can be triggered in nuclear regions when the gas is concentrated. Diagnostics could be searched for with CO excitation and the observation of several lines, and also dense gas tracers (HCN, HCO+).
ALMA observations begin to estimate the evolution of the molecular gas mass in galaxies, however we are still far from a total census of (H2) as a function of redshift.
References
- [] Baldry, I. K., Balogh, M. L., Bower, R. G. et al.: 2006, MNRAS 373, 469
- [] Bigiel, F., Leroy, A. K., Walter, F. et al. 2011, ApJ, 730, L13
- [] Blitz L., Rosolowsky E.: 2006, ApJ, 650, 933
- [] Combes, F., Garcia-Burillo, S., Braine, J. et al.: 2011 A&A 528, A124
- [] Combes, F., Garcia-Burillo, S., Braine, J. et al.: 2013 A&A 550, A41
- [] Daddi, E., Dannerbauer, H., Elbaz, D. et al.: 2008, ApJ, 673, L21
- [] Daddi, E., Bournaud, F., Walter, F. et al., 2010, ApJ, 713, 686
- [] Daddi, E., Dannerbauer, H., Liu, D. et al. 2015, A&A 577, A46
- [] Dannerbauer, H., Daddi, E., Riechers, D. A. et al.: 2009, ApJ, 698, L178
- [] Decarli, R., Walter, F., Carilli, C. et al.: 2014, ApJ, 782, 78
- [] Freundlich, J., Combes, F., Tacconi, L. J. et al.: 2013, A&A 553, A130
- [] Genzel, R., Tacconi, L. J., Kurk, J. et al.: 2013, ApJ, 773, 68
- [] Genzel, R., Tacconi, L. J., Lutz, D. et al.: 2015, ApJ, 800, 20
- [] Greve, T. R., Bertoldi, F., Smail, I. et al.: 2005 MNRAS 359, 1165
- [] Lagos C. d P., Baugh C. M., Lacey C. G. et al. 2011, MNRAS 418, 1649
- [] Madau, P., Dickinson, M.: 2014, ARAA 52, 415
- [] Mancini, C., Renzini, A., Daddi, E. et al. 2015, MNRAS 450, 763
- [] Mashian, N., Sturm, E., Sternberg, A. et al. 2015, ApJ, 802, 81
- [] Obreschkow D., Croton D., de Lucia G. et al. 2009, ApJ, 698, 1467
- [] Obreschkow D., Rawlings S.: 2009, ApJ, 696, L129
- [] Popping G., Somerville R. S., Trager S. C., 2014, MNRAS, 442, 2398
- [] Renzini, A., Peng, Y.-J. : 2015, ApJ, 801, L29
- [] Scoville, N., Sheth, K., Aussel, H. et al.: 2015, ApJ, in press, arXiv1505-02159
- [] Silverman, J. D., Daddi, E., Rodighiero, G. et al. 2015, ApJ, in press, arXiv1505-04977
- [] Swinbank A. M., Simpson J. M., Smail I., et al. 2014, MNRAS, 438, 1267
- [] Tacconi, L. J., Genzel, R., Neri, R. et al.: 2010, Nature, 463, 781
- [] Tacconi, L. J., Neri, R., Genzel, R. et al.: 2013, ApJ, 768, 74
- [] Walter, F., Decarli, R., Sargent, M. et al. 2014, ApJ, 782, 79
- [] Whitaker, K. E., van Dokkum, P. G., Brammer, G., & Franx, M. 2012, ApJ, 754, L29
- [] Wuyts, S., Förster Schreiber, N. M., van der Wel, A. et al.: 2011 ApJ, 742, 96