Gluon shadowing effects on and production in Pb collisions at GeV and Pb collisions at GeV at AFTER@LHC
Abstract
We explore the effects of shadowing on inclusive and production at AFTER@LHC. We also present the rates as a function of and rapidity for Pb and Pb collisions in the proposed AFTER@LHC rapidity acceptance.
I Introduction
The AFTER@LHC quarkonium program has the unique opportunity to study quarkonium production at large momentum fractions, , in the target region Brodsky:2012vg . The most favorable configuration for high rates at large for the nucleus is a proton beam from the LHC on a heavy nuclear target. In this case, the nucleon-nucleon center of mass energy is more than half that of the RHIC collider, GeV, for the top LHC proton beam energy of 7 TeV. However, the fixed-target configuration is an advantage because of the higher intensity on target. The longer LHC proton runs gives a luminosity over a s LHC ’year’. On a 1 cm thick Pb target, with Pb collisions, b-1 s-1. When a lead beam is extracted the run time is shorter, an LHC Pb ’year’ is s. The lower ratio also results in a lower center-of-mass energy of GeV for the top lead beam energy of 2.76 TeV. On a liquid H2 target, for Pb collisions, mb-1 s-1 per centimeter target length so that a 1 m target gives a luminosity of mb-1 s-1 Brodsky:2012vg .
Here we will consider the inclusive and (1S) rates in Pb collisions at GeV and Pb collisions at GeV. The results are presented as a function of rapidity, , and transverse momentum, , of the quarkonium state. We choose to present the results in a 0.5 unit wide rapidity bin in the backward region of the center of mass of the collision, for GeV and for GeV. This is a region that has been virtually unexplored in previous quarkonium production measurements but, as we will show, can be studied by AFTER@LHC with relatively high statistics in most cases.
Our calculations are done in the next-to-leading order (NLO) color evaporation model (CEM) Gavai:1994in and employ the EPS09 NLO parameterization Eskola:2009 of the effects of modification of the parton distribution functions in the nucleus, referred to here as ’shadowing’. Since this set also provides an uncertainty band, the results are representative of the range of shadowing parameterizations produced by other groups.
We also present the nuclear suppression factor ratios, for Pb collisions and for Pb collisions. These quantities are the ratio of the per nucleon cross sections in Pb (Pb) collisions relative the same cross section in collisions at the same center of mass energy. These ratios are also given as a function of and .
In Sec. II, we will show the EPS09 NLO shadowing parameterizations at the appropriate factorization scale for and production as a function of with emphasis on the appropriate regions for the AFTER@LHC kinematics. We present the ratios and rates obtained with the EPS09 NLO parameterization in Sec. III. We conclude with some final remarks in Sec. IV.
II Shadowing parameterization
Our calculations employ the EPS09 shadowing parameterization Eskola:2009 . At NLO, it is based on the CTEQ6M proton parton densities (PDFs) CTEQ6M . In our calculations of quarkonium production Nelson:2012bc ; Nelson_inprog , we use the CT10 CT10PDFs proton PDFs with the EPS09 NLO parameterization. As long as both calculations are at NLO, the choice of proton PDFs used to calculate quarkonium production does not affect the shape or magnitude of the nuclear suppression factors RV_inprog .
One possibility for the AFTER@LHC experiment is to use the LHCb detector, either as is, with , or an improved LHCb (LHCb+), with .
In the fixed-target kinematics of AFTER@LHC, with a 7 TeV proton beam, the rapidity range is , corresponding to a center of mass rapidity coverage of for LHCb or for LHCb+ in Pb collisions at GeV. In this case, the Pb nucleus is the target. If refers to the momentum fraction probed in the proton beam and is the momentum fraction probed in the lead target, in these kinematics, the negative rapidity means that is large, . This range has not been explored since early nuclear deep-inelastic scattering (nDIS) measurements such as by the European Muon Collaboration EMC and at SLAC SLAC and has never been explored by gluon-dominated processes such as quarkonium production. AFTER@LHC would be the first experiment to probe these kinematics since most fixed-target configurations studying quarkonium have placed the detectors downstream where , as at the CERN SPS NA38 ; NA50 and the Fermilab Tevatron E866 . The only quarkonium experiment to measure part of this backward, large region was HERA-B with its foils placed around the edges of the proton beam at HERA HERA-B .
On the other hand, with a 2.76 TeV lead beam, the rapidity range is , corresponding to a center of mass rapidity coverage of for LHCb or for LHCb+ in Pb collisions at GeV. In this case, the proton is the target, with , and the lead beam is assigned . Thus, the nuclear momentum fractions probed are moderate, . This region has been well studied in nDIS experiments but, again, not for final states dominated by initial-state gluons.
Global fits to the nuclear parton densities (nPDFs), such as EPS09, typically include nuclear deep-inelastic scattering data ( in and ), Drell-Yan data, and, more recently, RHIC data such as production Eskola:2009 . The range over which DGLAP evolution can be applied ( GeV2) for fixed-target nDIS limits the minimum values probed. In addition, such analyses do not take into account the possibility of any other cold nuclear matter effects so that the possibility of an effect such as initial-state energy loss in matter by quarks in Drell-Yan dilepton production is folded in with the global analysis of nuclear shadowing. Quarkonium production is particularly subject to other cold nuclear matter effects such as energy loss in matter, break up of the quarkonium state by nucleons (nuclear absorption), and interactions with comoving hadrons, see e.g. Ref. RV_e866 for a discussion. For the purposes of this paper, we focus only on the expected effects of shadowing.
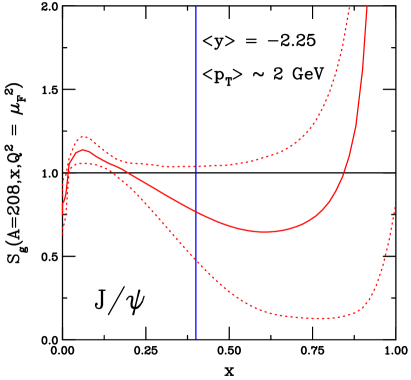
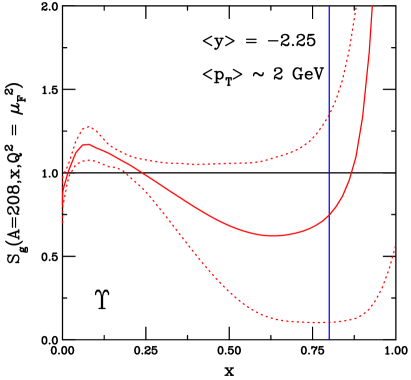
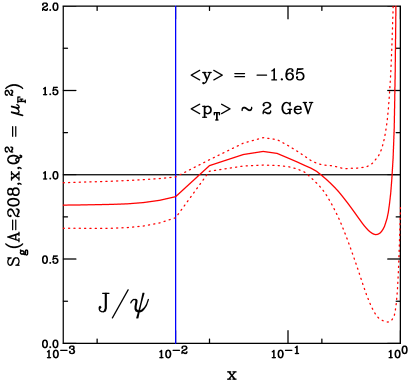
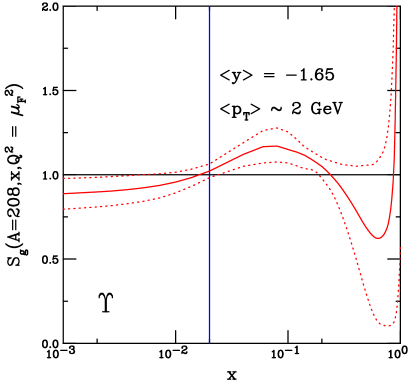
Figure 1 shows the EPS09 NLO gluon shadowing parameterization as a function of momentum fraction, . The scales at which the results are shown correspond to those used in the CEM for (left-hand side) and (right-hand side) production. Along with the central set, denoted by the solid curves, the dotted curves display the uncertainty band. EPS09 obtains 30 additional sets of shadowing ratios by varying each of the 15 parameters within one standard deviation of the mean. The differences are added in quadrature to produce the uncertainty band in the shadowing ratio . (We note that the uncertainties in the corresponding LO set are larger while the central shadowing effect is greater at LO than at NLO. For more details concerning this set as well as differences between other available nPDF sets, see Ref. RV_inprog .)
The vertical blue line in each panel shows the average value for the final quarkonium states at each energy, Pb on top and Pb on the bottom. This is obtained by estimating the average value from the simpler kinematics of the LO CEM with and replacing by with . The value from the LO CEM represents a lower limit on relative to the actual and kinematics of the LO and NLO contributions to the full NLO CEM calculation. The average center of mass rapidity, , shown on each panel is the approximate midpoint of our chosen rapidity interval in each case. The average of GeV is near the peak of the distributions. These values should not be thought of as having the most weight in the actual calculations which integrate over the rapidity interval for the distributions and all for the rapidity distributions. Indeed, since the rapidity distributions are steeply falling, the preponderance of the rate comes from the upper end of the range in each case. Thus the vertical lines represent an estimate of the lower bound on the range at the given value of .
The Pb kinematics emphasize high in the nucleus (top panels) and thus explores an range rarely probed, especially by gluon-dominated processes. It is partly in the ’EMC’ region of the range and also moves into the regime of ’Fermi motion’, see a discussion of how the various regions are parameterized by Eskola and collaborators in Refs. EKS981 ; EKS982 . Given the shortage of direct gluon-induced data in the global analyses, the gluon shadowing ratios are constrained by the momentum sum rule. The gluon shadowing ratios shown in the top half of Fig. 1 are plotted on a linear scale to highlight the large region. Here the scale dependence is very weak, illustrated by the similarities in the results for the two quarkonium scales shown, while the uncertainties in the nPDF extraction are the largest. AFTER@LHC measurements could help narrow this uncertainty range.
On the other hand, the Pb kinematics are in an region where quark-dominated processes, as in nDIS, are well measured and the uncertainties can be expected to be relatively small.
III Cold nuclear matter effects and quarkonium production rates
There are other possible cold matter effects on production in addition to that of shadowing: breakup of the quarkonium state due to inelastic interactions with nucleons (absorption) or produced hadrons (comovers) and energy loss in cold matter.
The quarkonium absorption cross section at midrapidity was seen to decrease with center-of-mass energy in Ref. Lourenco:2008sk , independent of whether shadowing effects were included or not. It was also seen that incorporating shadowing into the extraction of the absorption cross section required a larger effective cross section Lourenco:2008sk . Extrapolating from the results of Ref. Lourenco:2008sk to the energy range of AFTER@LHC, we can expect an effective absorption cross section of a few millibarns at midrapidity. Away from midrapidity, the effective absorption cross section was seen to rise at forward Feynman , Lourenco:2008sk , which could be attributed to energy loss in matter ArleoPeigne . When a similar analysis was extended to the RHIC collider geometry, the effective absorption cross section was also seen to increase in the backward region McGlinchey:2012bp . Such behavior could be attributed to the quarkonium state being fully formed inside the nucleus. The Pb kinematics of AFTER@LHC would be an ideal environment to study absorption in the target if other observables can also probe shadowing effects to disentangle the two.
The shadowing results shown here are obtained in the color evaporation model (CEM) Barger:1979js ; Barger:1980mg at next-to-leading order in the total cross section Gavai:1994in . In the CEM, the quarkonium production cross section is some fraction, , of all pairs below the threshold where is the lowest mass heavy-flavor hadron,
| (1) | |||||
where or and is the subprocess cross section. The normalization factor is fit to the forward (integrated over ) cross section data and the combined (S) state data at midrapidity. We use the code of Ref. MNRcode with the mass cut implemented.
The same values of the central charm quark mass and scale parameters are employed as those found for open charm, GeV, , and Nelson:2012bc . The normalization is obtained for the central set, . The calculations for the extent of the mass and scale uncertainties are multiplied by the same value of to obtain the extent of the uncertainty band Nelson:2012bc . These values reproduce the energy dependence of production from fixed-target to collider energies. The resulting rapidity and distributions also agree with the data from RHIC and the LHC at GeV and 7 TeV respectively Nelson:2012bc .
We calculate production in the same manner, with the central result obtained for Nelson_inprog . We have also found good agreement with the , and distributions from previous measurements Nelson_inprog . Unfortunately, the uncertainties from RHIC measurements are rather large and few data are available on the shape of the rapidity distributions.
To obtain the quarkonium distributions at low , intrinsic transverse momentum, , smearing for quarkonium is included in the initial-state parton densities SchulerV . Since the MNR code cancels divergences numerically, instead of slowing the calculations by adding more integrations, the kick is added in the final, rather than the initial, state MNRcode . The Gaussian function MLM1 , multiplies the parton distribution functions for both hadrons, assuming the and dependencies in the initial partons completely factorize. If factorization applies, it does not matter whether the dependence appears in the initial or final state if the kick is not too large. The effect of the intrinsic on the shape of the distribution can be expected to decrease as increases because the average of the also increases with energy. However, the value of may increase with . We can check the energy dependence of by the shape of the distributions at central and forward rapidity at RHIC. We find that GeV2 at GeV agrees well with the distributions Nelson:2012bc . All the calculations are NLO in the total cross section and assume that the intrinsic broadening is the same in as in Pb. While the broadening is expected to increase in collisions with nuclei as projectile, target or both, the agreement of the Pb ratio with the LHC data is better without any additional broadening RV_inprog . Therefore we do not change the value here.
III.1 and (1S) production in Pb collisions at GeV
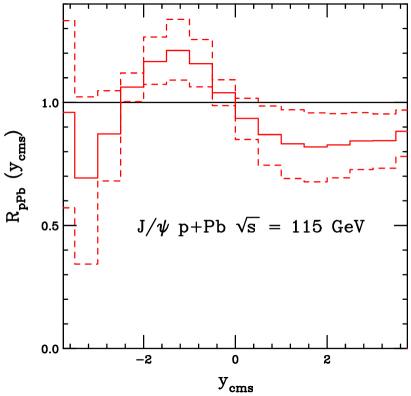
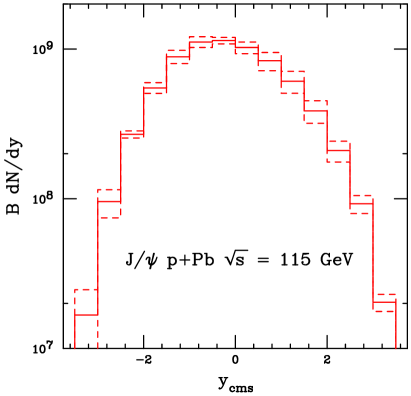
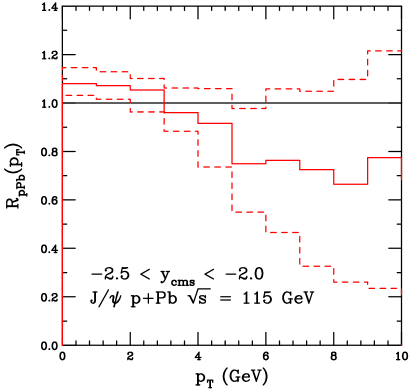
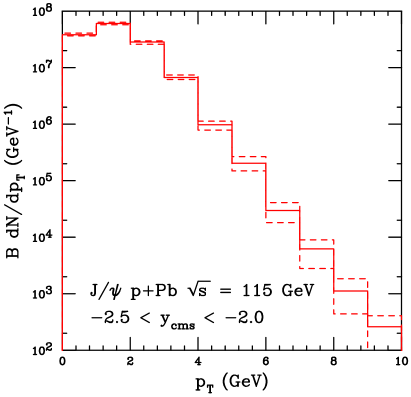
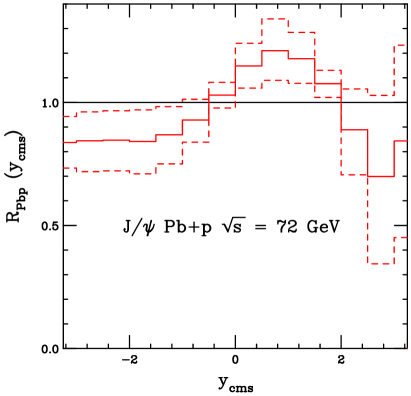
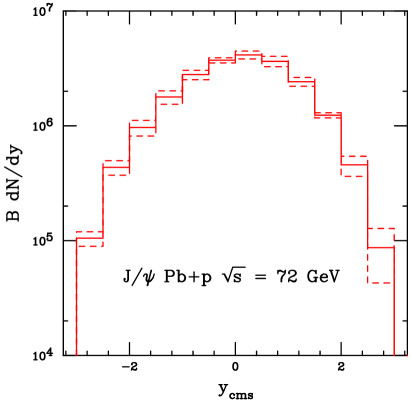
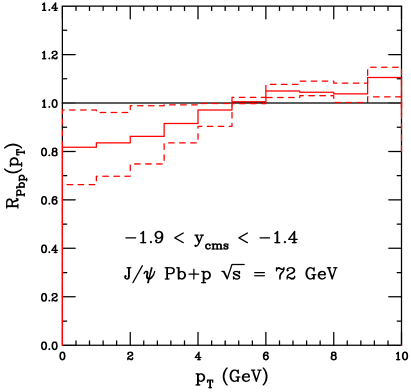
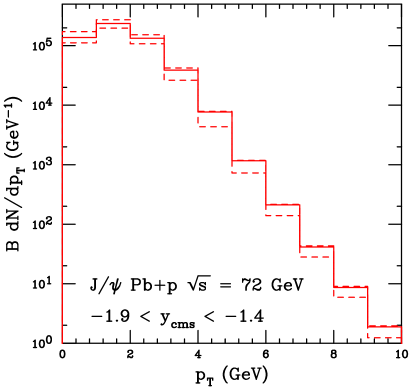
In this section, the results for and shadowing in Pb collisions at GeV are presented. Figure 2 shows the results for while Fig. 3 shows the results. In both cases, the left-hand side shows the ratios as a function of (top) and in the rapidity range (bottom). The rates to dileptons in the rapidity acceptance, assuming a lead target, are shown on the right-hand side of the figures.
In the kinematics of this configuration, the large in the nucleus puts the peak for Fermi motion at the most negative rapidities. (The full center-of-mass rapidity range for ’s produced at this energy is for the mass and scale parameters appropriate for the CEM calculation.) The EMC region is in the rapidity acceptance. There is a steep drop in as decreases from to , changing the central value of by % over the range. The decrease into the EMC region is more apparent as a function of where the region is expanded for GeV. The large uncertainty in this range, as emphasized in the upper plots of Fig. 1, is enhanced here.
The rates as a function of rapidity for and (1S) decays to lepton pairs are shown in Table 1. While the rates are shown for the entire rapidity range, the broad LHCb+ center of mass rapidity acceptance ends at . The rates are given in bins of with the value of at the center of the bin shown in Table 1. The rates include the branching ratios to lepton pairs.
The rates in Pb collisions are very high. The rate is in the chosen backward rapidity bin of , see the upper right panel of Fig. 2. The cross section is rather high since is above the region where the production cross section is still increasing steeply with . In addition, the production range in rapidity is fully within the AFTER@LHC acceptance.
Finally, even though the rates fall off quickly with , more than 100 events can be collected at GeV, see the lower right panel of Fig. 2 and the upper part of Table 2, likely enough to determine where lies within the EPS09 band.
| System | |||
|---|---|---|---|
| -3.75 | - | ||
| -3.25 | - | ||
| -2.75 | - | ||
| -2.25 | |||
| -1.75 | |||
| -1.25 | |||
| -0.75 | |||
| Pb | -0.25 | ||
| GeV | 0.25 | ||
| 0.75 | |||
| 1.25 | |||
| 1.75 | |||
| 2.25 | |||
| 2.75 | - | ||
| 3.25 | - | ||
| 3.75 | - | ||
| -3.25 | - | ||
| -2.75 | - | ||
| -2.25 | - | ||
| -1.75 | |||
| -1.25 | |||
| -0.75 | |||
| Pb | -0.25 | ||
| GeV | 0.25 | ||
| 0.75 | |||
| 1.25 | |||
| 1.75 | |||
| 2.25 | - | ||
| 2.75 | - | ||
| 3.25 | - |
| System | (GeV) | ||
|---|---|---|---|
| 0.5 | |||
| 1.5 | |||
| 2.5 | |||
| 3.5 | |||
| 4.5 | |||
| Pb | 5.5 | ||
| GeV | 6.5 | ||
| 7.5 | |||
| 8.5 | |||
| 9.5 | |||
| 10.5 | |||
| 0.5 | |||
| 1.5 | |||
| 2.5 | |||
| 3.5 | |||
| 4.5 | |||
| Pb | 5.5 | ||
| GeV | 6.5 | ||
| 7.5 | |||
| 8.5 | |||
| 9.5 | |||
| 10.5 |
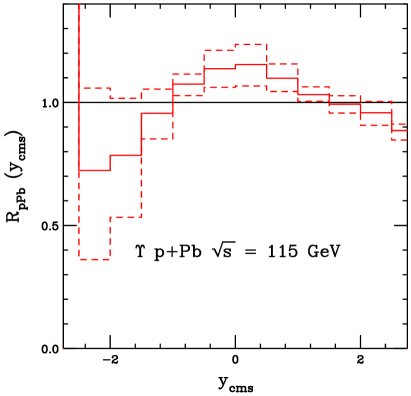
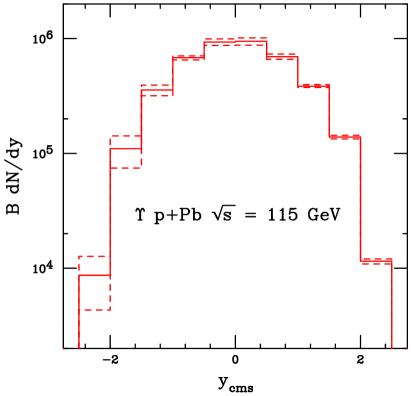
The (1S) rates, shown in Fig. 3, are significantly lower. At this energy, the production cross section is still increasing rapidly so that the the available phase space for production, in the CEM calculation. Thus the AFTER@LHC acceptance is just inside the lower end of this range and the rate for production in this region is relatively low. While the rates over all phase space can be quite high, with nearly events at midrapidity, there are less than events in the region , see Table 1 and the lower right panel of Fig. 3.
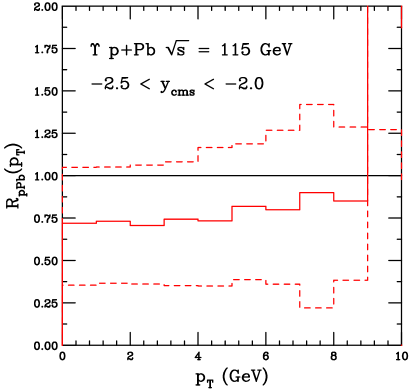
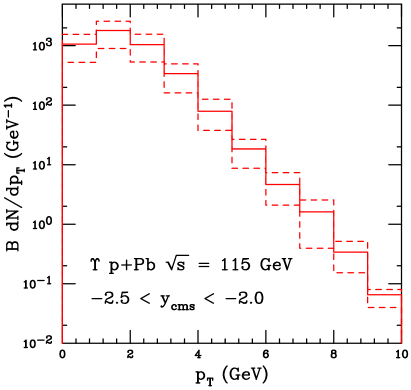
As shown in Table 2, the states that are produced in the AFTER@LHC acceptance are primarily at low , GeV. Indeed, there are fewer than 10 events per year for GeV so that any division into bins for GeV is unlikely to be feasible.
The AFTER@LHC rapidity bin is in the EMC region and touching on the Fermi motion region at , as seen on the upper left panel of Fig. 3. The dependent ratio reflects the large uncertainty of the EMC region and is almost independent of until GeV in the EPS09 parameterization where it increases sharply. The low rate will make it difficult to study this interesting region in detail.
III.2 and (1S) production in Pb+ collisions at GeV
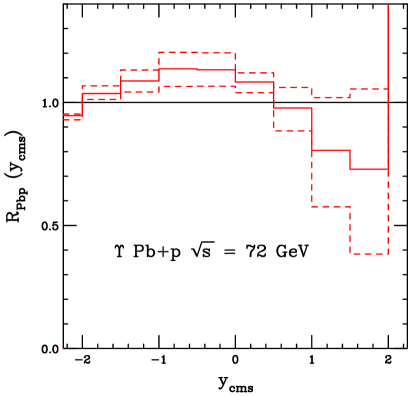
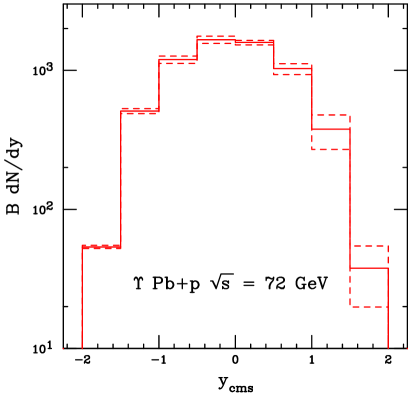
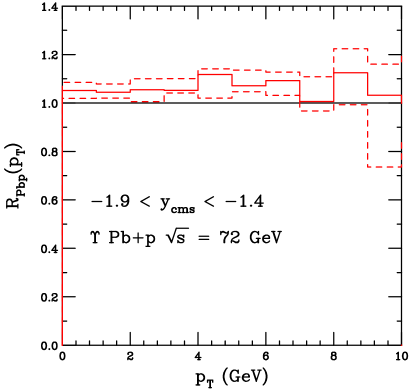
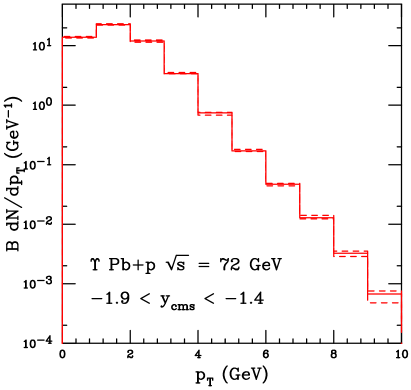
In this section, the results for and shadowing in Pb collisions at GeV are presented. Figure 4 shows the results for while Fig. 5 shows the results. In both cases, the left-hand side shows the ratios as a function of (top) and in the rapidity bin (bottom). The rates to dileptons in the rapidity acceptance, assuming a 1 m long liquid hydrogen target, are shown on the right-hand side of the figures and in the bottom parts of Tables 1 and 2. The lower cross sections at this reduced energy still result in rather high rates for the long liquid hydrogen target, at least at midrapidity.
In these kinematics, the rapidity bin now corresponds to the more typical fixed-target kinematics with the lead nucleus at lower . Here the ratio is reversed. The range for the is in the higher end of the shadowing region while the is just entering the antishadowing region, recall Fig. 1.
The antishadowing peak for in the upper left side of Fig. 4 is actually just at forward rapidity instead of in the region. (The full center-of-mass rapidity range for production at this energy is .) Within the chosen rapidity bin, the -dependent ratio has the largest uncertainty at low where there is still some shadowing. However, at GeV, the values move somewhat into the antishadowing region (lower left panel).
The rates for this system are still high, see the lower half of Table 1. Thanks to the length of the H2 target, for the lead beam the -integrated rates in this configuration are still on the order of in the AFTER@LHC acceptance. The -dependent rates show that the statistics become poor for the at GeV. The rates at this energy are helped somewhat since there is antishadowing for GeV while there is strong shadowing at GeV, see Fig. 2.
The situation with (1S) is similar, see Fig. 5 and Table 1. (The rapidity range for production is so that again the AFTER@LHC acceptance is on the edge of the range.) The shadowing (or antishadowing) effect is on the order of a few percent. While there are a few thousand in a year at midrapidity, the rate in the AFTER@LHC acceptance is rather low, under 100 per year, as shown in the lower part of the figure and in Table 2. Indeed, there is effectively no rate for the rate for GeV.
IV Conclusions
We have only presented a bare minimum of the rates for the breadth of quarkonium studies possible at AFTER@LHC. The fixed-target configuration, especially for long runs with the dedicated proton beam, allows detailed measurements with a range of nuclear targets. We have only shown the Pb results here because the larger nuclear mass number produces what is expected to be the maximum effect due to shadowing.
The large region available for nuclear targets in the AFTER@LHC kinematics with a proton beam has the unique capability to make unprecedented studies of this heretofore unexplored range. The AFTER@LHC measurements would bridge the gap between the dedicated fixed-target experiments in the range GeV and the d+Au and upcoming collider experiments at RHIC, albeit in an range never before studied.
In the AFTER@LHC configuration with a Pb beam, the rates are smaller, though still significant, and the more conventional range is probed.
Acknowledgments
This work was performed under the auspices of the U.S. Department of Energy by Lawrence Livermore National Laboratory under Contract DE-AC52-07NA27344. I also thank the Institute for Nuclear Theory at the University of Washington, where this work was initiated, for hospitality.
References
- (1) S. J. Brodsky, F. Fleuret, C. Hadjidakis and J. P. Lansberg, Phys. Rept. 522 (2013) 239.
- (2) R. Gavai, D. Kharzeev, H. Satz, G. A. Schuler, K. Sridhar and R. Vogt, Int. J. Mod. Phys. A 10 (1995) 3043.
- (3) K. J. Eskola, H. Paukkunen and C. A. Salgado, JHEP 0904 (2009) 065.
- (4) J. Pumplin, D. R. Stump, J. Huston, H. L. Lai, P. M. Nadolsky and W. K. Tung, JHEP 0207 (2002) 012; D. Stump, J. Huston, J. Pumplin, W. K. Tung, H. L. Lai, S. Kuhlmann and J. F. Owens, JHEP 0310(2003) 046.
- (5) R. E. Nelson, R. Vogt and A. D. Frawley, Phys. Rev. C 87 (2013) 014908.
- (6) R. E. Nelson, R. Vogt and A. D. Frawley, in preparation.
- (7) H. L. Lai, M. Guzzi, J. Huston, Z. Li, P. Nadolsky, J. Pumplin, C.-P. Yuan, Phys. Rev. D 82 (2010) 074024.
- (8) R. Vogt, in preparation.
- (9) M. Arneodo et al. [European Muon Collaboration], Phys. Lett. B 211 (1988) 493; J. Ashman et al. [European Muon Collaboration], Phys. Lett. B 202 (1988) 603.
- (10) L. W. Whitlow, E. M. Riordan, S. Dasu, S. Rock and A. Bodek, Phys. Lett. B 282, 475 (1992).
- (11) M. C. Abreu et al. [NA38 Collaboration], Phys. Lett. B 444 (1998) 516.
- (12) B. Alessandro et al. [NA50 Collaboration], Eur. Phys. J. C 33 (2004) 31.
- (13) M. J. Leitch et al. [E866 Collaboration], Phys. Rev. Lett. 84 (2000) 3256.
- (14) I. Abt et al. [HERA-B Collaboration], Phys. Lett. B 638 (2006) 407.
- (15) R. Vogt, Phys. Rev. C 61 (2000) 035203.
- (16) K. J. Eskola, V. J. Kolhinen and P. V. Ruuskanen, Nucl. Phys. B 535 (1998) 351.
- (17) K. J. Eskola, V. J. Kolhinen and C. A. Salgado, Eur. Phys. J. C 9 (1999) 61.
- (18) C. Lourenço, R. Vogt and H. Wöhri, JHEP 0902 (2009) 014.
- (19) F. Arleo and S. Peigné, JHEP 1303 (2013) 122; F. Arleo, R. Kolevatov, S. Peigné and M. Rustamova, JHEP 1305 (2013) 155.
- (20) D. C. McGlinchey, A. D. Frawley and R. Vogt, Phys. Rev. C 87 (2013) 054910.
- (21) V. D. Barger, W. Y. Keung and R. J. Phillips, Phys. Lett. B 91 (1980) 253.
- (22) V. D. Barger, W. Y. Keung and R. J. Phillips, Z. Phys. C 6 (1980) 169.
- (23) M. L. Mangano, P. Nason, and G. Ridolfi, Nucl. Phys. B 373 (1992) 295.
- (24) G. A. Schuler and R. Vogt, Phys. Lett. B 387 (1996) 181.
- (25) M. L. Mangano, P. Nason, and G. Ridolfi, Nucl. Phys. B 405 (1993) 507.