An ATCA survey of debris disks at 7 millimeters
Abstract
We present ATCA continuum observations at a wavelength of 6.8 mm of five debris disks: Pictoris, q1 Eridani, HD 107146, HD 181327, and HD 95086. These observations provide the detection at the longest wavelengths obtained to date for all these debris disks. By combining our 6.8 mm data with previous detections at shorter sub-millimeter/millimeter wavelengths we measure the long wavelength spectral index of these sources. We then use previous estimates for the temperature of the emitting dust to derive the spectral index of the dust emissivity. Under the assumption that all the detected flux comes from dust only, we constrain the slope of the solid size distribution, assumed to be a power-law. The values that we infer for the slope of the size distribution range between about 3.36 and 3.50. We compare our findings with the case of the Fomalhaut debris disk and use these results to test the predictions of collisional cascades of planetesimal belts.
Subject headings:
circumstellar matter — stars: individual (HD107146) — planets and satellites: formation — submillimeter: stars1. Introduction
Observations of debris disks made of cold dust around nearby stars provide crucial information to the process of planet formation (e.g. Zuckerman, 2001; Matthews et al., 2014). The dust grains observed in these systems are thought to be produced by collisions between km-sized planetesimals (comets and asteroids), leftovers of the planetary formation process (see Wyatt, 2008). The highly destructive mutual encounters between planetesimals which generate the observed dust are probably triggered by the dynamical interaction with one or more planets in the system (Mustill & Wyatt, 2009).
Because of their extremely faint emission, km-sized planetesimals cannot be directly observed outside the Solar System. However, information on their physical and dynamical properties can be extracted from the size distribution of the emitting smaller dust grains. Observations in the sub-millimeter/millimeter can quantify the departure of the spectrum from the Rayleigh-Jeans regime () which is due to a combination of temperature and emissivity effects. As the temperature of dust grains can be inferred from observations in the infrared, the frequency-dependence of the dust emissivity at sub-mm/mm can be estimated, and this is related to the size distribution of mm-sized dust grains present in a debris disk (Draine, 2006; Ricci et al., 2012; Gaspar et al., 2012). Observations at long wavelengths have the advantage of minimizing the departures from the Rayleigh-Jeans approximation as well as the effect of optical depth because of the lower dust emissivities (e.g. Testi et al., 2014).
This method can be used to test collisional models of debris disks which provide different predictions for the solid size distribution depending on the dynamical state (e.g. velocity dispersion, Pan & Schlichting, 2012) or physical conditions (e.g. tensile strength, Durda & Dermott, 1997; Gaspar et al., 2012) of the large colliding bodies. The reference model is the collisional cascade of large bodies at the steady state, which predicts a power-law solid size distribution () with exponent , as a result of the collective dynamical interaction of particles caused by inelastic collisions and fragmentation (Dohnanyi, 1969). This standard model assumes a single constant tensile strength111The tensile strength of a body is defined as the minimum energy per unit mass required to disrupt it catastrophically. and velocity dispersion for all bodies regardless of size. More recent numerical simulations and analytical calculations have relaxed these assumptions and derived steeper grain size distributions () in the case in which either the tensile strength or the velocity dispersion of the large bodies are steep functions of their size (Pan & Schlichting, 2012; Gaspar et al., 2012).
We present the results from observations with the Australia Telescope Compact Array222The Australia Telescope Compact Array is part of the Australia Telescope National Facility which is funded by the Commonwealth of Australia for operation as a National Facility managed by CSIRO. (ATCA) of five debris disks at 6.8 mm: Eri, HD 107146, HD 181327, HD 95086, Pic. In the case of Pic, the ATCA observations were already introduced in Wilson et al. (2011). We combine these data with previous observations at shorter wavelengths to estimate the -values of the slope of the size distribution for each debris disk in our sample, and compare our results with the predictions of the collisional cascade models.
In Section 2 we present the main properties of the debris disks in our sample. Sections 3 and 4 describe the ATCA observations and their results, respectively. Results on the slope of the solid size distribution are presented and discussed in Sections 5 and 6. Section 7 summarizes the main findings of this study.
2. The sample
In this section we present the main properties of the five debris disks in our sample. These sources were selected to be 1) at declinations lower than 20 degrees in order to be observable with the ATCA array, 2) relatively bright sources in the sub-mm, i.e. with a flux density at 0.85 mm greater than 30 mJy, and 3) relatively compact, i.e. with angular size lower than to maximize surface brightness sensitivity.
2.1. q1 Eri
q1 Eridani (HD 10647) is a F9 main sequence star at a distance of 17.4 pc. Its estimated age is Gyr (Moro-Martin et al., 2015; Bonfanti et al., 2015). q1 Eri hosts a planet which was discovered with the radial velocity technique at a distance of AU from the star (see Butler et al., 2006).
Evidence for a dusty belt has been obtained from observations in the infrared (Zuckerman & Song, 2004; Chen et al., 2006; Trilling et al., 2008) and sub-millimeter (Liseau et al., 2008). Recently, Moro-Martin et al. (2015) have fitted the disk Spectral Energy Distribution (SED) including far-IR fluxes with the Herschel Space Observatory. They inferred a dust temperature of K at a stellocentric distance of about 40 AU.
2.2. HD 107146
HD 107146 is a Solar-like G2 type star. At a distance of 27.5 pc and with an age of Myr, this is the brightest known debris disk at infrared wavelengths around a G-type star (Silverstone, 2000; Moor et al., 2006). The disk was spatially resolved both in scattered light with the Hubble Space Telescope (Ardila et al., 2004; Ertel et al., 2011; Schneider et al., 2014) and in dust thermal emission with sub-millimeter single dish (Williams et al., 2004) and interferometric observations (Corder et al., 2009; Hughes et al., 2011; Ricci et al., 2015).
Spitzer spectroscopic and photometric data revealed the presence of warm dust ( K) located AU from the star (Morales et al., 2011). A colder dust component extending between stellocentric radii of about 30 and 150 AU dominates the sub-mm emission (Ricci et al., 2015). Recent observations with the Atacama Large Millimeter Array (ALMA) show a decrease in the surface brightness of the disk at AU from the star, which could be due to dynamical interaction with a low-mass terrestrial planet in the system (Ricci et al., 2015; Kenyon & Bromley, 2015).
2.3. HD 181327
HD181327 is a F6-type star at a distance of pc (Zuckerman & Song, 2004; Casagrande et al., 2011). It is located in the Pic moving group with an age of 23 3 Myr (Mamajek & Bell, 2014).
In order to reproduce the emission in the infrared, Mittal et al. (2015) invoked a warm dust component at a stellocentric distance of AU (temperature of K), as well as a colder component with K further from the star. Schneider et al. (2006, 2014) presented spatially resolved observations of the debris disk in scattered light at optical and near-infrared wavelengths with the Hubble Space Telescope. These observations show that a relatively narrow ring at a distance of AU from the star accounts for most of the total flux from the disk.
2.4. HD 95086
HD 95086 is an A8-type member of the Lower Centaurus Crux Association at a distance of pc (de Zeeuw et al., 1999; van Leeuwen, 2007) and age of Myr. A planet with a mass of has been directly imaged at a projected distance of 56 AU from the star (Rameau et al., 2013).
The observed disk SED of HD 95086 is best described with two dust temperatures: a warm component at 175 K and a colder component at 55 K with an outer radius of AU (Su et al., 2015). The analysis of spatially resolved images in the far-infrared indicates the presence of dust grains at further distances, possibly a diffuse halo of small particles thrown into highly eccentric or hyperbolic orbits by stellar radiation pressure.
2.5. Pic
Pictoris (HD 39060) is an A6 type star at a distance of 19.4 pc and with an age of 23 3 Myr (Gray et al., 2006; van Leeuwen, 2007; Mamajek & Bell, 2014).
The star is surrounded by the first debris disk to be imaged in scattered light (Smith & Terrile, 1984). Subsequent observations have shown the existence of a massive planet at AU from the star (Lagrange et al., 2010), comets falling toward the star within a few AU (Vidal-Madjar et al., 1994), atomic gas extending out to 300 AU, sub-mm dust emission out to AU (Wilner et al., 2011), as well as a clear azimuthal asymmetry in the spatial distribution of molecular gas (Dent et al., 2014).
3. ATCA Observations and data reduction
ATCA observations of the 6.8 mm dust continuum toward the five disks in our sample were obtained using the Compact Array Broadband Backend (CABB) digital filter bank (Wilson et al., 2011).
Observations were carried out on September 14 2009 for Pic (see Wilson et al., 2011, for a presentation of these observations), and between July 27 and August 5 2012 for the other four disks. The ATCA array was in the H214 configuration for the observations of Pic (baselines between 82 and 247 m), and in the H75 configuration for the other observations (baselines between 31 and 89 m). The array comprises six 22m diameter antennas, but data from the stationary sixth antenna, located about 6 km from the others, was discarded because of the higher phase noise on the much longer baselines. To obtain the best sensitivity in the continuum the correlator was set to cover the full 4-GHz CABB effective bandwidth. The mean frequency of the observations is 44.0 GHz, corresponding to a wavelength of about 6.8 mm.
| Source | R.A. | Dec. | On-source time | Gain calibrator(s) |
|---|---|---|---|---|
| [minutes] | ||||
| q1 Eri | 01:42:29.32 | 53:44:27.0 | 488 | 0208-512 |
| HD 107146 | 12:19:06.50 | +16:32:53.9 | 490 | 1236+077 |
| HD 181327 | 19:22:58.94 | 54 32 17.0 | 721 | 1933-400, 1941-554 |
| HD 95086 | 10:57:03.02 | 68:40:02.5 | 712 | J1147-6753 |
| Pic | 05:47:17.09 | 51:03:59.4 | 680 | 0537-441 |
Table 1 summarizes the coordinates of each target, the on-source times and gain calibrators. We used 0537-441, 1253-055 and 1921-293 as bandpass calibrators, whereas Uranus, Neptune and 1934-638 were used to calibrate the absolute flux scale of the data. We adopt the typical value of for the uncertainty on the absolute flux scale for ATCA observations at this wavelength(e.g. Ubach et al., 2012). This uncertainty is in agreement with the variation of the flux for the gain calibrators as measured in different days during our observations.
The ATCA data were calibrated using the miriad software package. Imaging and deconvolution were performed with the standard miriad routines invert, clean and restore.
4. Results of the ATCA observations
Continuum emission from all the five disks was detected with our ATCA observations at 6.8 mm (Table 2). The achieved signal-to-noise ratios range between (HD95086) and (HD 181327).
As expected, the emission is spatially unresolved for the four disks observed in the H75 array configuration (q1 Eri, HD107146, HD181327, HD95086), as the angular resolution for these observations is significantly larger than the angular extent of those sources. For these four spatially unresolved disks, the flux density was extracted using the uvfit routine that fits the calibrated visibilities with a point-source model.
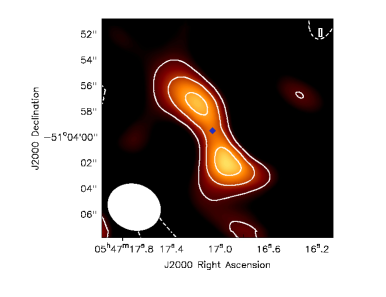
In the case of Pic, the higher angular resolution achieved with the H214 array configuration allowed us to spatially resolve the disk (Fig. 1). The disk is elongated along the northeast-southwest direction, as seen in all the previous maps for this source at shorter wavelengths. The map at 6.8 mm also shows higher surface brightness toward the southwest lobe of the disk, as previously seen at 0.87 mm (Dent et al., 2014) and 1.3 mm (Wilner et al., 2011) with better signal-to-noise. For this disk, the total flux density reported in Table 2 was obtained by integrating the surface brightness over the area showing emission at above the background level in the map.
| Source | Beam Size | Beam P. A.a | Flux density at 6.8mm | RMS noise | Total uncertainty of flux densityb |
|---|---|---|---|---|---|
| [degrees] | [Jy] | [Jy/beam] | [Jy] | ||
| q1 Eri | 278.4 | 92.6 | 13.8 | 16.6 | |
| HD 107146 | 0.1 | 166.0 | 19.0 | 25.2 | |
| HD 181327 | 277.4 | 145.0 | 12.6 | 19.2 | |
| HD 95086 | 284.9 | 61.9 | 14.6 | 15.9 | |
| Pic | 68.7 | 240.0c | 23.0 | 33.2 |
5. The slope of the solid size distribution
Models of collisional cascades for planetesimal belts predict size distributions which are well approximated by power-laws , typically with , and between blow-out grain sizes (typically of the order of m) and the sizes of the solids which initiate the cascade, i.e. km (e.g. Dohnanyi, 1969).
Under these conditions, Draine (2006) derived a relation between the spectral index of the dust emissivity (), the spectral index of small particles only (i.e. with sizes much smaller than the observing wavelengths), and the power-law index of the solid size distribution. This formula reads: .
Since the dust thermal emission in debris disks is optically thin, the flux density , where is the Planck function evaluated at the temperature of the dust in the disk. For debris disks around stars with spectral types of G and earlier, such as in our sample, the dust is usually warm enough () for the Planck function to be well approximated by the Rayleigh-Jeans form (). A more accurate approximation is obtained considering the Planck function as a power-law, with , and equal to 2 in the Rayleigh-Jeans regime.
The flux density of debris disks at sub-mm and mm wavelengths is a power-law in frequency (), and Draine’s formula can be written in terms of as:
| (1) |
(see Ricci et al., 2012).
For we consider a value of , consistent with observations of small dust grains in several diffuse interstellar clouds, molecular clouds, as well as with predictions for small grains with chemical compositions expected in protoplanetary disks (e.g., Draine, 2006; Testi et al., 2014, and references therein). Hence, by measuring the sub-mm/mm spectral index and by inferring from the dust temperature estimated for each disk, we can use Eq. 1 to infer the slope of the solid size distribution333Here we are implicitly assuming that all the emission observed at sub-mm/mm wavelengths comes from dust. The validity of this assumption will be discussed at the end of Section 6..
Table 3 lists the flux density of each disk at a sub-mm/mm wavelength reported in the literature which is combined with our ATCA flux density at 6.8 mm to measure ( ), the dust temperature , the spectral index of the Planck function ( ), and the slope of the solid size distribution as derived using Eq. 1. For HD 107146 and Pic we chose the accurate flux measurements extracted from published ALMA observations. For the other three disks for which ALMA observations have not been obtained yet, we chose flux measurements with Herschel ( Eri, HD 95086) and APEX (HD 181327), see references in Table 3. In the cases in which Herschel and APEX observations are both present, we have verified that the -values obtained using either one or the other flux density are consistent with each other at the level.
For Pic, the sub-mm/mm flux reported in the table was extracted from ALMA observations at 0.87 mm (Dent et al., 2014). Like our ATCA observations for the same source, also the ALMA observations were affected by spatial filtering of the emission on the largest scales. The shortest projected baselines of the ALMA have -distances of 17 k. In order to compare emission on the same spatial scales, we derived the emission including only visibilities associated to -distances of 17 k and larger from our ATCA dataset. We derived a value of 185 33.6 Jy (rms noise on the map is 28.0 Jy/beam). We used this value to derive the spectral index , and associated uncertainty, reported in Table 3.
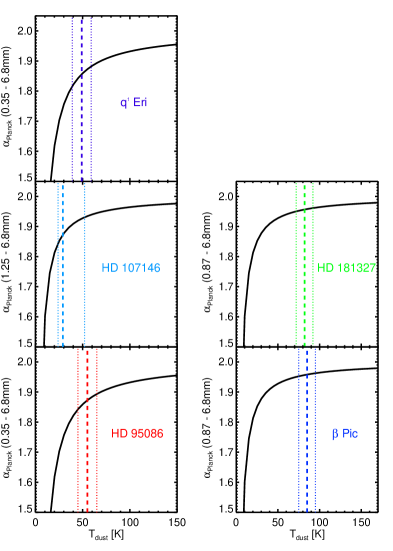
In all cases but HD 107146, the dust temperature was inferred from fitting of the SED at infrared and sub-mm wavelengths. A reasonable uncertainty of 10 K was considered to derive an uncertainty on . In the case of HD 107146, we considered the interval of temperatures for dust with size of mm at the stellocentric radii of AU, as estimated by Ricci et al. (2015). Note that this interval includes the estimate of K as derived through SED fitting by Williams et al. (2004). In this case, the range of dust temperatures considered here, i.e. 28 K, is broader than the range considered for the other disks, i.e. 20 K, because of the wider range of radial distances found for the unusually broad disk surrounding HD 107146 (Ricci et al., 2015). The dependence of on the dust temperature is shown for each disk in Fig. 2.
| Source | Sub-mm/mm wavelength | Flux density | Ref.a | Ref.a | ||||
|---|---|---|---|---|---|---|---|---|
| [mm] | [mJy] | [K] | ||||||
| q1 Eri | 0.35 | 179.9 14.6 | 1 | 2.55 0.07 | 49 10 | 6 | 1.86 | 3.38 0.07 |
| HD 107146 | 1.25 | 12.5 1.3 | 2 | 2.55 0.11 | 29 | 2 | 1.90 | 3.36 |
| HD 181327 | 0.87 | 51.7 6.2 | 3 | 2.86 0.09 | 82 10 | 7 | 1.96 0.01 | 3.50 0.07 |
| HD 95086 | 0.35 | 112 16 | 4 | 2.53 0.10 | 55 10 | 4 | 1.87 | 3.37 0.07 |
| Pic | 0.87 | 60 6b | 5 | 2.81 0.10 | 85 10 | 5 | 1.96 0.01 | 3.47 0.08 |
6. Discussion
In the previous Section we have estimated the slope of the solid size distribution for our five debris disks. Values range between 3.36 (HD 107146) and 3.50 (HD 181327) with uncertainties of 0.06 0.08. Using the same analysis described here, Ricci et al. (2012) obtained in the case of Fomalhaut444Note that the uncertainty on the value reported here is slightly different than the one reported in Ricci et al. (2012) because of a better treatment of the propagation of the uncertainties.. The -values derived for the different disks are consistent within the uncertainties, with a weighted mean . Note however that debris disks may in principle have different values for .
These values can be used to test predictions of models of collisional cascades. The typical benchmark model is the classical Dohnanyi (1969) prediction of for a collisional cascade at the steady-state as due to the collective dynamical interaction of particles caused by inelastic collisions and fragmentation. This model assumes that neither the velocity dispersion of bodies nor their tensile strength is a function of the size of the bodies.
Pan & Schlichting (2012) have extended the Dohnanyi (1969) treatment by assuming that the velocity dispersion and tensile strength vary with the size of the bodies as power-laws. They found self-consistent steady-state solutions when viscous stirring balances velocity damping. In these models, the predicted -value depends on what holds a single body together (gravity or tensile strength) and on the mechanism which is driving the damping, i.e. catastrophic collisions, collisions with equal-sized bodies or with the smallest bodies in the system. For solids with sizes mm, which are held together by tensile strength, the predicted values are , , in the cases of catastrophic collisions, collisions with equal-sized bodies and with the smallest bodies, respectively (Pan & Schlichting, 2012).
Gaspar et al. (2012) investigated the effects of model parameters on the evolution of the solid size distribution using numerical models of collision-dominated debris disks. Their calculations yield a quasi steady-state slope of , with a range between when considering large variations for their model parameters.
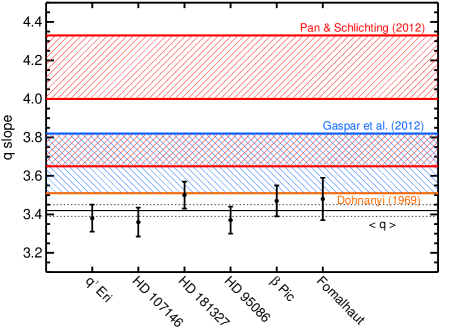
When comparing these theoretical predictions with the results of our analysis, the classic prediction of the Dohnanyi (1969) collisional cascade lies at from the weighted mean of the -values in our sample of disks (see Figure 3). The lowest values predicted by the Gaspar et al. (2012) models are very similar to the Dohnanyi (1969) prediction, and therefore in line with the results for our debris disks, although these are obtained only with very large scaling factors for the strength curve, i.e. erg/g (Benz & Asphaung, 1999).
Instead, the models by Pan & Schlichting (2012) predict values which are significantly larger than our results (Figure 3). This may imply that the condition of exact balance between viscous stirring and some damping mechanism, which is the key assumption in those models, is not met in real disks.
A possible way to alleviate the apparent discrepancy of these findings with the model predictions is that part of the emission detected at 6.8 mm may not come from dust. If this was the case, our estimates would underestimate the true spectral index of the dust emission and therefore the -value as well. For example, in the case of the AU Mic star, the emission seen by ALMA at 1.3 mm from the central regions of the debris disk can be explained by models of K plasma in an active stellar corona, which can also reproduce the strong X-ray flux from this source (Cranmer et al., 2013; MacGregor et al., 2013).
For HD 107146, which shows the lowest inferred -value among the debris disks in our sample, 65 of the measured flux at 6.8 mm would have to be produced by ionized gas to give a slope of the solid size distribution of , which would be more in line with the predictions of the Pan & Schlichting (2012) and Gaspar et al. (2012) models. However, the ALMA spatially resolved map for this disk at 1.25 mm does not show any hint for emission from the star location, as one would expect for emission from plasma in the stellar corona. The same can be argued for the spatially resolved ATCA maps at 6.8 mm for Fomalhaut (Ricci et al., 2012) and Pic (Figure 1), which do not show any strong emission from the stellar location.
For the disks which have not been yet spatially resolved at millimeter wavelengths, observations with higher angular resolution are needed to investigate possible ionized gas emission from the stellar corona. Also, observations at even longer wavelengths in the radio have the ability to disentangle the contribution of dust and ionized gas from the radio spectrum.
7. Summary
We have presented new ATCA observations for the continuum emission at 6.8 mm of five debris disks, i.e. Eri, HD 107146, HD 181327, HD 95086, Pic. By combining these new detections with those at shorter sub-mm/mm wavelengths we have measured the sub-mm/mm spectral index for these sources.
At these long wavelengths the dust emission is close to the Rayleigh-Jeans approximation, and we used previous estimates for the dust temperature in each of these systems to quantify the deviation from the Rayleigh-Jeans regime. We derived the spectral index of the dust emissivity (), and used a relation derived by Draine (2006) to infer the slope of the solid size distribution ().
The slopes we derived range between 3.36 and 3.50 with values consistent within the errorbars and a weighted mean . We compared these findings with the predictions of models of collisional cascades in debris disks. Models by Pan & Schlichting (2012), which assume a balance between viscous stirring and some damping mechanism, overpredict these estimates significantly. Numerical models by Gaspar et al. (2012) can predict values as low as , but only by invoking very large scaling factors for the strength curve ( erg/g). With a prediction of , the classical models of Dohnanyi (1969) appear to be the closest to reproduce our results. This may indicate that the variation of the solid velocity dispersions and/or collision parameters are weaker than previously thought.
References
- Ardila et al. (2004) Ardila, D. R., Golimowski, D. A., Krist, J. E., Clampin, M., Williams, J. P., Blakeslee, J. P., Ford, H. C., Hartig, G. F., & Illingworth, G. D. 2004, ApJ 617L, 147
- Benz & Asphaung (1999) Benz, W., & Asphaug, E. 1999, Icarus 214, 179
- Bonfanti et al. (2015) Bonfanti A., Ortolani S., Piotto G., & Nascimbeni V. 2015, A&A 575, 18
- Brandeker et al. (2004) Brandeker, A., Liseau, R., Olofsson, G., & Fridlund, M. 2004, A&A 413, 681
- Butler et al. (2006) Butler, R.P., Wright, J.T., Marcy, G.W. et al., 2006, ApJ 646, 505
- Casagrande et al. (2011) Casagrande, L., Schoenrich, R., Asplund, M., et al. 2011, A&A 530, 138
- Chen et al. (2006) Chen C.H., Sargent B.A., Bohac C. et al., 2006, ApJS 166, 351
- Corder et al. (2009) Corder, S., Carpenter, J. M., Sargent, A. I., Zauderer, B. A., Wright, M. C. H., White, S. M., Woody, D. P., Teuben, P., et al. 2009, ApJ 690L, 65
- Cranmer et al. (2013) Cranmer, S. R. Wilner, D. J. & MacGregor, M. A. 2013, ApJ 772, 149
- de Zeeuw et al. (1999) de Zeeuw, P. T., Hoogerwerf, R., de Bruijne, J. H. J., Brown, A. G. A., & Blaauw, A. 1999, AJ 117, 354
- Dent et al. (2014) Dent, W. R. F., Wyatt, M. C., Roberge, A., Augereau, J.-C., Casassus, S., Corder, S., Greaves, J. S., de Gregorio-Monsalvo, I., et al. 2014, Science 343, 1490
- Dent et al. (2000) Dent, W.R.F., Walker, H.J., Holland, W.S., & Greaves, J.S., 2000, MNRAS 314, 702
- Dohnanyi (1969) Dohnanyi, J. S. 1969, J. Geophys. Res. 74, 2531
- Draine (2006) Draine, B. T. 2006, ApJ, 636, 1114
- Durda & Dermott (1997) Durda D. D., & Dermott, S. F. 1997, Icarus 130, 140
- Eiroa et al. (2011) Eiroa, C., Marshall, J. P., Mora, A., Montesinos, B., Absil, O., Augereau, J. Ch., et al. 2011, A&A 555, 11
- Ertel et al. (2011) Ertel, S., Wolf, S., Metchev, S., Schneider, G., Carpenter, J. M., Meyer, M. R., Hillenbrand, L. A., & Silverstone, M. D. 2011, A&A 533, 132
- Gaspar et al. (2012) Gaspar, A., Psaltis, D., Rieke, G. H., & Ozel, F. 2012, ApJ 754, 74
- Gray et al. (2006) Gray, R. O., Corbally, C. J., Garrison, R. F., Mc Fadden, M. T., Bubar, E. J., McGahee, C. E., O’Donoghue, A. A., & Knox, E. R. 2006, AJ 132, 161
- Hughes et al. (2011) Hughes, A. M., Wilner, D. J., Andrews, S. M., Williams, J. P., Su, K. Y. L., Murray-Clay, R. A., & Qi, C. 2011, ApJ 740, 38
- Kenyon & Bromley (2015) Kenyon, S. J., & Bromley, B. C. 2015, ApJ 806, 42
- Lagrange et al. (2010) Lagrange, A.-M., Bonnefoy, M., Chauvin, G., Apai, D., Ehrenreich, D., Boccaletti, A., Gratadour, D., Rouan, D., Mouillet, D., Lacour, S., & Kasper, M. 2010, Science 329, 57
- Liseau et al. (2008) Liseau, R., Risacher, C., Brandeker, A., Eiroa, C., Fridlund, M., Nilsson, R., Olofsson, G., Pilbratt, G. L., & Thebault, P. 2008, A&A 480, 47
- MacGregor et al. (2013) MacGregor, M. A., Wilner, D. J., Rosenfeld, K. A., Andrews, S. M., Matthews, B., Hughes, A. M., Booth, M., et al. 2013, ApJ 762L, 21
- Mamajek & Bell (2014) Mamajek, E. E., & Bell, C. P. M. 2014, MNRAS 445, 2169
- Matthews et al. (2014) Matthews, B. C., Kennedy, G., Sibthorpe, B., Booth, M., Broekhoven-Fiene, H., Wyatt, M., Macintosh, B., & Marois, C. 2014, in Protostars & Planets VI, eds. H. Beuther, R. Klessen, C. Dullemond, & Th. Henning (Univ. Arizona Press: Tucson), in press, arXiv:1401.0743
- Mittal et al. (2015) Mittal, T., Chen, C. H., Jang-Condell, H., Manoj, P., Sargent, B. A., Watson, D. M., & Lisse, C. M. 2015, ApJ 798, 26
- Moor et al. (2006) Moor, A., Abraham, P., Derekas, A., Kiss, C., Kiss, L., Apai, D., Grady, C., & Henning, Th. 2006, ApJ 644, 525
- Morales et al. (2011) Morales, F. Y., Rieke, G. H., Werner, M. W., Bryden, G., Stapelfeldt, K. R., & Su, K. Y. L. 2011, ApJ 730, L29
- Moro-Martin et al. (2015) Moro-Martin, A., Marshall, J. P., Kennedy, G., Sibthorpe, B., Matthews, B. C., Eiroa, C., Wyatt, M. C., Lestrade, J.-F., Maldonado, J., Rodriguez, D., et al. 2015, ApJ 801, 143
- Mustill & Wyatt (2009) Mustill, A., & Wyatt, M. 2009, MNRAS 399, 1403
- Nilsson et al. (2009) Nilsson, R., Liseau, R., Brandeker, A., Olofsson, G., Risacher, C., Fridlund, M., & Pilbratt, G. 2009, A&A 508, 1057
- Pan & Schlichting (2012) Pan, M., & Schlichting, H. E. 2012, ApJ 747, 113
- Rameau et al. (2013) Rameau, J., Chauvin, G., Lagrange, A.-M., et al. 2013, ApJ 772, L15
- Ricci et al. (2015) Ricci, L., Carpenter, J. M., Fu, B., Hughes, A. M., Corder, S., & Isella, A. 2015, ApJ 798, 124
- Ricci et al. (2012) Ricci, L., Testi, L., Maddison, S. T., & Wilner, D. J. 2012, A&A 539L, 6
- Schneider et al. (2014) Schneider, G., Grady, C. A., Hines, D. C., Stark, C. C., Debes, J. H., Carson, J., Kuchner, M. J., Perrin, M. D., Weinberger, A. J., Wisniewski, J. P, et al. 2014, AJ 148, 59
- Schneider et al. (2006) Schneider, G., Silverstone, M. D., Hines, D. C., et al. 2006, ApJ 650, 414
- Silverstone (2000) Silverstone, M. D. 2000, Ph. D. Thesis, University of California, Los Angeles
- Smith & Terrile (1984) Smith, B.A., & Terrile, R.J. 1984, Science 226, 1421
- Su et al. (2015) Su, K. Y. L., Morrison, S., Malhotra, R., Smith, P. S., Balog, Z., R., & George H. 2015, ApJ 799, 146
- Testi et al. (2014) Testi, L., Birnstiel, T., Ricci, L., Andrews, S., Blum, J., Carpenter, J., Dominik, C., Isella, A., Natta, A., Williams, J., & Wilner, D. , 2014 in Protostars & Planets VI, eds. H. Beuther, R. Klessen, C. Dullemond, & Th. Henning (Univ. Arizona Press: Tucson), pag. 339
- Trilling et al. (2008) Trilling D.E., Bryden G., Beichman C.A., et al., 2008, ApJ 674, 1086
- Ubach et al. (2012) Ubach, C., Maddison, S. T., Wright, C. M., Wilner, D. J., Lommen, D. J. P., & Koribalski, B. 2012, MNRAS 425, 3137
- van Leeuwen (2007) van Leeuwen, F. 2007, A&A 474, 653
- Vidal-Madjar et al. (1994) Vidal-Madjar, A., Lagrange-Henri, A.-M., Feldman, P. D., Beust, H., Lissauer, J. J., Deleuil, M., Ferlet, R., Gry, C., Hobbs, L. M., et al. 1994, A&A 290, 245
- Williams et al. (2004) Williams, J. P., Najita, J., Liu, M. C., Bottinelli, S., Carpenter, J. M., Hillenbrand, L. A., Meyer, M, R., & Soderblom, D. R. 2004, ApJ 604, 414
- Wilner et al. (2011) Wilner, D. J., Andrews, S. M., & Hughes, A. M. 2011, ApJL 727, 42
- Wilson et al. (2011) Wilson, W. E., Ferris, R. H., Axtens, P., Brown, A., Davis, E., Hampson, G., Leach, M., Roberts, P., Saunders, S., Koribalski, B. S. et al. 2011, MNRAS 416, 832
- Wyatt (2008) Wyatt, M. C. 2008, ARA&A 46, 339
- Zuckerman & Song (2004) Zuckerman, B., & Song, I., 2004, ApJ 603, 738
- Zuckerman (2001) Zuckerman, B. 2001, ARA&A 39, 549