∎
∗present address: Department of Physics, COMSATS Institute of Information Technology, Islamabad 44000 Pakistan
Measurements of , , , and proton production in proton–carbon interactions at 31 GeV/ with the NA61/SHINE spectrometer at the CERN SPS
Abstract
Measurements of hadron production in p+C interactions at 31 GeV/ are performed using the NA61/SHINE spectrometer at the CERN SPS. The analysis is based on the full set of data collected in 2009 using a graphite target with a thickness of 4% of a nuclear interaction length. Inelastic and production cross sections as well as spectra of , , p, and are measured with high precision. These measurements are essential for improved calculations of the initial neutrino fluxes in the T2K long-baseline neutrino oscillation experiment in Japan. A comparison of the NA61/SHINE measurements with predictions of several hadroproduction models is presented.
Keywords:
proton-Carbon interaction, hadron productionpacs:
13.85.Lg,13.85.Hd,13.85.Ni1 Introduction
The NA61/SHINE (SPS Heavy Ion and Neutrino Experiment) at CERN pursues a rich physics programme in various fields of physics proposala ; add1 ; proposalb ; Status_Report_2008 . Hadron production measurements in p+C pion_paper ; kaon_paper and +C interactions are performed which are required to improve calculations of neutrino fluxes for the T2K/J-PARC T2K and Fermilab neutrino experiments USNA61 as well as for simulations of cosmic-ray air showers in the Pierre Auger and KASCADE experiments Auger ; KASCADE . The programme on strong interactions investigates p+p NA61_2009_pp_EPJC , p+Pb and nucleus-nucleus collisions at SPS energies, to study the onset of deconfinement and to search for the critical point of strongly interacting matter Status_Report_2014 ; Status_Report_2015 .
First measurements of and spectra in proton-carbon interactions at 31 GeV/ were already published by NA61/SHINE pion_paper ; kaon_paper and used for neutrino flux predictions for the T2K experiment T2K1stnue ; T2K1stnumu ; T2Kflux ; T2Knueapp ; T2Knumudisap ; T2Knueapp_obs ; T2Knumudisap_precise ; T2Knumucs ; Abe:2014nox ; Abe:2014agb at J-PARC. Yields of and were also published V0_2007 . All of those measurements were performed using the data collected during the NA61/SHINE pilot run in 2007. A detailed description of the experimental apparatus and analysis techniques can be found in Refs. NA61detector_paper ; pion_paper .
This article presents new NA61/SHINE measurements of charged pion, kaon and proton as well as of and spectra in p+C interactions at 31 GeV/, based on an eight times larger dataset collected in 2009, after the detector and readout upgrades. These results are important for achieving the future T2K physics goals T2Kfuture .
T2K – a long-baseline neutrino oscillation experiment from J-PARC in Tokai to Kamioka (Japan) T2K – aims to precisely measure appearance T2K1stnue ; T2Knueapp ; T2Knueapp_obs and disappearance T2K1stnumu ; T2Knumudisap ; T2Knumudisap_precise . The neutrino beam is generated by the J-PARC high intensity 30 GeV (kinetic energy) proton beam interacting in a 90 cm long graphite target to produce and mesons, which decay emitting neutrinos. Some of the forward-going hadrons, mostly protons, reinteract in the target and surrounding material. To study and constrain the reinteractions in the long target, a special set of data was taken by NA61/SHINE with a replica of the T2K target: the first study based on pilot data is presented in Ref. LTpaper , the analysis of the high-statistics 2009 dataset is finalized Alexis , while the analysis of the last 2010 dataset is still on-going.
The T2K neutrino beam T2Kflux is aimed towards a near detector complex, 280 m from the target, and towards the Super-Kamiokande (SK) far detector located 295 km away at off-axis from the hadron beam. Neutrino oscillations are probed by comparing the neutrino event rates and spectra measured in SK to predictions of a Monte-Carlo (MC) simulation based on flux calculations and near detector measurements. Until the NA61/SHINE data were available, these flux calculations were based on hadron production models tuned to sparse available data, resulting in systematic uncertainties which are large and difficult to evaluate. Direct measurements of particle production rates in p+C interactions allow for more precise and reliable estimates T2Kflux . Precise predictions of neutrino fluxes are also crucial for neutrino cross section measurements with the T2K near detector, see e.g. Refs. T2Knumucs ; Abe:2014nox ; Abe:2014agb .
For the first stage of the experiment, the T2K neutrino beamline was set up to focus positively charged hadrons (the so-called “positive” focusing), to produce a enhanced beam. While charged pions generate most of the low energy neutrinos, charged kaons generate the high energy tail of the T2K beam, and contribute substantially to the intrinsic component in the T2K beam. See Ref. T2Kflux for more details. An anti-neutrino enhanced beam can be produced by reversing the current direction in the focusing elements of the beamline in order to focus negatively charged particles (“negative” focusing).
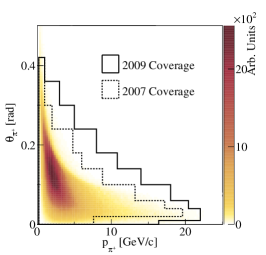
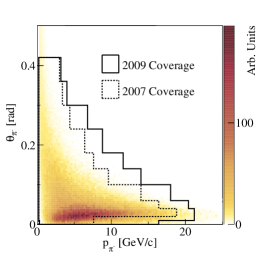
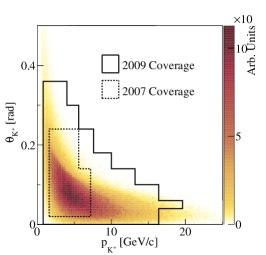
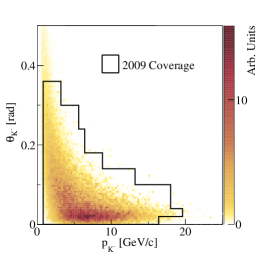
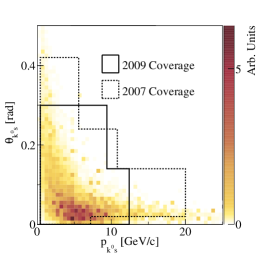
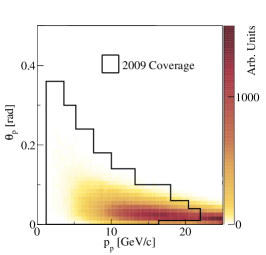
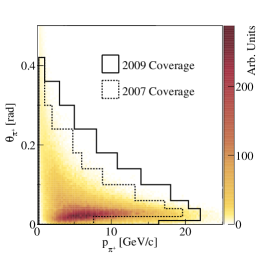
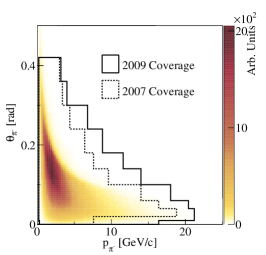
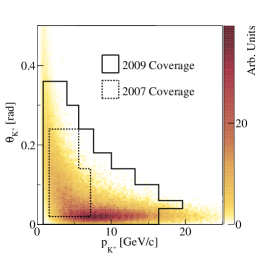
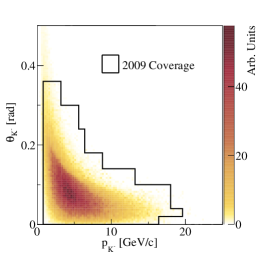
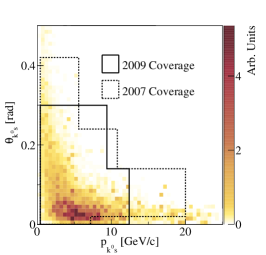
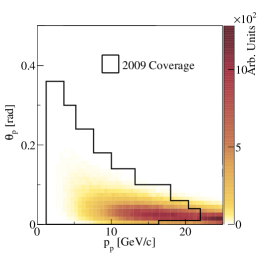
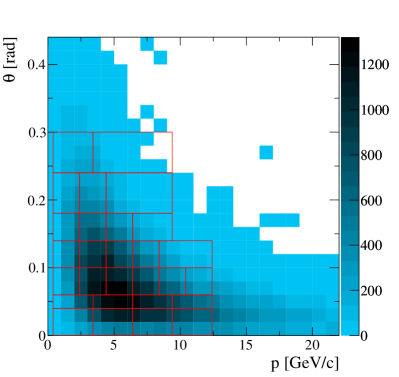
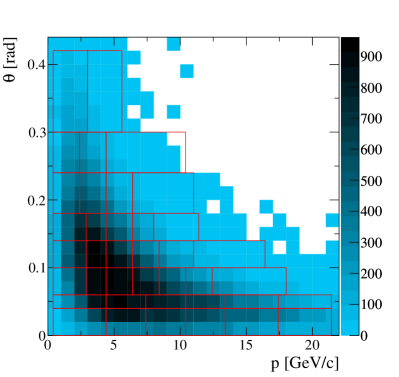
Positively and negatively charged pions and kaons whose daughter neutrinos pass through the SK detector constitute the kinematic region of interest, shown in Figs. 1 and 2 in the kinematic variables and – the momentum and polar angle of particles in the laboratory frame for “positive” and “negative” focusing, respectively. See Refs. pion_paper ; kaon_paper ; T2Kflux for additional information. The much higher statistics available in the 2009 data makes it possible to use finer binning (especially for charged kaons, and ) compared to previously published results pion_paper ; kaon_paper ; V0_2007 from the 2007 data. The improved statistics of the 2009 data also allows for the first measurements of negatively charged kaons within NA61/SHINE.
The NA61/SHINE results on hadron production are also extremely important for testing and improving existing hadron production models in an energy region which is not well constrained by measurements at present.
The paper is organized as follows: A brief description of the experimental setup, the collected data and their processing is presented in Section 2. Section 3 is devoted to the analysis technique used for the measurements of the inelastic and production cross sections in proton-carbon interactions at 31 GeV/ and presents the obtained results. A detailed description of the procedures used to obtain the differential inclusive spectra of hadrons is presented in Section 4. Results on spectra are reported in Section 5. A comparison of these results with the predictions of different hadron production models is discussed in Section 6. A summary and conclusions are given in Section 7.
2 The experimental setup, collected data and their processing
The NA61/SHINE apparatus is a wide-acceptance hadron spectrometer at the CERN SPS. A detailed description of the NA61/SHINE setup is presented in Ref. NA61detector_paper . Only parts relevant for the 2009 running period are briefly described here. The NA61/SHINE experiment has greatly profited from the long development of the CERN proton and ion sources, the accelerator chain, as well as the H2 beamline of the CERN North Area. Numerous components of the NA61/SHINE setup were inherited from its predecessors, in particular, the last one – the NA49 experiment NA49-NIM .
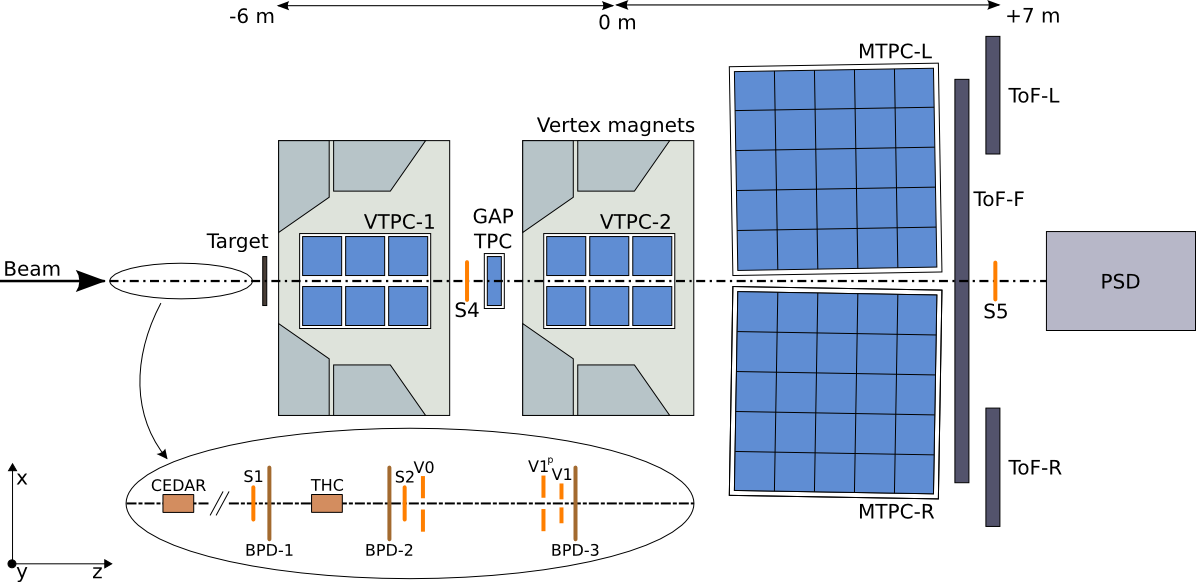
The detector is built arround five Time Projection Chambers (TPCs), as shown in Fig. 3. Two Vertex TPCs (VTPC-1 and VTPC-2) are placed in the magnetic field produced by two superconducting dipole magnets and two Main-TPCs (MTPC-L and MTPC-R) are located downstream symmetrically with respect to the beamline. An additional small TPC is placed between VTPC-1 and VTPC-2, covering the very-forward region, and is referred to as the GAP TPC (GTPC). The GTPC allows to extend the kinematic coverage at forward production angles compared to the previously published results from the 2007 pilot run.
The TPCs are filled with Ar:CO2 gas mixtures in proportions 90:10 for the VTPCs and the GTPC, and 95:5 for the MTPCs.
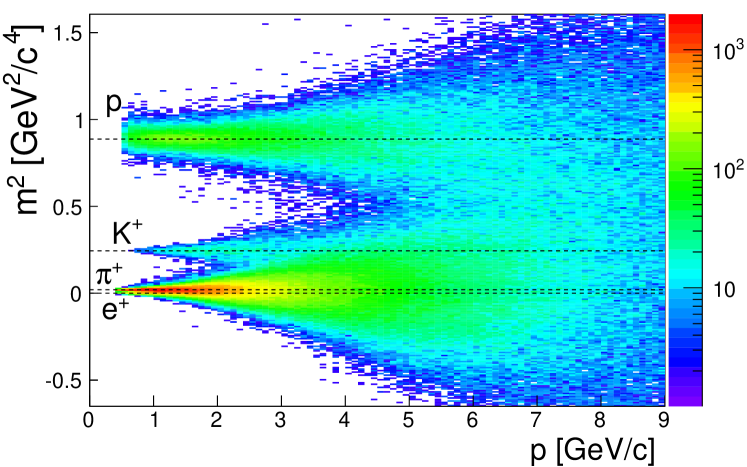
In the forward region, the experimental setup is complemented by a time-of-flight (ToF-F) detector array horizontally segmented into 80 scintillator bars, read out at both ends by photomultipliers NA61detector_paper . Before the 2009 run, the ToF-F detector was upgraded with additional modules placed on both sides of the beam in order to extend the acceptance for the analysis described here. The intrinsic time resolution of each scintillator is about 110 ps NA61detector_paper . The particle identification capabilities of the ToF-F are illustrated in Fig. 4.
For the study presented here the magnetic field of the dipole magnets was set to a bending power of 1.14 Tm. This leads to a momentum resolution in the track reconstruction of about (GeV/)-1 for long tracks reaching the ToF-F.
Two scintillation counters, S1 and S2, provide the beam definition, together with the three veto counters V0, V1 and V1p, which define the beam upstream of the target. The S1 counter provides also the start time for all counters. The beam particles are identified by a CEDAR CEDAR and a threshold Cherenkov (THC) counter. The selection of beam protons (the beam trigger, ) is then defined by the coincidence . The interaction trigger is given by a beam proton and the absence of a signal in S4, a scintillation counter, with a 2 cm diameter, placed between the VTPC-1 and VTPC-2 detectors along the beam trajectory at about 3.7 m from the target, see Fig. 3. Almost all beam protons that interact in the target do not reach S4. The interaction and beam triggers are run simultaneously. The beam trigger events were recorded with a frequency by a factor of about 10 lower than the frequency of interaction trigger events.
The incoming beam particle trajectories are precisely measured by a set of three Beam Position Detectors (BPDs), placed along the beamline upstream of the target, as shown in the insert in Fig. 3. These detectors are cm2 proportional chambers operated with an Ar:CO2 (85:15) gas mixture. Each BPD measures the position of the beam particle in the plane transverse to the beam direction with a resolution of m (see Ref. NA61detector_paper for more details).
The same target was used in 2007 and 2009 – an isotropic graphite sample with a thickness along the beam axis of 2 cm, equivalent to about 4% of a nuclear interaction length, . During the data taking the target was placed 80 cm upstream of the VTPC-1.
TPC readout and data acquisition (DAQ) system upgrades were performed before the 2009 run. To utilize the new DAQ capability, a much higher intensity beam was used during the 2009 data taking compared to the 2007 running period. To cope with the high beam intensity in 2009 the passing times of individual beam particles before and after the event were recorded. These are later used in the analysis to study and remove possible pileup effects.
Reconstruction and calibration algorithms applied to the 2007 data are summarized in Ref. pion_paper . Similar calibration procedures were applied to the 2009 data resulting in good data quality suitable for the analysis (see e.g. Ref. NA61_2009_pp_EPJC ).
| beam | target | year | triggers | status of the NA61/SHINE analysis | usage in the T2K beam MC |
|---|---|---|---|---|---|
| thin target | 2007 | 0.7 | published: pion_paper , kaon_paper , , V0_2007 | has already been used T2Kflux | |
| protons | 2 cm () | 2009 | 5.4 | , , p, , (this article) | currently being used |
| at 31 GeV/ | T2K replica | 2007 | 0.2 | published: LTpaper | method developed |
| target | 2009 | 2.8 | analysis being finalized Alexis | to be integrated | |
| 90 cm () | 2010 | analysis currently on-going | — |
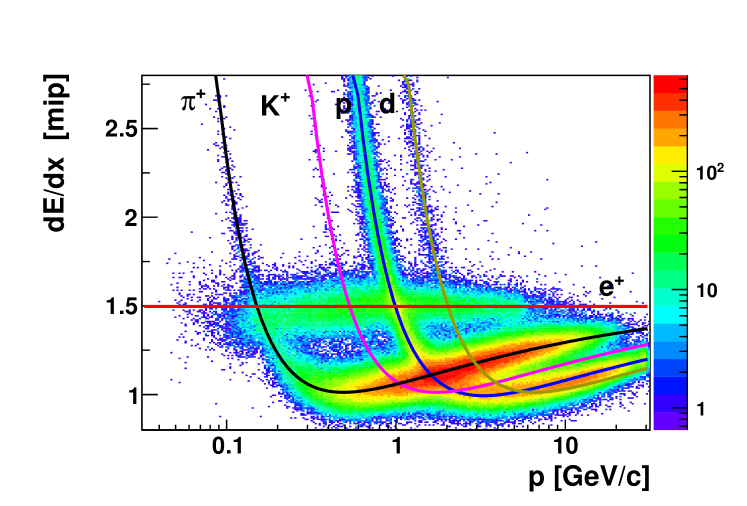
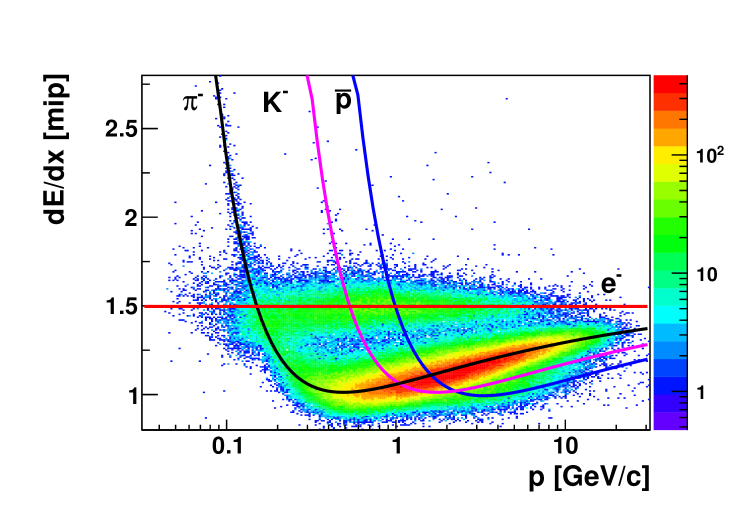
Measurements of the specific energy loss of charged particles by ionisation in the TPC gas are used for their identification. The of a particle is calculated as the 50% truncated mean of the charges of the clusters (points) on the track traversing the TPCs. The calibrated distributions as a function of particle momentum for positively and negatively charged particles are presented in Fig. 5. The Bethe-Bloch (BB) parametrization of the mean energy loss, scaled to the experimental data (see Section 4.5), is shown by the curves for positrons (electrons), pions, kaons, (anti)protons, and deuterons. The typical achieved resolution is about 4%.
Simulation of the NA61/SHINE detector response, used to correct the raw data, is described in Ref. pion_paper and additional details can be found in Ref. Nicolas .
The particle spectra analysis described in Section 4 is based on reconstructed events with the target inserted (I) and reconstructed events with the target removed (R) collected during the 2009 data-taking period with a beam rate of about 100 kHz, much higher than in 2007 (15 kHz). Only events for which a beam track is properly reconstructed are selected for analysis.
A summary of the NA61/SHINE data collected for T2K is presented in Table 1.
3 Inelastic and production cross section measurements
This section discusses the procedures used to obtain the inelastic and production cross section for p+C interactions at 31 GeV/ and presents the results. The inelastic cross section is defined as the difference between the total cross section and the coherent elastic cross section (see e.g. Bobchenko ):
| (1) |
Thus it comprises every reaction which occurs with desintegration of the carbon nucleus.
The production processes are defined as those in which new hadrons are produced. Thus the production cross section is the difference between and the quasi-elastic cross section where the incoming proton scatters off an individual nucleon which, in turn, is ejected from the carbon nucleus:
| (2) |
Since many improvements were made to the trigger logic and a much higher beam rate was used during the 2009 data taking compared to the 2007 run (see Section 2) the normalization analysis of the 2009 data Davide differs from the one used for the 2007 data pion_paper ; claudia .
3.1 Interaction trigger cross section
The simultaneous use of the beam and interaction triggers allows a direct determination of the interaction trigger probability, :
| (3) |
where is the number of events which satisfy the beam trigger condition and is the number of events which satisfy both the beam trigger and interaction trigger conditions. The interaction trigger probability was measured for the target inserted, , and target removed, , configurations. Table 2 summarizes the number of beam and interaction trigger events before and after the event selection.
| Target inserted | Target removed | |
|---|---|---|
| N() before cuts | 577894 | 257430 |
| N() before cuts | 39644 | 3705 |
| N() after cuts | 331735 | 145682 |
| N() after cuts | 20578 | 1110 |
The interaction probability in the carbon target was calculated as follows:
| (4) |
is used to obtain the interaction trigger cross section from the formula:
| (5) |
where is Avogadro’s number and , and are the density, atomic mass and effective length of the target, respectively. The effective target length accounts for the exponential beam attenuation and can be computed according to
| (6) |
where the absorption length is:
| (7) |
3.2 Event selection
An event selection was applied to improve the rejection of out-of-target interactions. The following two quality cuts based on the measurements of the beam position and the beam proton passage times were imposed:
-
(i)
Requirement to have both the and positions of the beam particle measured by all three BPDs. This selection is referred to later on as the standard BPD selection.
-
(ii)
Rejection of events in which one or more additional beam particles are detected in the time window s before the triggering beam particle. This avoids pileup in the BPDs due the long signal shaping time.
After applying these cuts the amount of out-of-target interactions decreased by about 45% (see Table 2).
3.3 Study of systematic uncertainty on
The first component of systematic uncertainty was evaluated by varying the event selection criteria described in the previous subsection. It amounts to 1.0 mb.
Elastic scattering of the beam along the beamline was considered as a systematic bias. However, the fraction of events for which the beam extrapolation falls outside of the carbon target and that pass all the event selections, was evaluated and found to be negligible.
Another source of potential systematic uncertainty relates to pileup in the trigger system. The trigger logic has a time resolution of about 9 ns. If a pileup particle arrives within this time window it can not be distinguished from the one which caused the trigger. The measured and corrected unbiased interaction trigger probabilities are related as:
| (9) |
where is the probability that a pile-up beam is within the trigger logic time window. This probability was found to be %, thus the correction to is negligible and no corresponding systematic uncertainty was assigned.
The beam composition at 31 GeV/, measured with the CEDAR and the THC, is 84% pions, 14% protons and about 2% kaons. The proton component of the beam was selected by requiring respectively the coincidence and the anti-coincidence of the CEDAR and THC counters (see Section 2). In order to check the purity of the identified proton beam, the beam was deflected into the TPCs with the maximum magnetic field (9 Tm) and its composition was determined using the energy loss measurements in the TPCs. The fraction of misidentified particles in the proton beam was found to be lower than 0.2% and was considered negligible.
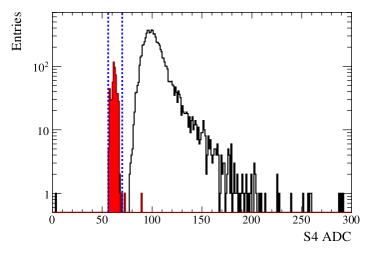
The efficiency of the interaction trigger was estimated using the ADC information from the S4 scintillator counter. The ADC signal of S4 can be distorted if pileup beam particles are close in time to the triggering beam. To avoid this effect all the events with at least one pileup beam particle within s around the triggering beam particle were rejected. In Fig. 6 the distribution of the ADC signal is shown for a sample of events tagged by the beam trigger . If a beam proton does not interact in the target, and thus hits S4, the ADC counts will be larger than 70. If both the beam and interaction trigger conditions are satisfied , the ADC signal corresponds to the pedestal and will be distributed between 56 and 70 counts (). The efficiency of the S4 counter as a part of the trigger is defined as the ratio between the number of ADC counts in the interval for events and the total number of ADC counts in the interval for events. The measured ratio is . This estimate of the S4 efficiency was cross-checked using the GTPC. Beam track segments reconstructed in the GTPC were extrapolated to the position of S4. The fraction of the number of extrapolations hitting S4 and also satisfying provides another estimate of the efficiency of S4. Both results were found to be in agreement. Thus a possible bias caused by inefficiency of S4 is considered negligible.
3.4 Results on
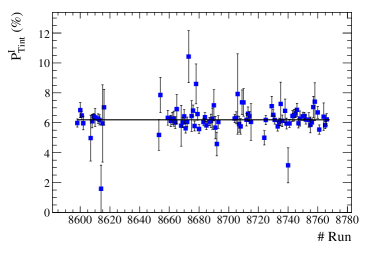
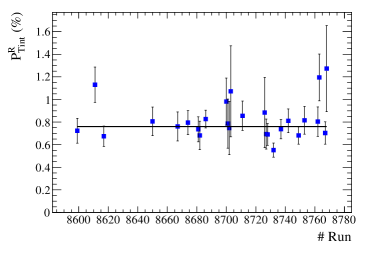
The interaction trigger probabilities for both the target inserted and target removed samples are time independent, as shown in Fig. 7. The mean values of trigger probabilities were found to be and . Insertion into the Eq. (4) gives the interaction trigger probability . Finally, the corresponding trigger cross section is:
| (10) |
where “stat” is the statistical uncertainty and “det” is the detector systematic uncertainty. This measurement of is more precise than the result obtained with the 2007 data: mb pion_paper . The detector systematic uncertainty of 2009 is significantly smaller. It is a consequence of the fact that in 2009 the beam triggers were recorded by DAQ simultaneously with physics triggers. Thus the same selection cuts (see Section 3.2) could be applied to all triggers. In contrast, during the 2007 run the beam information was recorded by scalers which were not read out by the main DAQ. As a consequence, event-by-event quality selection was not possible claudia . Instead, special runs were taken with the beam trigger to estimate biases. It had to be assumed that the effect of the selection was stable over the whole data taking period. On the other hand, the statistical uncertainty on from the 2009 data (see Eq. (10)) is slightly larger because of the smaller number of recorded triggers.
The fraction of out-of-target interaction background in the sample of the target inserted events is
| (11) |
The uncertainty of is larger for the 2009 than the 2007 data because of a larger statistical uncertainty of .
3.5 Results on inelastic and production cross section
Using Eqs. (1) and (2) one can calculate the inelastic and production cross sections by representing them in the following way:
| (12) | |||
| (13) | |||
| (14) | |||
| (15) |
where , , and are the fractions of elastic, quasi-elastic, inelastic and production events, respectively, in which all charged particles miss the S4 counter and which are therefore accepted as interactions by the trigger. The values of and are the contributions of elastic and quasi-elastic interactions to which have to be subtracted to obtain and . The values of and depend upon the efficiency of for selecting inelastic and production events. In order to take into account the correlations between , and , , estimates of systematic uncertainties are based on those for and .
This method differs from the one used in the analysis of the 2007 data pion_paper ; claudia . Here the simulation (see below) is basically only required to extract the magnitudes of the fractions . For the absolute values of and one can use the results of experimental measurements, if available. In addition, in the approach used for the 2007 data the simulated values of inelastic and production cross sections were part of the corrections of and . This is not the case for the method applied in the present analysis.
The corrections to as well as the corresponding uncertainties were estimated with GEANT4.9.5 GEANT4 ; GEANT4bis using the FTF_BIC physics list (see Section 6 for more detailed comparisons of the spectra measurements reported in this paper with the GEANT4 physics lists), except for the elastic cross section, for which large uncertainties were found in the GEANT4 simulation111For significant differences were found between various releases of GEANT4 – 4.9.5, 4.9.6 and 4.10 – for different physics lists. The obtained values of were in the range from 78 mb to 88 mb.. Since the total elastic cross section decreases in good approximation linearly with proton beam momentum in the range 20-70 GeV/, the measurements performed by Bellettini et al. at 21.5 GeV/ Bellettini and Schiz et al. at 70 GeV/ Schiz were used to estimate the elastic cross section at 31 GeV/ beam momentum. The elastic cross section measured by Bellettini et al. is
Schiz et al. reported the measured differential cross section as a function of the momentum transfer with a parametrization. The total elastic cross section can be obtained by integrating the differential cross section over the whole range of momentum transfer and is equal to:
The corresponding elastic cross section at the NA61/SHINE momentum was obtained by linear interpolation between these two measurements:
The range covers the interval mb. The deviations from the extremes of the interval and the nominal value of estimated with GEANT4 are taken into account as a model systematic uncertainty.
The values for the elastic and quasi-elastic cross section, estimated with GEANT4, are (see Ref. Laura_PhD for more details):
The fractions estimated to be accepted by the interaction trigger are:
where “det” is the detector systematic uncertainty obtained by performing the simulation for different positions and sizes of S4, taking also into account the beam divergence measured from the data. The uncertainty “mod” resulting from the choice of physics model was calculated as the largest difference between the contributions estimated for with different GEANT4 physics models (FTFP_BERT, QBBC and QGSP_BERT, as well as FTF_BIC physics list) and from measured data for as described above.
Inserting these values of the elastic and quasi-elastic cross sections, and of the fractions accepted by the trigger into Eqs. (12) and (13), one obtains the final results:
| (16) | |||
| (17) |
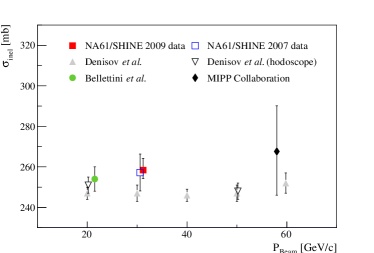
where “stat” is the statistical uncertainty, “det” is the total detector systematic uncertainty and “mod” is the uncertainty caused by the choice of physics model. The total uncertainty of is mb, which is significantly smaller than that of the NA61/SHINE result obtained from the 2007 data. The dominant uncertainty comes from the choice of physics model used to derive the production cross section from the trigger cross section.
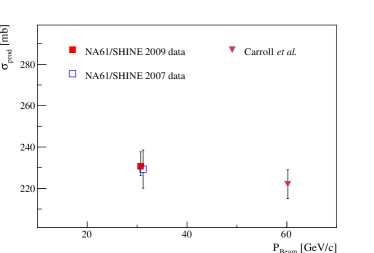
The new NA61/SHINE results on inelastic and production cross section agree, in general, with the previously published measurements as shown in Fig. 8. A possible tension with measurements by Denisov et al. Denisov , which are assigned a rather small systematic uncertainty of 1%, could be due to different experimental techniques used to extract . As discussed in Ref. Bobchenko , various approaches to define and measure could lead to differences of up to 8 mb for proton-carbon interactions.
4 Spectra analysis techniques and uncertainties
This section presents analysis techniques developed for the measurements of the differential inclusive spectra of hadrons. Details are shown on data selection and binning, on particle identification (PID) methods as well as on the calculation of correction factors and the estimation of systematic uncertainties.
The data analysis procedure consists of the following steps:
-
(i)
application of event and track selection criteria,
-
(ii)
determination of spectra of hadrons using the selected events and tracks,
-
(iii)
evaluation of corrections to the spectra based on experimental data and simulations,
-
(iv)
calculation of the corrected spectra.
Corrections for the following biases were evaluated and applied:
-
(i)
geometrical acceptance,
-
(ii)
reconstruction efficiency,
-
(iii)
contribution of off-target interactions,
-
(iv)
contribution of other (misidentified) particles,
-
(v)
feed-down from decays of neutral strange particles,
-
(vi)
analysis-specific effects (e.g. ToF-F efficiency, PID, and contamination, etc.).
All these steps are described in the following subsections for each of the employed identification technique separately.
The NA61/SHINE measurements refer to hadrons (denoted as primary hadrons) produced in p+C interactions at 31 GeV/c and in the electromagnetic decays of produced hadrons (e.g. from decay). Contributions from products of weak decays and secondary interactions are corrected for.
4.1 Event and track selection
Events recorded with the “interaction” () trigger were required to have a well-reconstructed incoming beam trajectory (the standard BPD selection).
Several criteria were applied to select well-measured tracks in the TPCs in order to ensure high reconstruction efficiency as well as to reduce the contamination of tracks from secondary interactions:
-
(i)
track momentum fit at the interaction vertex should have converged,
-
(ii)
the total number of reconstructed points on the track should be greater than ,
-
(iii)
at least reconstructed points in the three TPCs were used for momentum measurement (VTPC-1,
VTPC-2 and GTPC), -
(iv)
distance of closest approach of the fitted track to the interaction point (impact parameter) smaller than () in the horizontal (vertical) plane.
A summary of cut values used with the different identification techniques described in the following sections, is given in Table 3.
The adopted binning scheme is chosen based on the available statistics and the kinematic phase-space of interest for T2K. The highest limit is analysis-dependent. The polar angular region down to is covered.
| Identification method | ||||
|---|---|---|---|---|
| 20 | – | 4 cm | 2 cm | |
| - | 30 | 6 | 4 cm | 4 cm |
| 30 | 12 | 4 cm | 4 cm | |
| 30 | 12 | 4 cm | 4 cm |
4.2 Derivation of spectra
The raw number of hadron candidates has to be corrected for various effects such as the loss of particles due to selection cuts, reconstruction inefficiencies and acceptance. In each of the bins, the correction factor was computed from a GEANT3 based detector simulation using the Venus4.12 model as primary event generator and applying the same event and track selections as for the data (for description see Ref. pion_paper ):
| (18) |
The numerator corrects for the loss of candidates of particle type , where is the number of true particles generated in a specific bin and is the number of candidates extracted from the reconstructed tracks in the simulation. The denominator accounts for the events lost due to the trigger bias with the number of generated and the number of accepted inelastic events. The corrected number of hadron candidates was then obtained from the raw number by:
| (19) |
The procedures presented in Sections 4.3 – 4.6 below were used to analyze events with the carbon target inserted (I) as well as with the carbon target removed (R). The corresponding corrected numbers of particles in bins are denoted as and , where stands for the particle type (e.g. ). Note that the same event and track selection criteria as well as the same corrections discussed in the previous sections were used in the analysis of events with the target inserted and removed. The latter events allow to correct the measurements for the contribution of out-of-target interactions.
The double differential inclusive cross section was calculated from the formula:
| (20) |
where
- (i)
-
(ii)
and are the numbers of events with the target inserted and removed, respectively, selected for the analysis (see Subsection 4.1),
-
(iii)
() is the bin size in momentum (polar angle), and
-
(iv)
is the ratio of the interaction probabilities for operation with the target removed and inserted as given in Eq. (11).
The overall uncertainty on the inclusive cross section due to the normalization procedure amounts to 1%.
The particle spectra normalized to the mean particle multiplicity in production interactions was calculated as
| (21) |
where is the cross section for production processes given in Eq. (17).
The normalization uncertainty on the multiplicity spectra is .
The statistical uncertainty of the measured spectra receives contributions from the finite statistics of both the data and the simulated events used to obtain the correction factors. The dominant contribution is the uncertainty of the data which was calculated assuming a Poisson probability distribution for the number of entries in a bin. The simulation statistics was about ten times higher than the data statistics, thus the uncertainty of the corrections is neglected for all bins.
The systematic uncertainty of the measured spectra was calculated taking into account various contributions discussed in detail in the following sections separately for each identification technique.
4.3 analysis
Understanding the neutral strange particle
(here stands for and ) production in
p+C interactions at 31 GeV/ is of interest for T2K for two reasons.
First, it allows to decrease the systematic uncertainties
on measurements of charged
pions and protons, since a data-based feed-down correction can be used.
Second, measurements of production improve
the knowledge of the and fluxes
coming from the three-body
decays.
The following decay channels were studied:
| (22) | ||||
| (23) |
Fits to the invariant mass distributions of candidates were used to extract measured numbers of and decays in momentum and polar angle bins. These numbers were corrected for acceptance and other experimental biases using simulated events.
4.3.1 Event and track selection for the analysis
The track and candidate selections can be separated into three categories: event and track quality selections, topological selections aimed at finding -type candidates, and, finally, kinematic selections to separate and candidates.
The standard quality selections for events and tracks were applied (see Section 4.1).
The topological criteria require that a fitted secondary vertex, located downstream of the interaction, is built out of two tracks with opposite electric charges. Moreover, the distance of closest approach between the daughter tracks and the secondary vertex had to be smaller than 0.5 cm. The same quality and topological criteria were applied for selecting and candidates.
In order to extract the candidates, the following kinematic cuts were applied to the selected candidates:
-
(i)
The transverse momentum of the daughter tracks relative to the momentum must be greater than 0.03 GeV/ in order to remove converted photons,
-
(ii)
The cosine of the angle between the momentum of the candidate and the momentum of the daughter in the center of mass must be smaller than 0.76. This cut allows the rejection of most of the candidates for which the distribution of computed under the hypothesis is concentrated in the region 0.8,
-
(iii)
The candidates must have an invariant mass for the hypothesis within the range of GeV/,
-
(iv)
The reconstructed proper decay length should be greater than a quarter of the mean proper decay length PDG of mesons ( cm).
The kinematic cuts used to extract the candidates are the following:
-
(i)
Transverse momentum of the daughter tracks must be greater than 0.03 GeV/,
-
(ii)
The candidate must have an invariant mass for the hypothesis within the range of GeV/,
-
(iii)
The reconstructed proper decay length should be greater than a quarter of the mean proper decay length PDG of hyperons ( cm).
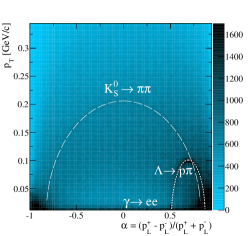
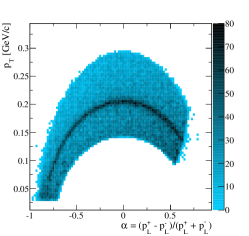
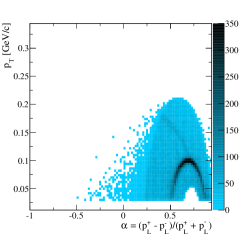
Figure 9 shows the Podolanski-Armenteros PAplots plots once the event and topological selections, as well as all and kinematic cuts have been applied. One can see that this set of cuts allows an efficient selection of the desired candidates.
The measured proper decay length distributions corrected for all experimental biases222The numbers of and as well as the correction factores were obtained in bins of proper decay length. are shown in Fig. 10 for both and . The fitted mean proper decay lengths are in reasonable agreement with the PDG values PDG .
4.3.2 Binning, fitting, corrections
The selected candidates are binned in phase space. Due to detector acceptance and reconstruction efficiency, the momentum range of reconstructed charged particles starts from 0.4 GeV/. For the analysis, 28 bins are used, whereas the candidates are divided into 39 bins. The choice of the binning scheme is driven by the available statistics.
A fit of the invariant mass distribution was performed in each of these bins. The shape of the and signal was parametrised by a sum of two Gaussians
| (24) |
where stands for the reconstructed invariant mass and subscripts and refer to the wide and narrow Gaussian, respectively. The parameter describes the fraction contributed by each Gaussian. In order to reduce the statistical uncertainty on the fitted signal, which is closely related to the number of free parameters, and were fixed. Also, the central position of the Gaussians was fixed to the well-known PDG value, .
For the analysis the background shape was modeled by an exponential function, while a 3rd order Chebyshev function was used in the analysis.
The binning scheme and an example of a fit in one bin is presented in Figs. 11 and 12 for and , respectively.
The same analysis procedure was applied to simulated events, for which the Venus4.12 Venus1 ; Venus2 model was used as the primary event generator. The fitted numbers of and in the data were then corrected as described in Section 4.2 taking also into account decay channels that cannot be reconstructed with the detector.
The number of candidates from interactions in the material surrounding the target was estimated by analysing the special runs taken with the target removed. After applying the same selections as used for the target inserted data a negligible number of candidates remained.
4.3.3 Systematic uncertainties of the analysis
The contributions from five sources of systematic uncertainties associated with this analysis were studied adopting the same procedure in all cases. Namely, the relative difference between the standard analysis and the one in which the respective source was varied was taken as an estimate of the systematic uncertainty. The following contributions were considered:
-
(i)
Correction factors: The dependence of the correction factors on the primary event generator was tested by performing two other simulations with the same statistics, based on Fluka2011 Fluka_CERN ; Fluka ; Fluka_new and Epos1.99 EPOS as generators for primary interactions. The systematic uncertainty associated with this source is from 7% to 10% for both and .
-
(ii)
Fitting procedure: Several alternative fitting functions were tested on the invariant mass distributions: a bifurcated Gaussian for the peak signal and a 3rd order Chebyshev polynomial or a 4th order polynomial function for the background for and , respectively. The contribution to the systematic uncertainty associated with this source is up to 12% (7%) for ().
-
(iii)
Reconstruction algorithm: Two different primary interaction vertex reconstruction algorithms were used, either fitting all three coordinates or fixing the z-coordinate to the survey position. The uncertainty connected to the algorithm is from 5% to 8% for both analyses.
-
(iv)
Quality cuts: All quality cuts were varied independently within a range given in Ref. Laura_PhD and the uncertainty connected to this source was found to reach up to 10% (5%) for ().
-
(v)
Kinematic cuts: As for the previous source of uncertainty, all cuts were varied and the resulting uncertainty is up to 10% (7%) for ().
The uncertainty estimates of items (iv) and (v) are strongly correlated since the same datasets and analysis techniques were used. Hence, only the maximum deviation due to these cut variations was taken into account. The total systematic error was taken as the sum of all contributions added in quadrature.
Comparison of the final corrected and spectra to the 2007 measurements V0_2007 shows that the results are compatible within the attributed uncertainties.
4.4 The - analysis method
Depending on the momentum range and charged particle species different particle identification (PID) techniques need to be applied. The method described in this section utilizes the measurements of the specific energy loss in the TPCs and the measurements of the time-of-flight () by the time-of-flight ToF-F detector. The energy loss information can be used in the full momentum range of NA61/SHINE. The ToF-F detector, which is installed about 13 m downstream of the target (see Fig. 3), contributes to particle identification up to 8 GeV/. The distribution of , the square of the mass calculated from the ToF-F measurement and the fitted track parameters, is shown for positively charged particles as a function of momentum in Fig. 4.
Simultaneous use of these two sources of PID information is particularly important in the momentum range from 1 to 4 GeV/ where the bands of charged hadrons cross over (see Fig. 5). Thus the measurement alone would not be enough to identify particles with sufficient precision and is especially important to resolve this ambiguity.
The combined tof- analysis technique was employed to determine yields of , K± and protons in the momentum region above 1 GeV/. For lower momenta the -only approach (see Section 4.5 below) provides better statistical precision. The spectra of can also be obtained precisely with the so-called analysis technique (see Section 4.6 below).
The standard event and track selection procedures common to all charged hadron analyses are described in Section 4.1. The following additional cuts were applied in the tof- analysis:
-
(i)
exclusion of kinematic regions where the spectrometer acceptance changes rapidly and a small mismatch in the simulation can have a large effect on the corrected hadron spectra. Basically, these are regions where the reconstruction capability is limited by the ToF-F acceptance, by the magnet aperture or by the presence of uninstrumented regions in the VTPCs. To exclude these regions a cut on the hadron azimuthal angle was applied. Since the spectrometer acceptance drops quickly with increase of the polar angle of the particle, typical cut intervals for at low and high were and , respectively.
-
(ii)
the track must have an associated ToF-F hit. Since particles can decay or interact before reaching the detector, the position of the last reconstructed TPC cluster of a track should be reasonably close to the ToF-F wall, thus a cut m was applied to all tracks. This requirement is especially important for ( m) many of which decay before reaching ToF-F. Pions have a higher chance to reach the ToF-F ( m) also due to their lower mass and thus larger Lorentz factor. Moreover a muon produced in the decay of a pion follows the parent pion trajectory. Such a topology is in general reconstructed as a single track.
Having ToF-F slabs oriented vertically, the position of a hit is measured only in the direction. The precision is determined by the width of the scintillator slab producing the signal. A ToF-F hit is associated with a track if the trajectory can be extrapolated to the pertaining slab.
Another important reason for using the ToF-F information is the time tag which it provides and which ensures that all associated tracks originated from the triggered event. The ToF-F time resolution of 110 ps NA61detector_paper guarantees an unambiguous discrimination against tracks from out-of-time events for the used beam rate of 100 kHz (one beam particle on average each s).
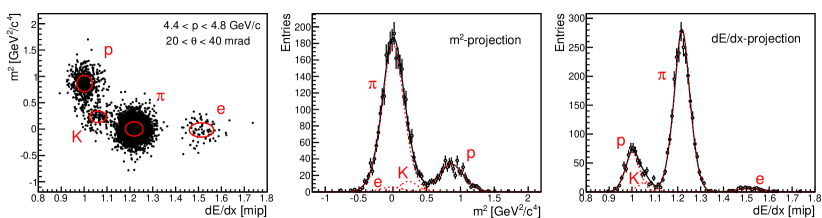
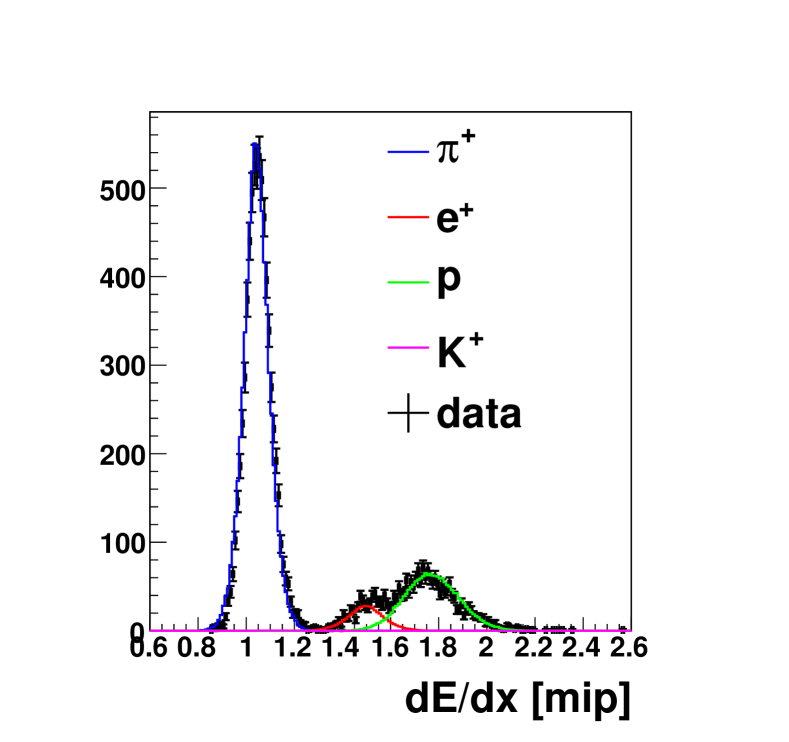
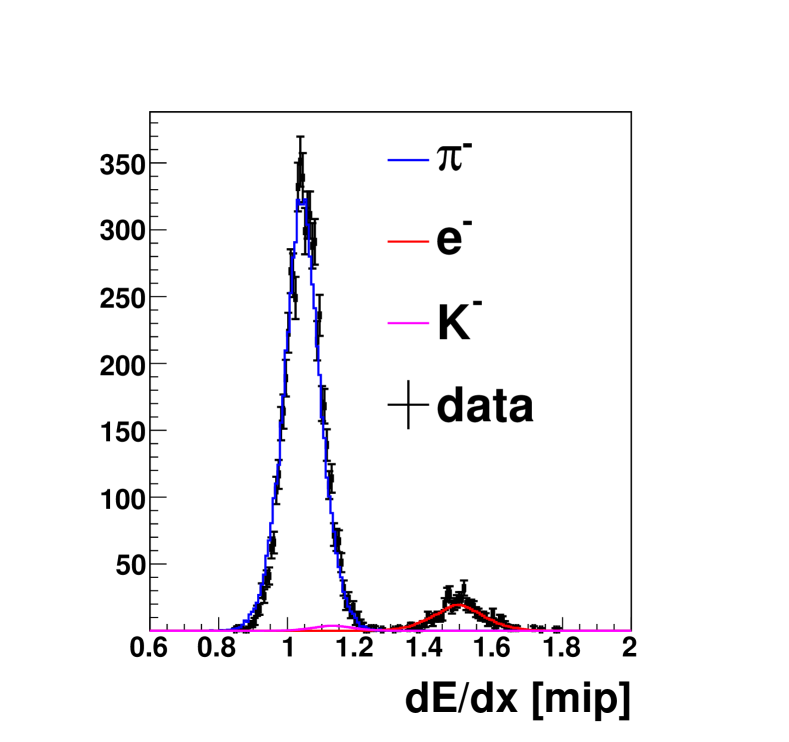
The - analysis was performed separately for positively and negatively charged particles following the procedure described in detail in Refs. pion_paper ; kaon_paper ; Sebastien . A two-dimensional histogram of versus was filled for every bin. An example of such a distribution is shown in Fig. 13. In this distribution particles of different types form regions which are parametrized by a product of two one-dimensional Gaussian functions in and , respectively. The binned maximum likelihood method is applied to fit the distribution with 20 parameters (4 particle types 5 parameters of the Gaussians). Depending on the momentum range and particle species, some of these parameters were fixed or constrained. In particular, this is important for which are difficult to separate from protons in the projected distributions at higher momenta where the information can no longer provide PID. Therefore, the mean position of kaons was fixed and the width of the peak was constrained from above by using information from pions and protons.
As a result of the fit one obtained raw yields of particles (, , , p, ) in bins of which were then corrected using the NA61/SHINE simulation chain with the Venus4.12 Venus1 ; Venus2 model for primary interactions and a GEANT3-based part for tracking the produced particles through the detector.
4.4.1 Feed-down corrections and re-weighting
Hadrons which were not produced in the primary interaction can amount to a significant fraction of the selected track sample. Thus a special effort was undertaken to evaluate and subtract this contribution. Hereafter this correction will be referred to as feed-down.
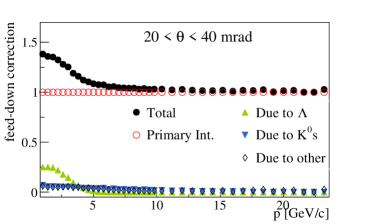
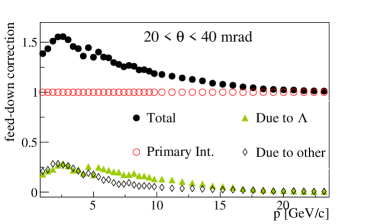
According to the simulation with the Venus4.12 model as the primary event generator, the correction reaches 12% for , 40% for and up to 60% for protons at low polar angles and small momenta. For kaons it is not significant (). Figure 14 shows the feed-down correction for and protons as a function of momentum for one of the bins. Decomposition of the correction reveals that the main contribution comes from -hyperon decays:
For mesons these decays are responsible for about of the non-primary contribution at GeV/. For protons, they amount to about for the whole momentum range. The measurements of spectra described in Section 4.3 can be used to improve the precision of the correction. Therefore the feed-down contribution of is calculated separately from the feed-down correction due to other weak decays.
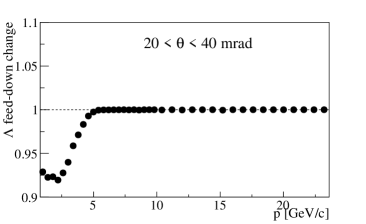
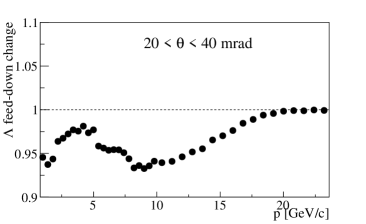
Technically the feed-down correction based on data was evaluated by weighting the Venus4.12 generated spectra of to agree with the measurements. The resulting change of the and proton spectra is shown in Fig. 15. Thus rescaling of the spectra reduces the feed-down in spectra by a maximum of 8% at GeV/. For protons the reduction was found in most of the momentum range with a maximum at GeV/.
The reweighting of the Venus4.12 spectra based on the NA61/SHINE measurements impacts the corrected charged pion spectra by less than 2%. This refinement of the correction was neglected in the results presented here.
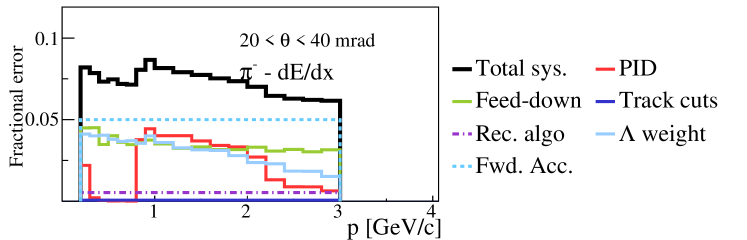
4.4.2 Systematic uncertainties of the - analysis
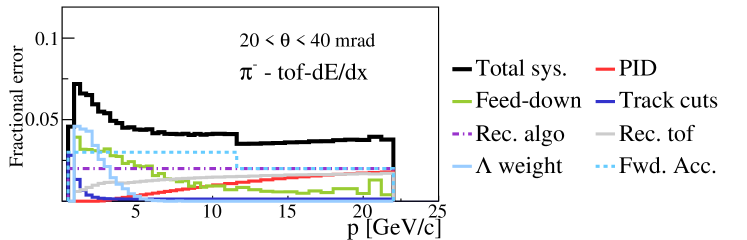
Systematic uncertainties of the hadron spectra were estimated by varying track selection and identification criteria as well as the parameters used to calculate the corrections. The following sources of systematic uncertainties were considered:
-
(i)
PID (). A Gaussian function is used to parametrize the distribution at a fixed value of momentum. The width of the distribution decreases with increasing number of TPC clusters used to determine the value of a track. Having in one bin tracks with different number of clusters would cause a deviation from the single-Gaussian shape. The contribution of this effect to the uncertainty of the fitted number of particles of a certain species was estimated by performing an alternative fit by a sum of two Gaussians.
At low momenta the ToF-F resolution ensures an unambiguous particle identification, thus small deviations of the distribution from a single Gaussian in general are not important. A deviation has a significant effect only for momenta above 3 GeV/. For pions it steadily increases up to 2% at GeV/. However for kaons, the uncertainty is an order of magnitude larger: up to 20% for at high momenta.
-
(ii)
Hadron loss. To ensure a high quality match of tracks and ToF-F hits the last point of a track should be within 1.6 m from the ToF-F wall ( m). This implies that a track segment is reconstructed in the MTPC-L or MTPC-R detectors. Possible imperfections in the description of the spectrometer can introduce a difference in the acceptance and reconstruction efficiency (merging track segments between VTPC-2 and MTPC-L/R) between simulation and real data which can be important for the reconstruction of long tracks. To check how sensitive the results are to the cut, it was relaxed down to m for pions and m for kaons. The difference in the resulting final spectra was assigned as the systematic uncertainty. It reaches up to 2% at 1 GeV/ and drops quickly with increasing momentum.
-
(iii)
Reconstruction efficiency. To estimate the uncertainty of the reconstruction efficiency the following track selection criteria were varied: the minimum number of points measured on the track, the azimuthal angle and the impact parameter cuts. Also results were compared which were obtained with two independent track topologies, different algorithms for merging track segments from different TPCs into global tracks, and with two different algorithms for the primary vertex reconstruction. It was found that the influence of such changes is small compared to the statistical uncertainties. The corresponding systematic uncertainty was estimated to be 2%.
-
(iv)
Forward acceptance. As stated in Section 2, the GTPC detector was used for the first time in the reconstruction algorithms within NA61/SHINE. The GTPC increases the number of reconstructed tracks mainly for smaller angles, mrad, and thus allows finer momentum binning in the forward region mrad. The estimate of the systematic uncertainty in the forward region is based on the comparison of results obtained with and without the GTPC included in the reconstruction algorithms and by varying the required number of GTPC clusters in the analysis. The latter takes into account inefficiencies of the GTPC electronic readout which were not included in the simulations. The difference of spectra obtained with and without using the GTPC information in the reconstruction was found to be 4% up to mrad and about 3% for mrad. The variation of the required number of GTPC clusters between 4 and 6 resulted in changes of up to 4% for mrad and up to 2% for mrad for tracks with momentum GeV/. In this region the majority of tracks do not traverse the VTPC-1/2 detectors and thus the reconstruction of the track segment in the magnetic field totally relies on the GTPC.
-
(v)
ToF-F reconstruction. The ToF-F reconstruction efficiency was estimated using a sample of events with very strict selection requiring no incoming beam particle within a s time window around the triggered interaction. The inefficiency was found to vary from 4% in the central region to a fraction of a percent in the ToF-F slabs far away from the beamline. This variation correlates with the higher particle density in the near-to-beam region where several particles can hit a single slab, thus contributing to inefficiency. A value of 50% of the inefficiency correction was assigned as a conservative limit to this source of systematic uncertainty.
-
(vi)
Secondary interactions and non- feed-down corrections. As in the case of the (Section 4.5) and (Section 4.6) approaches, the important contribution to the systematic uncertainty at low momenta comes from the uncertainty of the simulation-based correction for secondary interactions and weak decays of strange particles (excluding hyperons). Following arguments described in Ref. pion_paper an uncertainty of 30% of the correction value was assigned for both of these sources.
-
(vii)
feed-down correction. The correction for the feed-down to pions and protons originating from decays was calculated separately based on measured spectra (see Section 4.4.1). The uncertainty assigned to this correction was estimated to be 30% which is an upper limit on the overall uncertainty of the measured spectra.
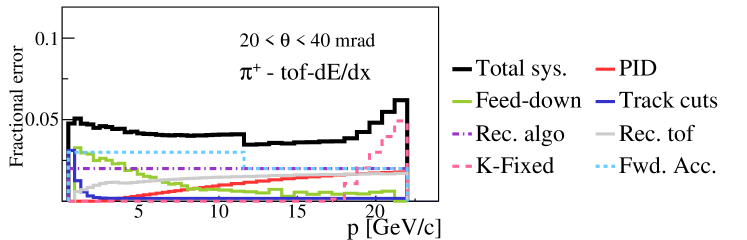
Figures 17 and 17 show a breakdown of the total systematic uncertainty in the tof- analysis for the example of the angular interval [20,40] mrad.
4.5 The analysis method
The analysis of charged pion production at low momentum was performed using particle identification based only on measurements of specific energy loss in the TPCs. For a large fraction of tracks tof can not be measured since the majority of low-momentum particles does not reach the ToF-F detector. A reliable identification of mesons was not possible at momenta above 1 GeV/ where the BB curves for pions, kaons, and protons cross each other (see Fig. 5). On the other hand, since the contamination from and antiprotons is almost negligible for mesons, the analysis could be performed for momenta up to 3 GeV/ allowing consistency checks with the other identification methods in the region of overlap.
The procedure of particle identification, described below, is tailored to the region where a rapid change of energy loss with momentum is observed. This procedure was used already for the 2007 data and more details can be found in Ref. Magda . Here just the most important steps of the analysis are described.
In order to optimize the parametrization of the BB function, samples of , , , p, and tracks with reliable particle identification were chosen in the range from 0.2 up to 100. The dependence of the BB function on was then fitted to the data using the Sternheimer and Peierls parametrization of Ref. stern . This function was subsequently used to calculate for every track of a given momentum the expected values for all considered identity hypotheses for comparison with the measured . A small (a few percent) dependence of the mean on the track polar angle had to be corrected for.
The identification procedure was performed in bins. Narrow momentum intervals (of 0.1 GeV/ for GeV/ and 0.2 GeV/ for GeV/) were chosen because of the strong dependence of on momentum. The event and track selection criteria described in Section 4.1 were applied. In each bin an unbinned maximum likelihood fit (for details see Ref. marek ) was performed to extract yields of and mesons. The probability density functions were assumed to be a sum of Gaussian functions for each particle species, centered on with variances derived from the data. The resolution is a function of the number of measured points and the particle momentum. In the analysis three independent abundances were fitted (, and proton), in the analysis only two ( and ). The and abundances were determined from the total number of particles in the fit.
As an example, the distributions for positively and negatively charged particles in the momentum interval [0.8,0.9] GeV/ and angular bin [180,240] mrad are shown in Fig. 18 and compared with the distributions obtained from the fitted function.
Finally, the Venus4.12 based simulation was used to calculate bin-by-bin corrections for pions from weak decays and interactions in the target and the detector material. The corrections include also track reconstruction efficiency and resolution as well as losses due to pion decays. Also tracks coming from decay were taken into account (not done for the 2007 data analysis). Simulation studies showed that this additional category of tracks has a non-negligible impact on the value of corrections increasing them by about . The tracks from decays can not be distinguished from candidates in the data, as both particles show similar values of due to the small difference in their masses.
4.5.1 Systematic uncertainties of the analysis
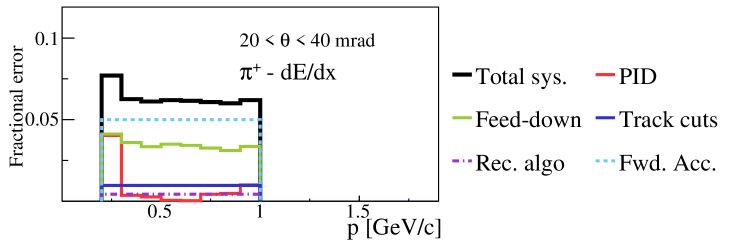
In the analysis a number of sources of systematic uncertainties were considered. Some are specific to the analysis, others were already described in previous sections.
-
(i)
PID (). The BB parametrization used in the analysis was fitted to the experimental data. In order to estimate the uncertainty related to the precision of the parametrization the results were calculated using the BB curves shifted by . This value was chosen based on small discrepancies observed between the fitted BB parametrization and the measured energy loss for pions. The resulting relative systematic uncertainty () was calculted as:
(25) where represents the number of identified when the BB curves are shifted by , while gives the original number of identified charged pions.
Clearly the calibration uncertainty of the BB function is important only for the momentum bins where the BB curves for two particle hypotheses are close to each other. A particularly difficult momentum region is [0.8-2.2] GeV/ where the BB curve for kaons approaches and crosses that for pions. The kaon relative abundance is low causing additional instability in the fit. Therefore a conservative estimate of the resulting uncertainty of the pion abundance in this momentum range was obtained by allowing the kaon abundance to vary between 0 and 0.5%. The limit was adjusted while studying neighboring bins with GeV/, where the fitted abundace was not larger than 0.1%. The corresponding relative systematic uncertainty () was calculated as:
(26) where represents the fitted number of identified with the 0.5% limit set on the fitted relative kaon fraction.
One has to keep in mind that and are correlated. Therefore the larger value () was taken as the estimate of the systematic uncertainty coming from the identification procedure. -
(ii)
Forward acceptance. The uncertainties of the acceptance correction in the forward region were determined as described in Section 4.4.2 item (iv) also for low momentum tracks. A systematic uncertainty of 5% was assigned for low angle intervals ( 60 mrad), and 3% for other intervals.
-
(iii)
Feed-down corrections. An uncertainty of 30% was assigned to the corrections for feed-down from non- (purely simulation based) and (simulation and data based) decays. This uncertainty is particularly significant in the low momentum region studied in the analysis. For further information see Section 4.4.1.
-
(iv)
Reconstruction efficiency. For estimating the uncertainty of the reconstruction efficiency corrected results for spectra from the analysis using different reconstruction algorithms were compared, see Section 4.4.2 item (iii). For most angles this uncertainty is below 2%.
-
(v)
Track cuts. The impact of the dominant track cut in the analysis was studied by changing the selection cut on the measured number of points by 10% from the starting value of 30. The change of results is below 1% and thus the associated systematic uncertainty is mostly negligible.
4.6 The analysis method
The method utilizes the observation that negatively charged pions account for more than 90% of primary negatively charged particles produced in p+C interactions at 31 GeV/. Therefore spectra can be obtained without the use of particle identification by correcting negatively charged particle spectra for the small non-pion contribution calculated by simulations. The method is not applicable to positively charged hadrons due to the larger contribution of and protons. The spectra obtained from the analysis method cover a wide momentum range from about 0.2 GeV/ to 20 GeV/, providing an independent cross-check in the region of overlap with the other two analysis methods discussed above.
The analysis follows the previously developed procedure described in Refs. pion_paper ; Tomek . In the first step, the raw yields were obtained in bins. Standard cuts, described in Section 4.1, were applied to provide good quality events and tracks. In case the track had less than 12 hits in the VTPCs, at least 4 hits were required in the GTPC to ensure a long enough track segment in the first part of the spectrometer. This is important for a good determination of the track parameters, particularly for tracks that start in the GTPC and continue to the MTPCs. A selection based on the of the track was introduced (not used in the analysis of the 2007 data) to improve the purity of the track sample by rejecting the large electron contamination at low angles. This was done to remove, in particular, electrons emitted by beam protons (-rays) passing through the NA61/SHINE detector that are not accounted for in the simulations. The effect was not prominent in the 2007 data because the intensity of the beam was significantly lower than in 2009. The separation between electrons and mostly pions was found to be sufficient for all bins when a momentum-dependent cut on was applied for each bin separately. The contribution of electrons was the largest for below 20 mrad and momentum below 4 GeV/ reaching about 10%. It decreased to 2% in bins of larger .
In the next step, the raw yields of selected negatively charged hadrons were corrected using the standard NA61/SHINE simulation chain with the Venus4.12 model as primary event generator and GEANT3 for particle propagation and generation of secondary interactions. Like in the previous analysis one global correction factor was calculated for each bin. The correction includes the contribution of primary and , the contribution from weak decays of strange particles and secondary interactions in the target as well as in the detector material. It also accounts for track reconstruction efficiency and losses due to the limited geometrical acceptance.
Given the large available statistics, the analysis technique provides the best precision for the spectra in the full range covered by NA61/SHINE.
4.6.1 Systematic uncertainties of the analysis
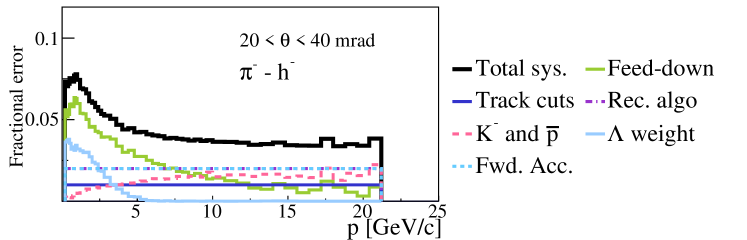
Most of the systematic uncertainties were evaluated in the same way as for the other charged hadron spectra analyses. Error sources which are specific to the analysis include uncertainties of the contamination by , and of the electron rejection procedure. The following effects were taken into account for the estimate of systematic uncertainties:
-
(i)
Feed-down. The uncertainty related to the correction for secondary interactions and for weak decays of strange particles remains the dominant contribution to the systematic uncertainty at low momentum. For both of these sources a 30% error was assigned as described in Ref. pion_paper . The significant reduction of the uncertainty, compared to the 2007 analysis, comes from the use of new NA61/SHINE measurements of production (see Subsection 4.4.1 for more details) and the removal of electrons at low and low momentum.
-
(ii)
Forward acceptance. The impact of the GTPC detector was evaluated following the procedure described in Section 4.4.2. The systematic uncertainty deduced from the difference of the spectra obtained with the reconstruction algorithms with and without use of the GTPC was found to be 4% for mrad and 2% for mrad in the overlapping acceptance regions. The variation of the number of hits required for tracks starting in the GTPC resulted in a systematic uncertainty of up to 4-5% for the most forward region mrad and at momenta GeV/.
-
(iii)
and contamination. The admixture of and was estimated from simulations with the Venus4.12 model as the primary event generator and was assigned a systematic uncertainty of 20%. The contribution of and varies with momentum from 5% to 10% at low angles. For 100 mrad it increases with momentum and varies from 5% to 20%.
-
(iv)
Reconstruction efficiency. The reconstruction efficiency was evaluated by comparing results for different reconstruction algorithms used in the experiment. Differences of about 2% were found. Since no dependence was observed on momentum and angle this value was assigned to the systematic uncertainty.
-
(v)
Track selection method. The uncertainty was estimated by varying the following selections: required minimum total number of points on the track, cuts for electron removal, and maximally allowed impact parameter. The requirement on the number of points on the track was changed by 10% from the nominal value of 30 and the corresponding uncertainty was found to be up to 1%. The uncertainty associated with the cut to reject electrons was estimated by varying the cut value in for each of the bins by 3%. The separation of electrons and mostly pions is good, so the impact on the spectra is negligible compared to that of varying the requirement on the number of points and no additional uncertainty was assigned. To test the sensitivity to the impact parameter cut, the analysis was repeated without the cut and the effect was found to be negligible.
Figure 21 shows a breakdown of the total systematic uncertainty for as a function of momentum in the angular interval [20,40] mrad as an example.
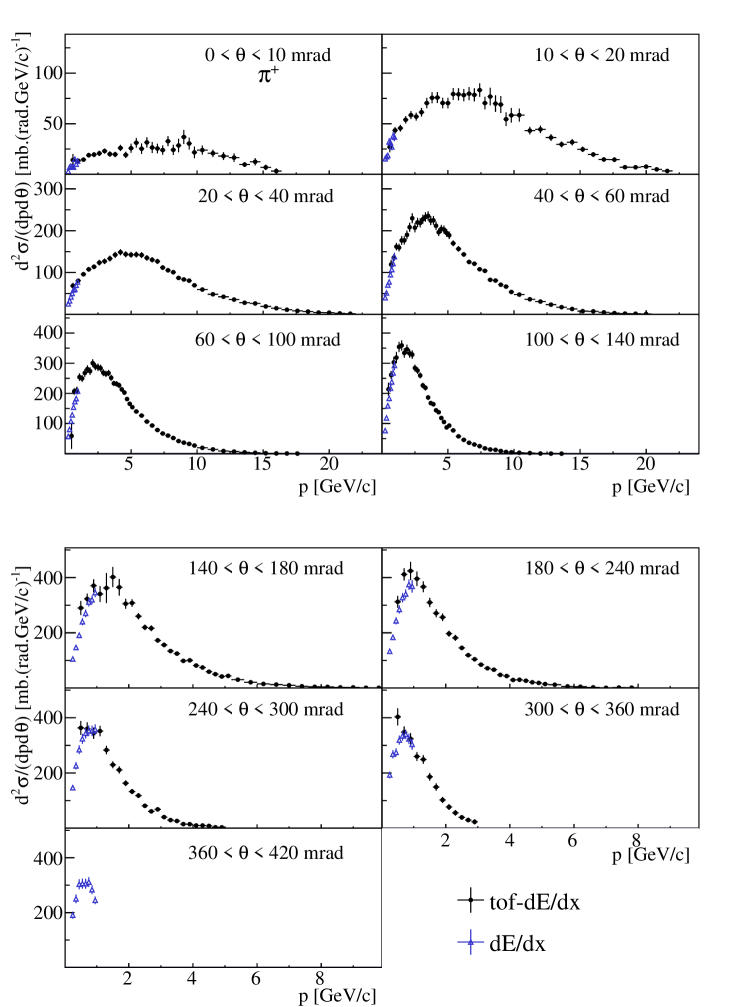
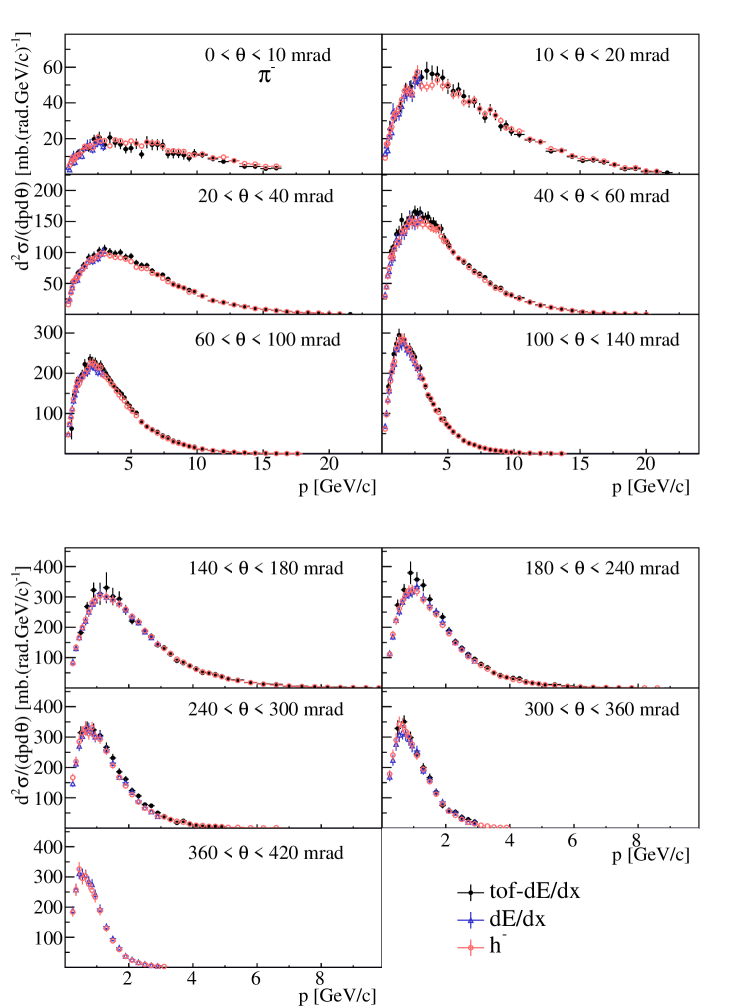
5 Results on spectra
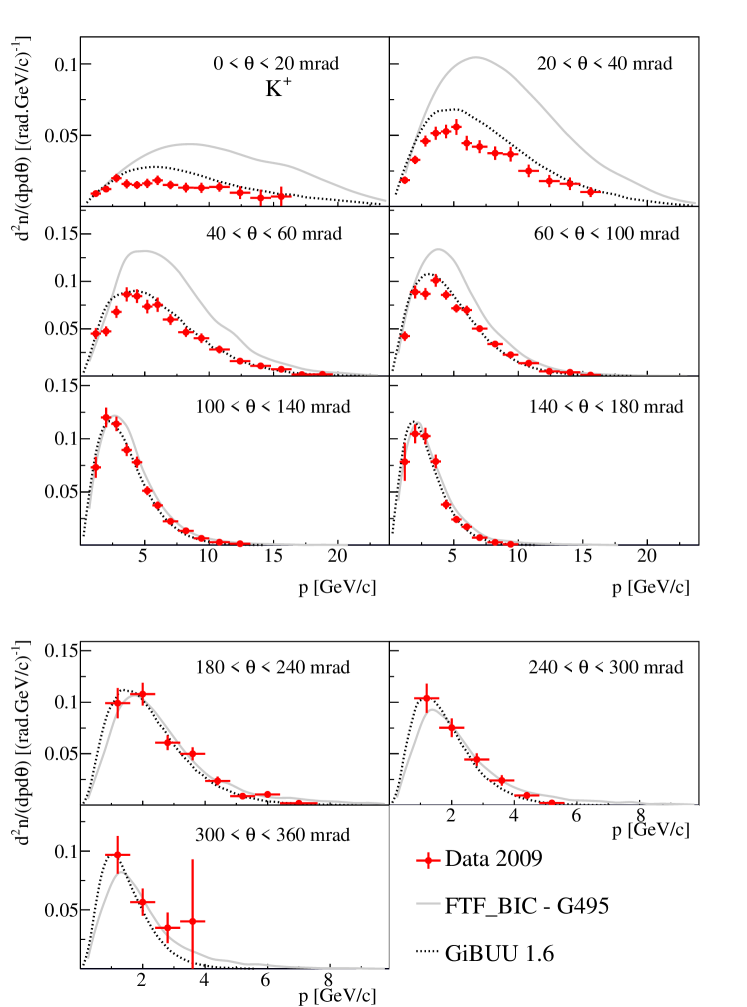
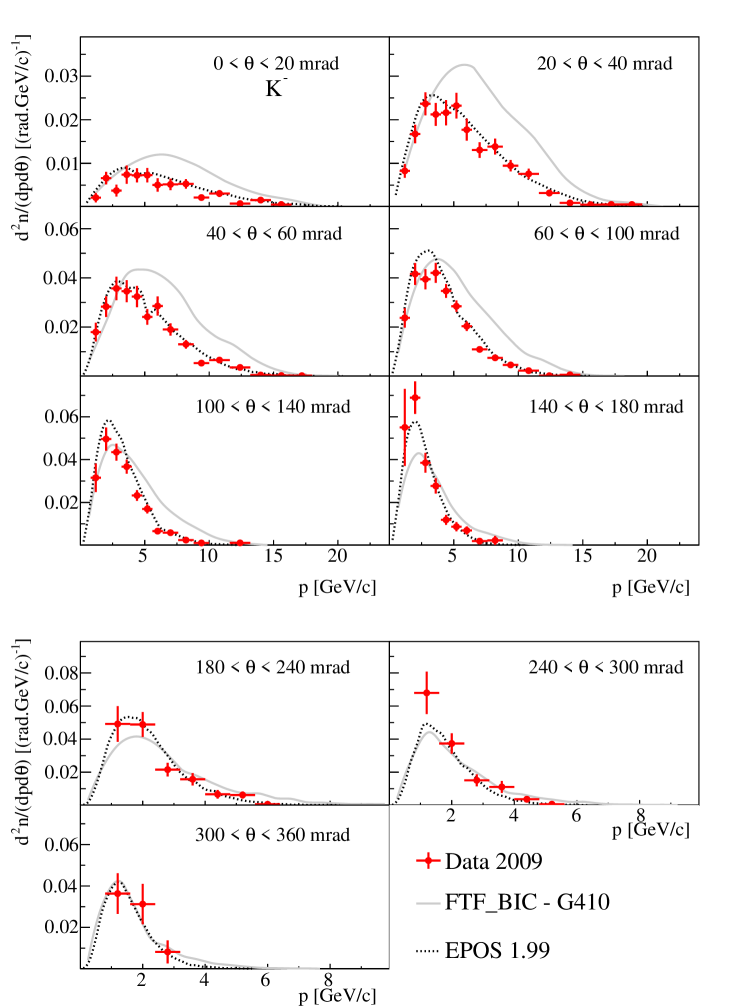
This section presents results on spectra of , , and protons, as well as and in p+C interactions at 31 GeV/. The large statistics of the 2009 dataset resulted in improved precision and larger coverage compared to the published 2007 data and allowed measurements of spectra in NA61/SHINE for the first time. The comparison between the 2009 and 2007 results is discussed.
The new measurements are presented together with selected predictions of hadron production models, which are described in Section 6. Complete comparisons are shown in Ref. CERNpreprint-2015-278 . In order to avoid uncertainties related to the different treatment of quasi-elastic interactions and to the absence of predictions for inclusive cross sections, spectra are normalized to the mean particle multiplicity in all production interactions. For the data, the normalization relies on the p+C inclusive production cross section which was found to be 230.7 mb (see Section 3.5). The production cross section is calculated from the inelastic cross section by subtracting the quasi-elastic contribution. Therefore production processes are defined as those in which only new hadrons are present in the final state. Details of the cross section analysis procedure can be found in Section 3 and in Refs. Davide ; pion_paper ; claudia .
The experimental measurements are shown with total uncertainties which correspond to the statistical and systematic uncertainties added in quadrature. The overall uncertainty due to the normalization procedure (discussed in Section 4.2) is not shown.
5.1 results
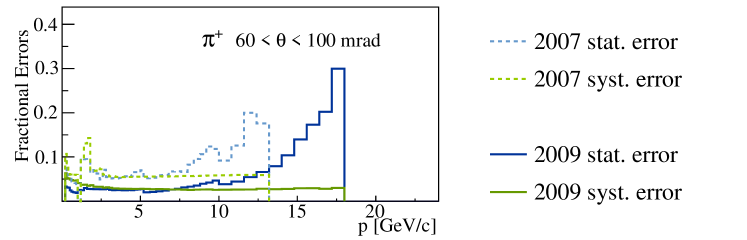
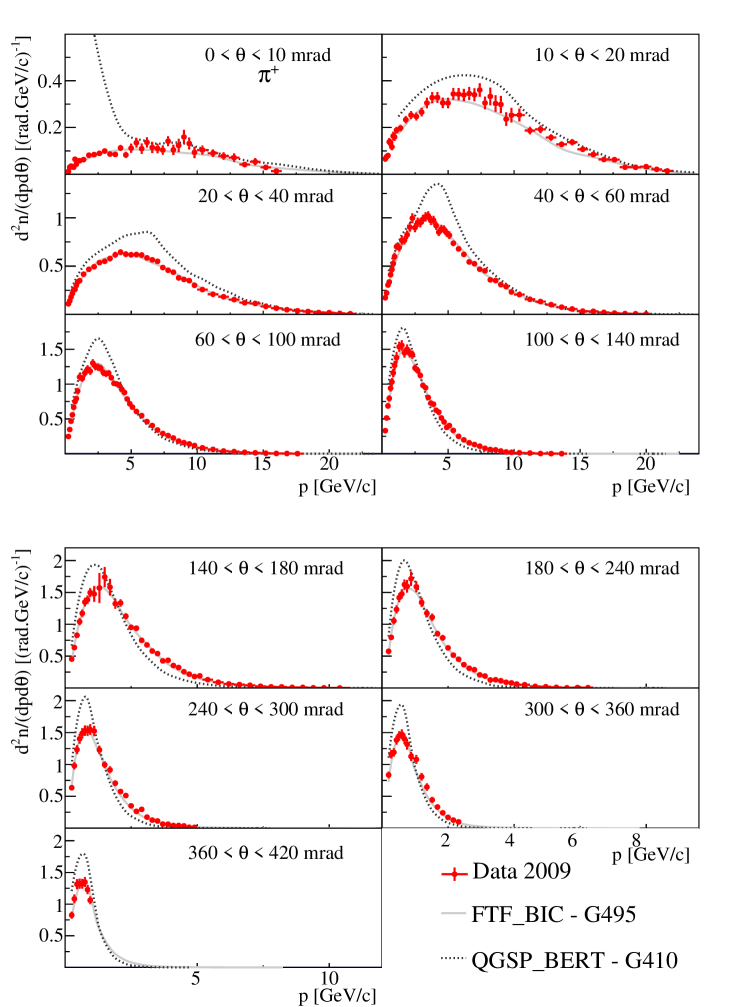
The spectra of mesons were obtained using three different analysis techniques tof-, and described in Sections 4.4, 4.5 and 4.6. Within the corresponding systematic uncertainties, the results of various methods were found to be in a good agreement as shown in Fig. 22 and Fig. 23 for and , respectively. In order to present a single spectrum for positively and negatively changed pions, the results were combined. For mesons, where there is complementarity of acceptance for different analysis techniques results from the analysis are used for all angular intervals up to 420 mrad in the momentum range below 1 GeV/. The momentum region above 1 GeV/ is covered by the tof- analysis for angular intervals up to 360 mrad. In case of mesons, results of the analysis are used in the full angular range up to 420 mrad since they provide the smallest total uncertainty in the region of the overlap between methods. The final spectra are shown for in Fig. 27 and for in Fig. 28. Numerical results are given in Tables 4 and 5 for and , respectively. Thus, the final results span a broad kinematic range. When comparing the new results to the previously published measurements based on the 2007 data pion_paper one should note that the present results are shown in the form of , while the form was used in previous publications Refs. pion_paper ; kaon_paper . The deviations between the two data sets are consistent within the quoted errors and are distributed uniformly over the phase space. Thus, the new measurements confirm the published 2007 results which were questioned in Ref. Chvala_Fischer . Both the statistical and the total systematic uncertainties are considerably smaller for the new 2009 results as shown for the angular interval [60,100] mrad for in Fig. 24 and for in Fig. 25. At low momentum systematic uncertainties dominate whereas at higher momentum the statistical uncertainty gives the largest contribution to the total uncertainty.

5.2 results
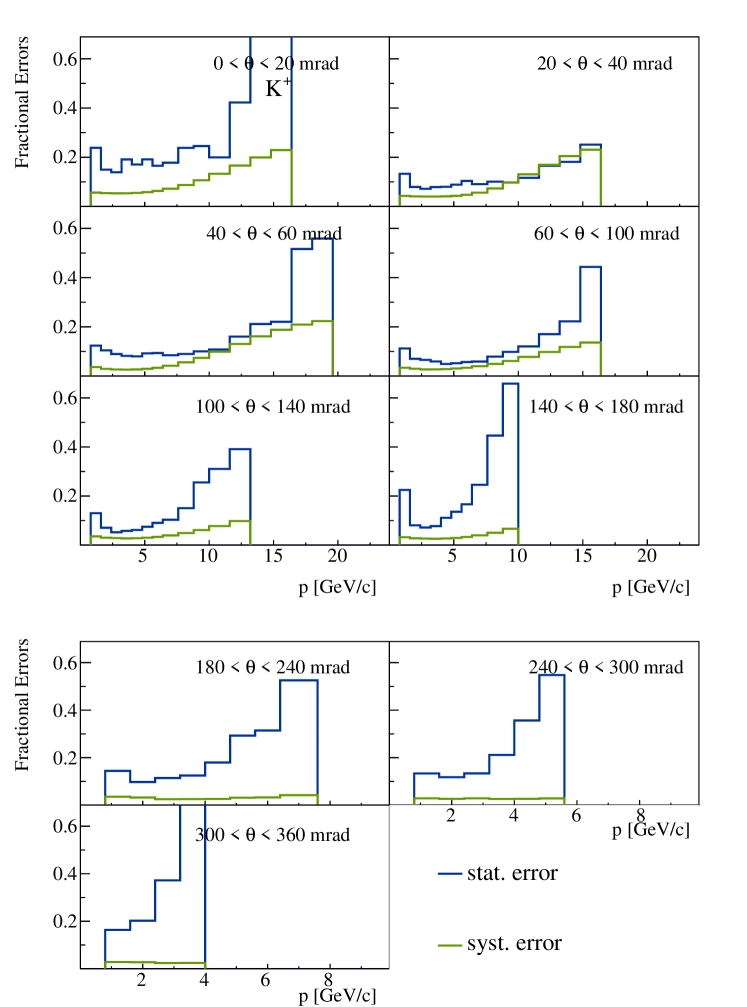
The tof- analysis technique was used to obtain the spectra shown in Fig. 29 and the spectra plotted in Fig. 30. The large 2009 dataset allowed for the first measurements of yields in p+C interactions by NA61/SHINE. Large statistics for made it possible to use narrow bins in the analysis which is important for tuning the neutrino flux predictions in T2K. Numerical results are given in Tables 6 and 7 for and , respectively. The analysis of was repeated, as a cross-check, with a coarser binning that corresponds to the previously published measurements based on the 2007 data kaon_paper . Good agreement was found. The total uncertainty for the 2009 data remains dominated by the statistical uncertainty as shown in Fig. 26 for as an example.
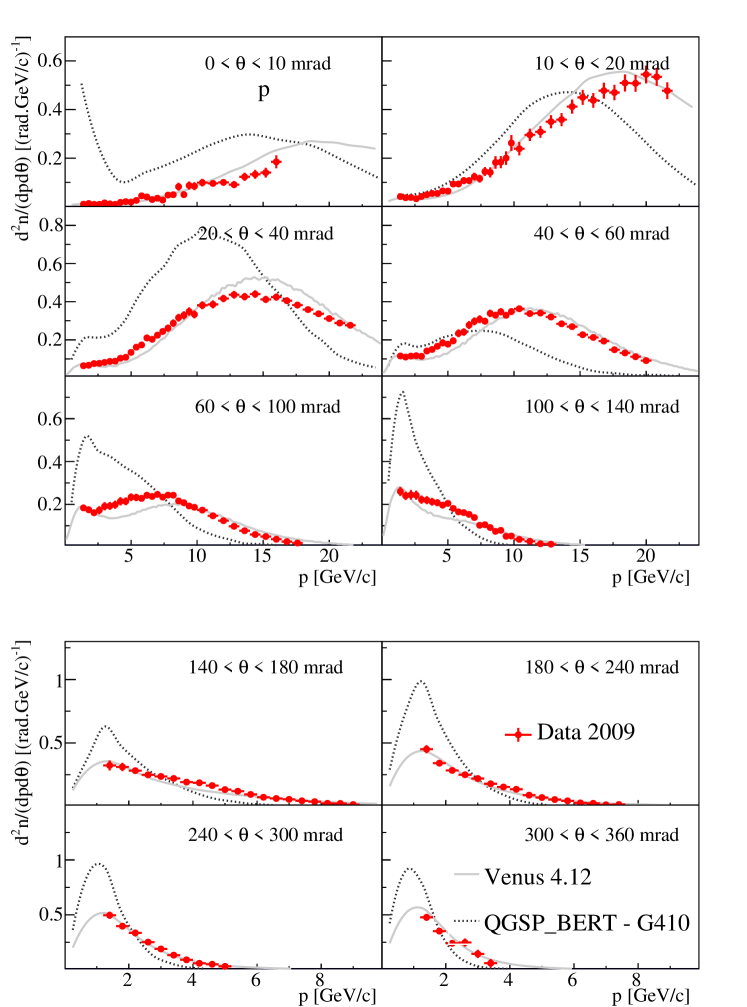
5.3 Proton results
The tof- analysis technique was used to extract proton spectra. These measurements, shown in Fig. 31, cover a wide kinematic range above 1 GeV/ and are important for T2K since they provide the possibility to constrain the contributions from re-interactions in the long carbon target and in the elements of the beamline. Numerical results are given in Table 8. The new proton spectra are in a good agreement with preliminary results obtained using the 2007 data Status_Report_2012 .
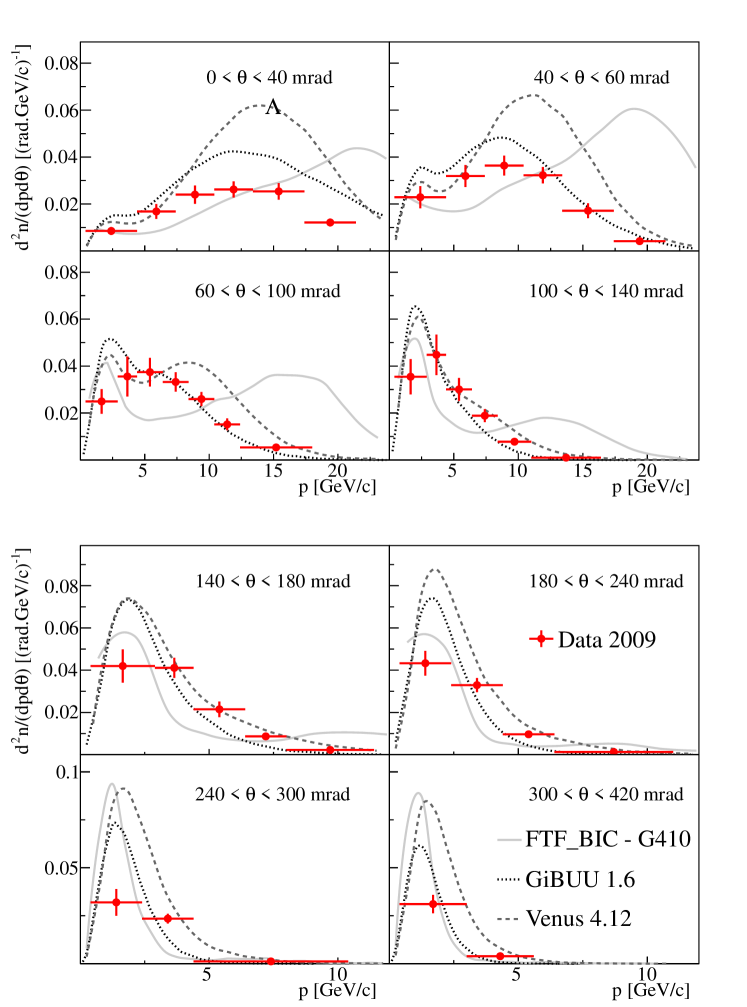
5.4 results
The and spectra are shown in Fig. 32 and Fig. 33 and numerical results are given in Tables 9 and 10, respectively. As explained in Section 4.4.1, those measurements are used to reduce the dominant systematic uncertainties due to the feed-down correction in the charged hadron analyses. Results are consistent within the quoted systematic uncertainties with previously published measurements V0_2007 which were obtained with a much coarser binning due to the lower statistics of the 2007 data.
The spectra of can be cross-checked by measurements of yields, thanks to the unique capability to measure these three types of kaons simultaneously in the NA61/SHINE experiment. So far, only a few experiments have been able to perform such measurements and to test two different theoretical hypotheses that predict yields from production rates giving inconclusive results. The first approach assumes isospin symmetry in kaon production and predicts (see e.g. Ref. Gazdzicki:1991ih ):
| (27) |
The second method uses a quark-counting argument BMPT , with a simplified quark parton model. The following assumptions are made on the number of sea and valence quarks:
| (28) | |||
| (29) |
Taking into account that interactions are with a carbon nucleus ( for p+p collisions, for p+n), the relation between mean multiplicity of , and is:
| (30) |
The second method is currently used to tune production in the T2K flux simulation chain T2Kflux . Figure 32 shows a comparison of the measured spectra of to the predictions from measured charged kaon yields and reasonable agreement is observed. Unfortunately, the large uncertainties associated with the measurements do not allow us to discriminate between the two hypotheses.
6 Comparisons with hadron production models
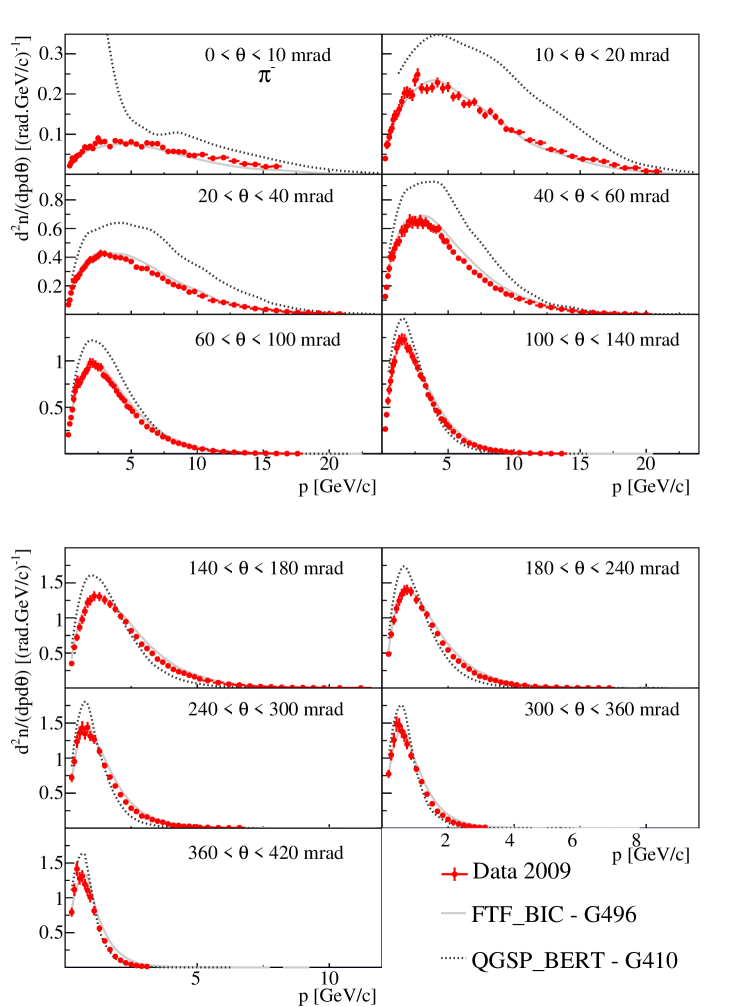
The spectra shown in Figs. 27–33
are compared to predictions of seven hadronic event generators. These are
Venus4.12 Venus1 ; Venus2 , Epos1.99 EPOS 333Note that the Epos model is used here
in an energy domain for which it was originally not designed (below 100 GeV in the laboratory).,
GiBUU1.6 GiBUU ; Gallmeister , as well as FTF_BIC-G495, FTF_BIC-G496, FTF_BIC-G410 and QGSP_BERT physics lists
defined in the GEANT4 toolkit 444The predictions of the different versions of FTF-based physics lists
from the consecutive GEANT4 releases 4.9.5, 4.9.6 and 4.10 are significantly different..
For clarity of presentation predictions of only two models
are plotted with the spectra of each hadron type. They were selected to show examples of predictions with
small and large deviations from the measurements. The comparison of the measured spectra
with all model predictions is available in Ref. CERNpreprint-2015-278 .
None of the models provides a satisfactory description of all the measured spectra. The FTF-based physics lists of GEANT4 provide a reasonable description of and spectra, but do not reproduce and proton spectra. The Epos1.99 and GiBUU1.6 models show good agreement with the measured spectra. The best description of the proton spectra is achieved by the Venus4.12 model which was used to calculate the corrections applied to obtain the results presented in this paper.

7 Summary
This paper presents precise measurements of interaction and production cross sections as well as of spectra of , , protons, and in p+C interactions at 31 GeV/. These data are crucial for predictions of the initial neutrino fluxes in the T2K long baseline neutrino oscillation experiment in Japan. Furthermore, they provide important input to improve hadron production models needed for the interpretation of air showers initiated by ultra high energy cosmic particles. The measurements were performed with the large acceptance NA61/SHINE spectrometer at the CERN SPS. A set of data collected with a 4% isotropic graphite target during the high-statistics NA61/SHINE run in 2009 was used for the analysis. The measured spectra are compared with predictions of several hadron production models. None of the models provides a satisfactory description of all the spectra.
Acknowledgements.
We would like to thank the CERN PH, BE and EN Departments for the strong support of NA61/SHINE. This work was supported by the Hungarian Scientific Research Fund (grants OTKA 68506 and 71989), the János Bolyai Research Scholarship of the Hungarian Academy of Sciences, the Polish Ministry of Science and Higher Education (grants 667/N-CERN/2010/0, NN 202 48 4339 and NN 202 23 1837), the Polish National Center for Science (grants 2011/03/N/ST2/03691, 2012/04/M/ST2/00816 and 2013/11/N/ST2/03879), the Foundation for Polish Science — MPD program, co-financed by the European Union within the European Regional Development Fund, the Federal Agency of Education of the Ministry of Education and Science of the Russian Federation (SPbSU research grant 11.38.193.2014), the Russian Academy of Science and the Russian Foundation for Basic Research (grants 08-02-00018, 09-02-00664 and 12-02-91503-CERN), the Ministry of Education, Culture, Sports, Science and Technology, Japan, Grant-in-Aid for Scientific Research (grants 18071005, 19034011, 19740162, 20740160 and 20039012), the German Research Foundation (grant GA 1480/2-2), the U. S. Department of Energy, the EU-funded Marie Curie Outgoing Fellowship, Grant PIOF-GA-2013-624803, the Bulgarian Nuclear Regulatory Agency and the Joint Institute for Nuclear Research, Dubna (bilateral contract No. 4418-1-15/17), Ministry of Education and Science of the Republic of Serbia (grant OI171002), Swiss Nationalfonds Foundation (grant 200020117913/1) and ETH Research Grant TH-01 07-3.References
- (1) N. Antoniou, et al., CERN-SPSC-2006-034 (2006)
- (2) N. Antoniou, et al., CERN-SPSC-2007-004 (2007)
- (3) N. Antoniou, et al., CERN-SPSC-2007-019 (2007)
- (4) N. Abgrall, et al., CERN-SPSC-2008-018 (2008)
- (5) N. Abgrall, et al., Phys. Rev. C84, 034604 (2011). DOI 10.1103/PhysRevC.84.034604
- (6) N. Abgrall, et al., Phys. Rev. C85, 035210 (2012). DOI 10.1103/PhysRevC.85.035210
- (7) K. Abe, et al., Nucl. Instrum. Meth. A659, 106 (2011). DOI 10.1016/j.nima.2011.06.067
- (8) S. Johnson, et al., CERN-SPSC-2014-032; SPSC-P-330-ADD-7 (2014)
- (9) J. Abraham, et al., Nucl. Instrum. Meth. A523, 50 (2004). DOI 10.1016/j.nima.2003.12.012
- (10) T. Antoni, et al., Nucl. Instrum. Meth. A513, 490 (2003). DOI 10.1016/S0168-9002(03)02076-X
- (11) N. Abgrall, et al., Eur. Phys. J. C74, 2794 (2014). DOI 10.1140/epjc/s10052-014-2794-6
- (12) N. Abgrall, et al., CERN-SPSC-2014-031 (2014)
- (13) A. Aduszkiewicz, et al., CERN-SPSC-2015-036 (2015)
- (14) N. Abgrall, et al., Phys. Rev. C89, 025205 (2014). DOI 10.1103/PhysRevC.89.025205
- (15) K. Abe, et al., Phys. Rev. Lett. 107(4), 041801 (2011). DOI 10.1103/PhysRevLett.107.041801
- (16) K. Abe, et al., Phys. Rev. D85, 031103 (2012). DOI 10.1103/PhysRevD.85.031103
- (17) K. Abe, et al., Phys. Rev. D87, 012001 (2013). DOI 10.1103/PhysRevD.87.012001,10.1103/PhysRevD.87.019902
- (18) K. Abe, et al., Phys. Rev. D88, 032002 (2013). DOI 10.1103/PhysRevD.88.032002
- (19) K. Abe, et al., Phys. Rev. Lett. 111, 211803 (2013). DOI 10.1103/PhysRevLett.111.211803
- (20) K. Abe, et al., Phys. Rev. Lett. 112, 061802 (2014). DOI 10.1103/PhysRevLett.112.061802
- (21) K. Abe, et al., Phys. Rev. Lett. 112, 181801 (2014). DOI 10.1103/PhysRevLett.112.181801
- (22) K. Abe, et al., Phys. Rev. D87, 092003 (2013). DOI 10.1103/PhysRevD.87.092003
- (23) K. Abe, et al., Phys. Rev. D90(5), 052010 (2014). DOI 10.1103/PhysRevD.90.052010
- (24) K. Abe, et al., Phys. Rev. Lett. 113(24), 241803 (2014). DOI 10.1103/PhysRevLett.113.241803
- (25) N. Abgrall, et al., JINST 9, P06005 (2014). DOI 10.1088/1748-0221/9/06/P06005
- (26) K. Abe, et al., PTEP 2015(4), 043C01 (2014). DOI 10.1093/ptep/ptv031
- (27) N. Abgrall, et al., Nucl. Instrum. Meth. A701, 99 (2013). DOI 10.1016/j.nima.2012.10.079
- (28) A. Haesler, Ph.D. Thesis, University of Geneva (2015). URL https://cds.cern.ch/record/2039148
- (29) S. Afanasiev, et al., Nucl.Instrum.Meth. A430, 210 (1999). DOI 10.1016/S0168-9002(99)00239-9
- (30) C. Bovet, et al., (1982). CERN-YELLOW-82-13
- (31) N. Abgrall, Ph.D. Thesis, University of Geneva (2011). URL https://edms.cern.ch/document/1172455/1
- (32) B. Bobchenko, A. Buklei, A. Vlasov, L. Vorobev, N. Goryainov, et al., Sov.J.Nucl.Phys. 30, 805 (1979)
- (33) D. Sgalaberna, Ph.D. Thesis, ETH Zurich (to be defended soon) (2016)
- (34) C. Strabel, Ph.D. Thesis, ETH Zurich (2011). URL https://edms.cern.ch/document/1136130/1
- (35) G. Bellettini, et al., Nucl. Phys. 79(3), 609 (1966)
- (36) S.P. Denisov, et al., Nucl. Phys. B 61, 62 (1973)
- (37) S. Mahajan, R. Raja, (2013). FERMILAB-CONF-13-461-E
- (38) A.S. Carroll, et al., Phys. Lett. B 80, 319 (1979)
- (39) S. Agostinelli, et al., Nucl. Instrum. Meth. A506, 250 (2003)
- (40) J. Allison, et al., IEEE Transactions on Nuclear Science 53(1), 270 (2006)
- (41) A. Schiz, et al., Phys. Rev. D 21(11), 3010 (1980)
- (42) L. Zambelli, Ph.D. Thesis, University of Paris VII (2013). URL https://edms.cern.ch/document/1316278/1
- (43) J. Podolanski, R. Armenteros, Philosophical Magazine Series 7 45:360, 13 (1953)
- (44) K. Olive, et al., Chin. Phys. C38, 090001 (2014). DOI 10.1088/1674-1137/38/9/090001
- (45) K. Werner, Nucl. Phys. A525, 501 (1991). DOI 10.1016/0375-9474(91)90372-D
- (46) K. Werner, Phys. Rept. 232, 87 (1993). DOI 10.1016/0370-1573(93)90078-R
- (47) A. Ferrari, P.R. Sala, A. Fasso, J. Ranft, CERN-2005-010, SLAC-R-773, INFN-TC-05-11 (2005)
- (48) G. Battistoni, et al., AIP Conf. Proc. 896, 31 (2007). DOI 10.1063/1.2720455
- (49) T. Böhlen, et al., Nuclear Data Sheets 120, 211-214 (2014)
- (50) K. Werner, F.M. Liu, T. Pierog, Phys. Rev. C74, 044902 (2006). DOI 10.1103/PhysRevC.74.044902
- (51) S. Murphy, Ph.D. Thesis, University of Geneva (2012). URL https://edms.cern.ch/document/1218480/1
- (52) M. Posiadała, Ph.D. Thesis, University of Warsaw (2012). URL https://edms.cern.ch/document/1250627/1
- (53) R.M. Sternheimer, R.F. Peierls, Phys. Rev. B3, 3681 (1971). DOI 10.1103/PhysRevB.3.3681
- (54) M. Gazdzicki, Nucl. Instrum. Meth. A345, 148 (1994). DOI 10.1016/0168-9002(94)90984-9
- (55) T. Palczewski, Ph.D. Thesis, NCNR, Warsaw (2012). URL https://edms.cern.ch/document/1240016/1
- (56) N. Abgrall, et al., (2015). CERN-PH-EP-2015-278
- (57) O. Chvala, H. Fischer, M. Makariev, A. Rybicki, D. Varga, et al., Eur. Phys. J. C73, 2329 (2013). DOI 10.1140/epjc/s10052-013-2329-6
- (58) N. Abgrall, et al., CERN-SPSC-2012-029 (2012)
- (59) M. Gazdzicki, O. Hansen, Nucl.Phys. A528, 754 (1991)
- (60) M. Bonesini, A. Marchionni, F. Pietropaolo, T. Tabarelli de Fatis, Eur. Phys. J. C20, 13 (2001). DOI 10.1007/s100520100656
- (61) O. Buss, T. Gaitanos, K. Gallmeister, H. van Hees, M. Kaskulov, et al., Phys. Rept. 512, 1 (2012). DOI 10.1016/j.physrep.2011.12.001
- (62) K. Gallmeister, U. Mosel, Nucl. Phys. A826, 151 (2009). DOI 10.1016/j.nuclphysa.2009.05.104
| 0 | - | 10 | 0.2 | - | 0.3 | 2.8 | 1.4 | 0.3 |
|---|---|---|---|---|---|---|---|---|
| 0.3 | - | 0.4 | 7.0 | 1.3 | 0.6 | |||
| 0.4 | - | 0.5 | 8.1 | 1.5 | 0.6 | |||
| 0.5 | - | 0.6 | 7.3 | 1.2 | 0.6 | |||
| 0.6 | - | 0.7 | 7.1 | 1.4 | 0.6 | |||
| 0.7 | - | 0.8 | 14.9 | 1.9 | 1.2 | |||
| 0.8 | - | 0.9 | 10.0 | 1.7 | 0.8 | |||
| 0.9 | - | 1.0 | 13.1 | 1.9 | 1.1 | |||
| 1.0 | - | 1.2 | 13.4 | 1.9 | 0.8 | |||
| 1.2 | - | 1.6 | 14.5 | 1.6 | 0.8 | |||
| 1.6 | - | 2.0 | 18.9 | 2.0 | 0.9 | |||
| 2.0 | - | 2.4 | 19.5 | 2.2 | 1.0 | |||
| 2.4 | - | 2.8 | 20.7 | 2.3 | 1.0 | |||
| 2.8 | - | 3.2 | 23.0 | 2.3 | 1.1 | |||
| 3.2 | - | 3.6 | 20.0 | 2.4 | 1.0 | |||
| 3.6 | - | 4.0 | 19.7 | 2.5 | 1.0 | |||
| 4.0 | - | 4.4 | 26.0 | 2.7 | 1.3 | |||
| 4.4 | - | 4.8 | 19.2 | 3.0 | 0.9 | |||
| 4.8 | - | 5.2 | 25.8 | 4.3 | 1.3 | |||
| 5.2 | - | 5.6 | 31.2 | 4.5 | 1.6 | |||
| 5.6 | - | 6.0 | 25.3 | 5.0 | 1.3 | |||
| 6.0 | - | 6.4 | 31.5 | 4.8 | 1.6 | |||
| 6.4 | - | 6.8 | 26.5 | 5.3 | 1.3 | |||
| 6.8 | - | 7.2 | 25.5 | 4.6 | 1.3 | |||
| 7.2 | - | 7.6 | 23.9 | 4.5 | 1.3 | |||
| 7.6 | - | 8.0 | 32.7 | 4.6 | 1.7 | |||
| 8.0 | - | 8.4 | 24.2 | 4.3 | 2.6 | |||
| 8.4 | - | 8.8 | 28.5 | 5.8 | 3.2 | |||
| 8.8 | - | 9.2 | 36.9 | 5.6 | 4.1 | |||
| 9.2 | - | 9.6 | 30.4 | 4.8 | 3.4 | |||
| 9.6 | - | 10.0 | 21.7 | 5.1 | 2.4 | |||
| 10.0 | - | 10.8 | 24.0 | 3.6 | 2.7 | |||
| 10.8 | - | 11.6 | 20.8 | 3.4 | 1.2 | |||
| 11.6 | - | 12.4 | 18.0 | 3.6 | 1.1 | |||
| 12.4 | - | 13.2 | 16.5 | 4.0 | 1.1 | |||
| 13.2 | - | 14.0 | 9.7 | 2.2 | 0.7 | |||
| 14.0 | - | 14.8 | 12.4 | 3.5 | 1.0 | |||
| 14.8 | - | 15.6 | 6.9 | 2.5 | 0.7 | |||
| 15.6 | - | 16.4 | 3.2 | 2.6 | 0.4 | |||
| 10 | - | 20 | 0.2 | - | 0.3 | 15.3 | 2.4 | 1.6 |
|---|---|---|---|---|---|---|---|---|
| 0.3 | - | 0.4 | 17.4 | 1.9 | 1.4 | |||
| 0.4 | - | 0.5 | 18.5 | 2.1 | 1.5 | |||
| 0.5 | - | 0.6 | 32.1 | 2.9 | 2.4 | |||
| 0.6 | - | 0.7 | 31.2 | 2.7 | 2.4 | |||
| 0.7 | - | 0.8 | 27.1 | 2.6 | 2.1 | |||
| 0.8 | - | 0.9 | 37.8 | 3.0 | 2.9 | |||
| 0.9 | - | 1.0 | 36.9 | 2.9 | 2.8 | |||
| 1.0 | - | 1.2 | 43.5 | 2.2 | 2.5 | |||
| 1.2 | - | 1.6 | 45.6 | 2.2 | 2.4 | |||
| 1.6 | - | 2.0 | 53.9 | 2.4 | 2.8 | |||
| 2.0 | - | 2.4 | 58.5 | 2.5 | 3.0 | |||
| 2.4 | - | 2.8 | 57.0 | 2.5 | 2.9 | |||
| 2.8 | - | 3.2 | 61.4 | 2.8 | 3.1 | |||
| 3.2 | - | 3.6 | 70.4 | 3.7 | 3.6 | |||
| 3.6 | - | 4.0 | 75.6 | 3.8 | 3.9 | |||
| 4.0 | - | 4.4 | 75.9 | 3.8 | 3.8 | |||
| 4.4 | - | 4.8 | 70.5 | 3.8 | 3.5 | |||
| 4.8 | - | 5.2 | 70.3 | 3.8 | 3.5 | |||
| 5.2 | - | 5.6 | 79.3 | 4.4 | 3.9 | |||
| 5.6 | - | 6.0 | 79.1 | 4.6 | 3.9 | |||
| 6.0 | - | 6.4 | 78.3 | 4.6 | 4.0 | |||
| 6.4 | - | 6.8 | 79.7 | 5.2 | 3.9 | |||
| 6.8 | - | 7.2 | 78.5 | 5.1 | 3.8 | |||
| 7.2 | - | 7.6 | 83.2 | 5.3 | 4.0 | |||
| 7.6 | - | 8.0 | 70.4 | 5.2 | 3.5 | |||
| 8.0 | - | 8.4 | 76.8 | 5.3 | 6.9 | |||
| 8.4 | - | 8.8 | 69.9 | 5.0 | 6.4 | |||
| 8.8 | - | 9.2 | 68.9 | 5.5 | 6.3 | |||
| 9.2 | - | 9.6 | 54.5 | 4.5 | 5.0 | |||
| 9.6 | - | 10.0 | 58.3 | 4.8 | 5.4 | |||
| 10.0 | - | 10.8 | 58.5 | 3.4 | 5.4 | |||
| 10.8 | - | 11.6 | 43.2 | 3.0 | 2.2 | |||
| 11.6 | - | 12.4 | 44.4 | 3.0 | 2.2 | |||
| 12.4 | - | 13.2 | 36.3 | 2.7 | 1.8 | |||
| 13.2 | - | 14.0 | 29.6 | 2.3 | 1.6 | |||
| 14.0 | - | 14.8 | 31.7 | 2.6 | 1.8 | |||
| 14.8 | - | 15.6 | 24.7 | 2.1 | 1.6 | |||
| 15.6 | - | 16.4 | 19.6 | 1.9 | 1.4 | |||
| 16.4 | - | 17.2 | 14.7 | 1.8 | 1.2 | |||
| 17.2 | - | 18.0 | 14.5 | 1.8 | 1.3 | |||
| 18.0 | - | 18.8 | 7.0 | 1.6 | 0.7 | |||
| 18.8 | - | 19.6 | 6.9 | 1.2 | 0.8 | |||
| 19.6 | - | 20.4 | 7.6 | 1.4 | 0.9 | |||
| 20.4 | - | 21.2 | 4.9 | 0.9 | 0.7 | |||
| 21.2 | - | 22.0 | 3.3 | 1.6 | 0.5 | |||
| 20 | - | 40 | 0.2 | - | 0.3 | 25.5 | 2.0 | 2.0 |
|---|---|---|---|---|---|---|---|---|
| 0.3 | - | 0.4 | 32.6 | 2.0 | 2.0 | |||
| 0.4 | - | 0.5 | 41.9 | 2.3 | 2.6 | |||
| 0.5 | - | 0.6 | 50.1 | 2.4 | 3.1 | |||
| 0.6 | - | 0.7 | 58.5 | 2.6 | 3.6 | |||
| 0.7 | - | 0.8 | 60.0 | 2.6 | 3.6 | |||
| 0.8 | - | 0.9 | 69.5 | 2.9 | 4.2 | |||
| 0.9 | - | 1.0 | 77.6 | 2.9 | 4.8 | |||
| 1.0 | - | 1.2 | 80.6 | 2.1 | 4.1 | |||
| 1.2 | - | 1.6 | 96.1 | 2.2 | 4.6 | |||
| 1.6 | - | 2.0 | 107.8 | 2.2 | 5.1 | |||
| 2.0 | - | 2.4 | 113.9 | 2.4 | 5.1 | |||
| 2.4 | - | 2.8 | 123.8 | 3.3 | 5.7 | |||
| 2.8 | - | 3.2 | 127.0 | 3.3 | 5.8 | |||
| 3.2 | - | 3.6 | 133.6 | 3.4 | 5.9 | |||
| 3.6 | - | 4.0 | 142.4 | 3.5 | 6.3 | |||
| 4.0 | - | 4.4 | 148.6 | 3.5 | 6.3 | |||
| 4.4 | - | 4.8 | 143.9 | 3.5 | 6.1 | |||
| 4.8 | - | 5.2 | 142.5 | 3.5 | 5.9 | |||
| 5.2 | - | 5.6 | 143.0 | 3.5 | 5.9 | |||
| 5.6 | - | 6.0 | 141.8 | 3.5 | 5.8 | |||
| 6.0 | - | 6.4 | 135.1 | 3.4 | 5.5 | |||
| 6.4 | - | 6.8 | 130.5 | 3.5 | 5.3 | |||
| 6.8 | - | 7.2 | 126.8 | 3.4 | 5.1 | |||
| 7.2 | - | 7.6 | 112.0 | 3.2 | 4.5 | |||
| 7.6 | - | 8.0 | 105.6 | 3.2 | 4.3 | |||
| 8.0 | - | 8.4 | 101.0 | 3.2 | 4.0 | |||
| 8.4 | - | 8.8 | 87.4 | 2.9 | 3.5 | |||
| 8.8 | - | 9.2 | 83.6 | 2.9 | 3.4 | |||
| 9.2 | - | 9.6 | 80.8 | 2.9 | 3.3 | |||
| 9.6 | - | 10.0 | 69.7 | 2.8 | 2.8 | |||
| 10.0 | - | 10.8 | 59.5 | 1.8 | 2.4 | |||
| 10.8 | - | 11.6 | 48.3 | 1.7 | 2.0 | |||
| 11.6 | - | 12.4 | 42.3 | 1.6 | 1.5 | |||
| 12.4 | - | 13.2 | 35.6 | 1.5 | 1.2 | |||
| 13.2 | - | 14.0 | 28.1 | 1.3 | 1.0 | |||
| 14.0 | - | 14.8 | 26.3 | 1.3 | 0.9 | |||
| 14.8 | - | 15.6 | 19.3 | 1.1 | 0.7 | |||
| 15.6 | - | 16.4 | 14.9 | 1.0 | 0.5 | |||
| 16.4 | - | 17.2 | 11.3 | 0.9 | 0.4 | |||
| 17.2 | - | 18.0 | 8.8 | 0.8 | 0.3 | |||
| 18.0 | - | 18.8 | 7.1 | 0.7 | 0.3 | |||
| 18.8 | - | 19.6 | 4.7 | 0.6 | 0.2 | |||
| 19.6 | - | 20.4 | 4.4 | 0.6 | 0.2 | |||
| 20.4 | - | 21.2 | 2.7 | 0.5 | 0.1 | |||
| 21.2 | - | 22.0 | 1.8 | 0.4 | 0.1 | |||
| 40 | - | 60 | 0.2 | - | 0.3 | 39.9 | 2.2 | 3.2 |
|---|---|---|---|---|---|---|---|---|
| 0.3 | - | 0.4 | 51.3 | 2.6 | 3.4 | |||
| 0.4 | - | 0.5 | 70.3 | 3.2 | 4.6 | |||
| 0.5 | - | 0.6 | 77.6 | 2.9 | 5.1 | |||
| 0.6 | - | 0.7 | 95.0 | 3.2 | 6.2 | |||
| 0.7 | - | 0.8 | 107.3 | 3.5 | 6.8 | |||
| 0.8 | - | 0.9 | 121.5 | 3.7 | 7.6 | |||
| 0.9 | - | 1.0 | 138.1 | 3.9 | 8.7 | |||
| 1.0 | - | 1.2 | 161.9 | 5.6 | 6.8 | |||
| 1.2 | - | 1.4 | 159.8 | 7.1 | 5.9 | |||
| 1.4 | - | 1.6 | 176.8 | 7.8 | 7.0 | |||
| 1.6 | - | 1.8 | 177.0 | 7.5 | 6.4 | |||
| 1.8 | - | 2.0 | 190.1 | 7.8 | 6.5 | |||
| 2.0 | - | 2.2 | 208.4 | 7.8 | 7.1 | |||
| 2.2 | - | 2.4 | 229.8 | 8.3 | 8.4 | |||
| 2.4 | - | 2.6 | 207.2 | 7.8 | 7.5 | |||
| 2.6 | - | 2.8 | 219.9 | 8.1 | 7.6 | |||
| 2.8 | - | 3.0 | 218.7 | 8.1 | 7.1 | |||
| 3.0 | - | 3.2 | 227.4 | 8.1 | 7.3 | |||
| 3.2 | - | 3.4 | 232.9 | 8.3 | 7.6 | |||
| 3.4 | - | 3.6 | 235.4 | 8.3 | 6.8 | |||
| 3.6 | - | 3.8 | 224.1 | 8.2 | 6.6 | |||
| 3.8 | - | 4.0 | 224.8 | 8.1 | 6.5 | |||
| 4.0 | - | 4.2 | 211.8 | 7.8 | 6.3 | |||
| 4.2 | - | 4.4 | 196.4 | 7.3 | 5.5 | |||
| 4.4 | - | 4.6 | 204.3 | 7.7 | 5.8 | |||
| 4.6 | - | 4.8 | 202.9 | 7.8 | 5.5 | |||
| 4.8 | - | 5.0 | 194.7 | 7.8 | 5.0 | |||
| 5.0 | - | 5.2 | 189.1 | 7.4 | 5.2 | |||
| 5.2 | - | 5.6 | 169.9 | 5.0 | 4.6 | |||
| 5.6 | - | 6.0 | 156.6 | 4.9 | 4.2 | |||
| 6.0 | - | 6.4 | 143.4 | 4.5 | 3.7 | |||
| 6.4 | - | 6.8 | 125.4 | 4.3 | 3.3 | |||
| 6.8 | - | 7.2 | 121.2 | 4.2 | 3.1 | |||
| 7.2 | - | 7.6 | 108.0 | 3.6 | 2.8 | |||
| 7.6 | - | 8.0 | 104.2 | 3.4 | 2.7 | |||
| 8.0 | - | 8.4 | 82.7 | 2.9 | 2.2 | |||
| 8.4 | - | 8.8 | 81.0 | 2.9 | 2.2 | |||
| 8.8 | - | 9.2 | 71.1 | 2.7 | 1.9 | |||
| 9.2 | - | 9.6 | 66.6 | 2.6 | 1.8 | |||
| 9.6 | - | 10.0 | 53.8 | 2.2 | 1.4 | |||
| 10.0 | - | 10.8 | 47.5 | 1.5 | 1.3 | |||
| 10.8 | - | 11.6 | 36.3 | 1.2 | 1.0 | |||
| 11.6 | - | 12.4 | 30.9 | 1.2 | 0.9 | |||
| 12.4 | - | 13.2 | 23.5 | 1.0 | 0.7 | |||
| 13.2 | - | 14.0 | 17.4 | 1.0 | 0.5 | |||
| 14.0 | - | 14.8 | 13.2 | 0.8 | 0.4 | |||
| 14.8 | - | 15.6 | 8.0 | 0.6 | 0.2 | |||
| 15.6 | - | 16.4 | 7.6 | 0.6 | 0.2 | |||
| 16.4 | - | 17.2 | 5.1 | 0.5 | 0.2 | |||
| 17.2 | - | 18.0 | 3.3 | 0.4 | 0.1 | |||
| 18.0 | - | 18.8 | 2.2 | 0.3 | 0.1 | |||
| 18.8 | - | 19.6 | 1.8 | 0.3 | 0.1 | |||
| 19.6 | - | 20.4 | 1.2 | 0.3 | 0.04 | |||
| 60 | - | 100 | 0.2 | - | 0.3 | 57.2 | 1.9 | 3.6 |
|---|---|---|---|---|---|---|---|---|
| 0.3 | - | 0.4 | 80.3 | 2.5 | 4.2 | |||
| 0.4 | - | 0.5 | 107.6 | 3.3 | 5.5 | |||
| 0.5 | - | 0.6 | 128.8 | 3.2 | 6.3 | |||
| 0.6 | - | 0.7 | 153.8 | 3.3 | 7.4 | |||
| 0.7 | - | 0.8 | 172.8 | 3.5 | 8.1 | |||
| 0.8 | - | 0.9 | 182.7 | 3.6 | 8.5 | |||
| 0.9 | - | 1.0 | 207.7 | 3.9 | 9.8 | |||
| 1.0 | - | 1.2 | 254.1 | 6.5 | 10.4 | |||
| 1.2 | - | 1.4 | 249.5 | 6.2 | 9.3 | |||
| 1.4 | - | 1.6 | 267.7 | 8.0 | 10.0 | |||
| 1.6 | - | 1.8 | 280.6 | 7.8 | 9.7 | |||
| 1.8 | - | 2.0 | 273.7 | 7.5 | 9.9 | |||
| 2.0 | - | 2.2 | 300.4 | 8.2 | 9.8 | |||
| 2.2 | - | 2.4 | 289.0 | 7.9 | 9.4 | |||
| 2.4 | - | 2.6 | 286.6 | 7.7 | 9.4 | |||
| 2.6 | - | 2.8 | 283.3 | 7.6 | 8.7 | |||
| 2.8 | - | 3.0 | 268.6 | 7.4 | 8.4 | |||
| 3.0 | - | 3.2 | 264.8 | 6.8 | 8.0 | |||
| 3.2 | - | 3.4 | 267.3 | 6.7 | 7.7 | |||
| 3.4 | - | 3.6 | 251.8 | 6.3 | 7.3 | |||
| 3.6 | - | 3.8 | 233.2 | 5.9 | 6.6 | |||
| 3.8 | - | 4.0 | 231.4 | 5.7 | 6.6 | |||
| 4.0 | - | 4.2 | 226.8 | 5.6 | 6.4 | |||
| 4.2 | - | 4.4 | 213.1 | 5.3 | 6.0 | |||
| 4.4 | - | 4.6 | 202.8 | 5.1 | 5.6 | |||
| 4.6 | - | 4.8 | 181.2 | 4.7 | 5.0 | |||
| 4.8 | - | 5.0 | 165.4 | 4.4 | 4.6 | |||
| 5.0 | - | 5.2 | 154.4 | 4.3 | 4.3 | |||
| 5.2 | - | 5.6 | 140.0 | 2.8 | 3.9 | |||
| 5.6 | - | 6.0 | 126.5 | 2.6 | 3.4 | |||
| 6.0 | - | 6.4 | 106.6 | 2.4 | 2.9 | |||
| 6.4 | - | 6.8 | 93.5 | 2.2 | 2.6 | |||
| 6.8 | - | 7.2 | 78.6 | 2.1 | 2.1 | |||
| 7.2 | - | 7.6 | 67.1 | 1.9 | 1.8 | |||
| 7.6 | - | 8.0 | 60.2 | 1.9 | 1.6 | |||
| 8.0 | - | 8.4 | 52.1 | 1.7 | 1.3 | |||
| 8.4 | - | 8.8 | 42.0 | 1.5 | 1.1 | |||
| 8.8 | - | 9.2 | 36.7 | 1.4 | 1.0 | |||
| 9.2 | - | 9.6 | 32.6 | 1.4 | 0.9 | |||
| 9.6 | - | 10.0 | 27.2 | 1.3 | 0.7 | |||
| 10.0 | - | 10.8 | 19.6 | 0.8 | 0.5 | |||
| 10.8 | - | 11.6 | 14.4 | 0.6 | 0.4 | |||
| 11.6 | - | 12.4 | 9.0 | 0.5 | 0.2 | |||
| 12.4 | - | 13.2 | 7.1 | 0.5 | 0.2 | |||
| 13.2 | - | 14.0 | 4.6 | 0.4 | 0.1 | |||
| 14.0 | - | 14.8 | 3.1 | 0.3 | 0.1 | |||
| 14.8 | - | 15.6 | 1.6 | 0.2 | 0.05 | |||
| 15.6 | - | 16.4 | 1.0 | 0.2 | 0.03 | |||
| 16.4 | - | 17.2 | 0.8 | 0.2 | 0.02 | |||
| 17.2 | - | 18.0 | 0.4 | 0.1 | 0.01 | |||
| 100 | - | 140 | 0.2 | - | 0.3 | 76.5 | 2.9 | 4.9 |
|---|---|---|---|---|---|---|---|---|
| 0.3 | - | 0.4 | 118.4 | 3.9 | 6.5 | |||
| 0.4 | - | 0.5 | 158.5 | 4.5 | 8.5 | |||
| 0.5 | - | 0.6 | 183.3 | 4.0 | 9.4 | |||
| 0.6 | - | 0.7 | 217.2 | 4.4 | 10.7 | |||
| 0.7 | - | 0.8 | 238.1 | 4.4 | 11.5 | |||
| 0.8 | - | 0.9 | 267.8 | 4.7 | 13.0 | |||
| 0.9 | - | 1.0 | 292.6 | 4.9 | 14.8 | |||
| 1.0 | - | 1.2 | 318.6 | 13.2 | 13.1 | |||
| 1.2 | - | 1.4 | 354.2 | 10.5 | 13.2 | |||
| 1.4 | - | 1.6 | 359.0 | 10.7 | 13.4 | |||
| 1.6 | - | 1.8 | 334.2 | 10.3 | 11.7 | |||
| 1.8 | - | 2.0 | 346.2 | 10.0 | 12.0 | |||
| 2.0 | - | 2.2 | 332.6 | 8.9 | 10.5 | |||
| 2.2 | - | 2.4 | 328.6 | 8.2 | 10.8 | |||
| 2.4 | - | 2.6 | 284.2 | 7.0 | 8.7 | |||
| 2.6 | - | 2.8 | 275.7 | 6.8 | 8.9 | |||
| 2.8 | - | 3.0 | 259.4 | 6.5 | 7.3 | |||
| 3.0 | - | 3.2 | 226.3 | 6.1 | 6.8 | |||
| 3.2 | - | 3.4 | 218.6 | 5.9 | 6.3 | |||
| 3.4 | - | 3.6 | 186.4 | 5.5 | 5.5 | |||
| 3.6 | - | 3.8 | 167.8 | 5.1 | 4.7 | |||
| 3.8 | - | 4.0 | 164.1 | 5.2 | 4.7 | |||
| 4.0 | - | 4.2 | 144.0 | 4.8 | 4.2 | |||
| 4.2 | - | 4.4 | 137.7 | 4.8 | 3.8 | |||
| 4.4 | - | 4.6 | 118.4 | 4.3 | 3.3 | |||
| 4.6 | - | 4.8 | 105.2 | 4.1 | 2.8 | |||
| 4.8 | - | 5.0 | 87.2 | 3.6 | 2.4 | |||
| 5.0 | - | 5.2 | 93.3 | 4.1 | 2.5 | |||
| 5.2 | - | 5.6 | 77.3 | 2.6 | 2.0 | |||
| 5.6 | - | 6.0 | 57.6 | 2.1 | 1.5 | |||
| 6.0 | - | 6.4 | 45.9 | 1.9 | 1.2 | |||
| 6.4 | - | 6.8 | 36.3 | 1.7 | 1.0 | |||
| 6.8 | - | 7.2 | 30.6 | 1.6 | 0.8 | |||
| 7.2 | - | 7.6 | 25.0 | 1.5 | 0.6 | |||
| 7.6 | - | 8.0 | 17.9 | 1.2 | 0.5 | |||
| 8.0 | - | 8.4 | 14.1 | 1.0 | 0.4 | |||
| 8.4 | - | 8.8 | 12.9 | 1.1 | 0.3 | |||
| 8.8 | - | 9.2 | 9.1 | 0.9 | 0.2 | |||
| 9.2 | - | 9.6 | 5.9 | 0.7 | 0.1 | |||
| 9.6 | - | 10.0 | 4.7 | 0.6 | 0.1 | |||
| 10.0 | - | 10.8 | 3.3 | 0.4 | 0.1 | |||
| 10.8 | - | 11.6 | 2.2 | 0.3 | 0.1 | |||
| 11.6 | - | 12.4 | 0.7 | 0.1 | 0.02 | |||
| 12.4 | - | 13.2 | 0.4 | 0.1 | 0.01 | |||
| 13.2 | - | 14.0 | 0.2 | 0.1 | 0.01 | |||
| 140 | - | 180 | 0.2 | - | 0.3 | 105.0 | 4.2 | 6.3 |
|---|---|---|---|---|---|---|---|---|
| 0.3 | - | 0.4 | 146.5 | 4.7 | 7.5 | |||
| 0.4 | - | 0.5 | 190.9 | 4.2 | 9.4 | |||
| 0.5 | - | 0.6 | 240.2 | 4.5 | 12.0 | |||
| 0.6 | - | 0.7 | 270.5 | 4.8 | 12.7 | |||
| 0.7 | - | 0.8 | 311.2 | 5.1 | 14.9 | |||
| 0.8 | - | 0.9 | 319.7 | 5.0 | 14.8 | |||
| 0.9 | - | 1.0 | 345.5 | 5.2 | 15.6 | |||
| 1.0 | - | 1.2 | 340.6 | 23.7 | 16.5 | |||
| 1.2 | - | 1.4 | 362.3 | 50.7 | 19.2 | |||
| 1.4 | - | 1.6 | 402.1 | 19.2 | 31.0 | |||
| 1.6 | - | 1.8 | 365.1 | 12.2 | 27.6 | |||
| 1.8 | - | 2.0 | 305.4 | 9.5 | 15.4 | |||
| 2.0 | - | 2.2 | 308.1 | 9.4 | 9.7 | |||
| 2.2 | - | 2.4 | 259.9 | 8.4 | 7.7 | |||
| 2.4 | - | 2.6 | 219.8 | 7.7 | 6.6 | |||
| 2.6 | - | 2.8 | 216.5 | 8.1 | 6.6 | |||
| 2.8 | - | 3.0 | 172.6 | 6.9 | 5.2 | |||
| 3.0 | - | 3.2 | 156.1 | 6.6 | 5.0 | |||
| 3.2 | - | 3.4 | 133.9 | 6.0 | 3.9 | |||
| 3.4 | - | 3.6 | 124.7 | 5.8 | 3.5 | |||
| 3.6 | - | 3.8 | 98.3 | 5.1 | 2.9 | |||
| 3.8 | - | 4.0 | 100.3 | 5.3 | 2.9 | |||
| 4.0 | - | 4.2 | 81.5 | 4.7 | 2.3 | |||
| 4.2 | - | 4.4 | 74.3 | 4.5 | 2.2 | |||
| 4.4 | - | 4.6 | 59.1 | 4.0 | 1.6 | |||
| 4.6 | - | 4.8 | 50.1 | 3.8 | 1.6 | |||
| 4.8 | - | 5.0 | 41.8 | 3.4 | 1.0 | |||
| 5.0 | - | 5.2 | 43.9 | 3.6 | 1.2 | |||
| 5.2 | - | 5.6 | 30.3 | 2.0 | 0.9 | |||
| 5.6 | - | 6.0 | 20.9 | 1.7 | 0.6 | |||
| 6.0 | - | 6.4 | 14.9 | 1.3 | 0.4 | |||
| 6.4 | - | 6.8 | 12.5 | 1.3 | 0.3 | |||
| 6.8 | - | 7.2 | 9.9 | 1.3 | 0.2 | |||
| 7.2 | - | 7.6 | 6.4 | 0.9 | 0.2 | |||
| 7.6 | - | 8.0 | 4.3 | 0.7 | 0.1 | |||
| 8.0 | - | 8.4 | 4.2 | 0.8 | 0.2 | |||
| 8.4 | - | 8.8 | 2.3 | 0.6 | 0.1 | |||
| 8.8 | - | 9.2 | 2.3 | 0.6 | 0.1 | |||
| 9.2 | - | 9.6 | 0.9 | 0.4 | 0.02 | |||
| 9.6 | - | 10.0 | 0.7 | 0.3 | 0.02 | |||
| 10.0 | - | 10.8 | 0.2 | 0.2 | 0.01 | |||
| 180 | - | 240 | 0.2 | - | 0.3 | 133.0 | 3.2 | 7.6 |
|---|---|---|---|---|---|---|---|---|
| 0.3 | - | 0.4 | 183.3 | 3.4 | 9.5 | |||
| 0.4 | - | 0.5 | 243.5 | 3.7 | 12.5 | |||
| 0.5 | - | 0.6 | 284.7 | 4.0 | 14.2 | |||
| 0.6 | - | 0.7 | 327.3 | 4.3 | 16.3 | |||
| 0.7 | - | 0.8 | 340.7 | 4.3 | 16.3 | |||
| 0.8 | - | 0.9 | 374.5 | 4.6 | 18.1 | |||
| 0.9 | - | 1.0 | 368.3 | 4.6 | 22.3 | |||
| 1.0 | - | 1.2 | 395.9 | 18.9 | 18.1 | |||
| 1.2 | - | 1.4 | 366.8 | 13.7 | 14.4 | |||
| 1.4 | - | 1.6 | 310.0 | 12.0 | 11.3 | |||
| 1.6 | - | 1.8 | 271.0 | 11.2 | 9.1 | |||
| 1.8 | - | 2.0 | 256.4 | 10.7 | 8.3 | |||
| 2.0 | - | 2.2 | 196.9 | 9.0 | 5.8 | |||
| 2.2 | - | 2.4 | 181.8 | 8.1 | 6.7 | |||
| 2.4 | - | 2.6 | 145.3 | 6.8 | 4.4 | |||
| 2.6 | - | 2.8 | 119.0 | 5.8 | 3.5 | |||
| 2.8 | - | 3.0 | 104.2 | 5.5 | 3.4 | |||
| 3.0 | - | 3.2 | 84.6 | 4.8 | 2.7 | |||
| 3.2 | - | 3.4 | 71.6 | 4.4 | 2.7 | |||
| 3.4 | - | 3.6 | 66.4 | 4.3 | 1.8 | |||
| 3.6 | - | 3.8 | 47.6 | 3.5 | 1.7 | |||
| 3.8 | - | 4.0 | 43.4 | 3.4 | 1.7 | |||
| 4.0 | - | 4.2 | 29.2 | 2.6 | 1.1 | |||
| 4.2 | - | 4.4 | 30.0 | 2.8 | 0.9 | |||
| 4.4 | - | 4.6 | 26.4 | 2.7 | 0.9 | |||
| 4.6 | - | 4.8 | 20.8 | 2.3 | 0.5 | |||
| 4.8 | - | 5.0 | 18.5 | 2.3 | 0.4 | |||
| 5.0 | - | 5.2 | 14.4 | 1.9 | 0.5 | |||
| 5.2 | - | 5.6 | 12.0 | 1.3 | 0.3 | |||
| 5.6 | - | 6.0 | 6.0 | 0.8 | 0.2 | |||
| 6.0 | - | 6.4 | 4.7 | 0.7 | 0.1 | |||
| 6.4 | - | 6.8 | 2.4 | 0.5 | 0.1 | |||
| 6.8 | - | 7.2 | 0.8 | 0.2 | 0.02 | |||
| 7.2 | - | 7.6 | 1.7 | 0.5 | 0.05 | |||
| 7.6 | - | 8.0 | 1.3 | 0.5 | 0.04 | |||
| 240 | - | 300 | 0.2 | - | 0.3 | 146.4 | 3.5 | 8.6 |
| 0.3 | - | 0.4 | 226.0 | 4.1 | 12.4 | |||
| 0.4 | - | 0.5 | 284.4 | 4.5 | 15.4 | |||
| 0.5 | - | 0.6 | 323.6 | 4.7 | 17.1 | |||
| 0.6 | - | 0.7 | 343.8 | 4.9 | 17.9 | |||
| 0.7 | - | 0.8 | 353.3 | 5.0 | 18.2 | |||
| 0.8 | - | 0.9 | 352.7 | 5.0 | 18.0 | |||
| 0.9 | - | 1.0 | 357.2 | 5.1 | 18.6 | |||
| 1.0 | - | 1.2 | 351.9 | 13.3 | 13.4 | |||
| 1.2 | - | 1.4 | 283.2 | 11.7 | 10.1 | |||
| 1.4 | - | 1.6 | 229.7 | 10.1 | 7.3 | |||
| 1.6 | - | 1.8 | 211.2 | 10.1 | 7.7 | |||
| 1.8 | - | 2.0 | 162.9 | 8.5 | 5.9 | |||
| 2.0 | - | 2.2 | 132.8 | 7.8 | 5.0 | |||
| 2.2 | - | 2.4 | 118.2 | 7.7 | 3.9 | |||
| 2.4 | - | 2.6 | 81.0 | 6.1 | 3.0 | |||
| 2.6 | - | 2.8 | 60.9 | 5.1 | 2.3 | |||
| 2.8 | - | 3.0 | 68.2 | 6.2 | 2.6 | |||
| 3.0 | - | 3.2 | 40.2 | 4.5 | 1.5 | |||
| 3.2 | - | 3.4 | 29.3 | 3.5 | 1.1 | |||
| 3.4 | - | 3.6 | 26.1 | 3.4 | 1.1 | |||
| 3.6 | - | 3.8 | 14.8 | 2.5 | 0.8 | |||
| 3.8 | - | 4.0 | 14.5 | 2.6 | 0.7 | |||
| 4.0 | - | 4.2 | 9.9 | 2.1 | 0.6 | |||
| 4.2 | - | 4.4 | 9.8 | 2.5 | 0.3 | |||
| 4.4 | - | 4.6 | 8.3 | 2.0 | 0.2 | |||
| 4.6 | - | 4.8 | 3.3 | 1.1 | 0.1 | |||
| 4.8 | - | 5.0 | 3.0 | 1.2 | 0.1 | |||
| 300 | - | 360 | 0.2 | - | 0.3 | 192.7 | 6.2 | 10.5 |
|---|---|---|---|---|---|---|---|---|
| 0.3 | - | 0.4 | 267.9 | 7.1 | 13.5 | |||
| 0.4 | - | 0.5 | 274.7 | 5.0 | 13.8 | |||
| 0.5 | - | 0.6 | 319.1 | 5.4 | 15.4 | |||
| 0.6 | - | 0.7 | 334.3 | 5.5 | 16.0 | |||
| 0.7 | - | 0.8 | 340.2 | 5.6 | 16.3 | |||
| 0.8 | - | 0.9 | 323.5 | 5.5 | 18.1 | |||
| 0.9 | - | 1.0 | 303.9 | 5.4 | 18.6 | |||
| 1.0 | - | 1.2 | 259.8 | 12.8 | 9.8 | |||
| 1.2 | - | 1.4 | 249.0 | 13.5 | 8.6 | |||
| 1.4 | - | 1.6 | 186.2 | 12.3 | 5.9 | |||
| 1.6 | - | 1.8 | 149.2 | 12.5 | 5.0 | |||
| 1.8 | - | 2.0 | 102.3 | 10.4 | 3.8 | |||
| 2.0 | - | 2.2 | 76.7 | 9.8 | 3.2 | |||
| 2.2 | - | 2.4 | 55.6 | 9.7 | 2.0 | |||
| 2.4 | - | 2.6 | 39.2 | 8.2 | 1.6 | |||
| 2.6 | - | 2.8 | 29.4 | 8.2 | 1.4 | |||
| 2.8 | - | 3.0 | 23.0 | 8.9 | 2.0 | |||
| 360 | - | 420 | 0.2 | - | 0.3 | 190.5 | 6.5 | 11.1 |
| 0.3 | - | 0.4 | 250.0 | 7.2 | 14.0 | |||
| 0.4 | - | 0.5 | 303.2 | 8.0 | 16.6 | |||
| 0.5 | - | 0.6 | 305.5 | 8.0 | 16.3 | |||
| 0.6 | - | 0.7 | 305.0 | 8.1 | 15.9 | |||
| 0.7 | - | 0.8 | 311.3 | 8.4 | 15.7 | |||
| 0.8 | - | 0.9 | 283.4 | 8.2 | 14.2 | |||
| 0.9 | - | 1.0 | 244.7 | 7.5 | 11.9 | |||
| 0 | - | 10 | 0.3 | - | 0.4 | 5.0 | 0.8 | 0.4 |
|---|---|---|---|---|---|---|---|---|
| 0.4 | - | 0.5 | 6.6 | 1.0 | 0.6 | |||
| 0.5 | - | 0.6 | 9.3 | 1.3 | 0.7 | |||
| 0.6 | - | 0.7 | 8.0 | 1.1 | 0.6 | |||
| 0.7 | - | 0.8 | 8.7 | 1.0 | 0.7 | |||
| 0.8 | - | 0.9 | 10.2 | 1.2 | 0.9 | |||
| 0.9 | - | 1.0 | 10.8 | 1.2 | 0.9 | |||
| 1.0 | - | 1.2 | 11.3 | 0.9 | 0.9 | |||
| 1.2 | - | 1.4 | 13.1 | 1.0 | 1.0 | |||
| 1.4 | - | 1.6 | 15.7 | 1.1 | 1.2 | |||
| 1.6 | - | 1.8 | 15.2 | 1.0 | 1.0 | |||
| 1.8 | - | 2.0 | 16.1 | 1.1 | 1.0 | |||
| 2.0 | - | 2.2 | 14.9 | 1.0 | 1.0 | |||
| 2.2 | - | 2.4 | 17.8 | 1.1 | 1.1 | |||
| 2.4 | - | 2.6 | 20.7 | 1.3 | 1.2 | |||
| 2.6 | - | 2.8 | 18.6 | 1.2 | 1.1 | |||
| 2.8 | - | 3.2 | 18.9 | 0.8 | 1.2 | |||
| 3.2 | - | 3.6 | 15.9 | 0.9 | 0.9 | |||
| 3.6 | - | 4.0 | 19.3 | 0.8 | 1.1 | |||
| 4.0 | - | 4.4 | 18.8 | 0.8 | 1.0 | |||
| 4.4 | - | 4.8 | 17.5 | 0.8 | 0.9 | |||
| 4.8 | - | 5.2 | 18.7 | 0.8 | 1.0 | |||
| 5.2 | - | 5.6 | 17.4 | 0.8 | 0.9 | |||
| 5.6 | - | 6.0 | 15.9 | 0.8 | 0.9 | |||
| 6.0 | - | 6.4 | 18.1 | 0.9 | 1.0 | |||
| 6.4 | - | 6.8 | 17.6 | 0.8 | 1.1 | |||
| 6.8 | - | 7.2 | 17.6 | 0.8 | 1.1 | |||
| 7.2 | - | 7.6 | 15.5 | 0.8 | 1.0 | |||
| 7.6 | - | 8.0 | 13.2 | 0.7 | 0.8 | |||
| 8.0 | - | 8.4 | 13.2 | 0.8 | 0.8 | |||
| 8.4 | - | 8.8 | 13.0 | 0.8 | 0.8 | |||
| 8.8 | - | 9.2 | 12.8 | 0.8 | 0.8 | |||
| 9.2 | - | 9.6 | 11.0 | 0.8 | 0.7 | |||
| 9.6 | - | 10.0 | 10.9 | 0.9 | 0.7 | |||
| 10.0 | - | 10.8 | 11.4 | 0.6 | 0.7 | |||
| 10.8 | - | 11.6 | 9.3 | 0.6 | 0.5 | |||
| 11.6 | - | 12.4 | 9.7 | 0.7 | 0.6 | |||
| 12.4 | - | 13.2 | 7.7 | 0.6 | 0.4 | |||
| 13.2 | - | 14.0 | 6.0 | 0.6 | 0.4 | |||
| 14.0 | - | 14.8 | 5.7 | 0.7 | 0.4 | |||
| 14.8 | - | 15.6 | 4.4 | 0.6 | 0.3 | |||
| 15.6 | - | 16.4 | 4.6 | 0.8 | 0.3 | |||
| 10 | - | 20 | 0.2 | - | 0.3 | 9.1 | 1.2 | 0.7 |
|---|---|---|---|---|---|---|---|---|
| 0.3 | - | 0.4 | 17.0 | 2.2 | 1.2 | |||
| 0.4 | - | 0.5 | 17.2 | 1.7 | 1.2 | |||
| 0.5 | - | 0.6 | 21.4 | 1.7 | 1.4 | |||
| 0.6 | - | 0.7 | 25.0 | 1.9 | 2.0 | |||
| 0.7 | - | 0.8 | 26.5 | 1.9 | 2.1 | |||
| 0.8 | - | 0.9 | 31.4 | 2.1 | 2.5 | |||
| 0.9 | - | 1.0 | 33.7 | 2.1 | 2.5 | |||
| 1.0 | - | 1.2 | 34.1 | 1.5 | 2.5 | |||
| 1.2 | - | 1.4 | 37.5 | 1.6 | 2.6 | |||
| 1.4 | - | 1.6 | 41.8 | 1.6 | 2.8 | |||
| 1.6 | - | 1.8 | 46.7 | 1.8 | 2.9 | |||
| 1.8 | - | 2.0 | 47.3 | 1.8 | 2.9 | |||
| 2.0 | - | 2.2 | 46.5 | 2.0 | 2.5 | |||
| 2.2 | - | 2.4 | 45.5 | 2.1 | 2.5 | |||
| 2.4 | - | 2.6 | 54.0 | 1.9 | 2.8 | |||
| 2.6 | - | 2.8 | 57.4 | 2.0 | 3.0 | |||
| 2.8 | - | 3.2 | 49.4 | 1.5 | 2.5 | |||
| 3.2 | - | 3.6 | 48.9 | 1.5 | 2.4 | |||
| 3.6 | - | 4.0 | 49.9 | 1.6 | 2.3 | |||
| 4.0 | - | 4.4 | 52.8 | 1.7 | 2.3 | |||
| 4.4 | - | 4.8 | 49.5 | 1.8 | 2.2 | |||
| 4.8 | - | 5.2 | 50.2 | 1.9 | 2.2 | |||
| 5.2 | - | 5.6 | 44.5 | 1.7 | 1.8 | |||
| 5.6 | - | 6.0 | 45.1 | 1.8 | 1.8 | |||
| 6.0 | - | 6.4 | 40.4 | 1.6 | 1.6 | |||
| 6.4 | - | 6.8 | 40.6 | 1.7 | 1.6 | |||
| 6.8 | - | 7.2 | 41.6 | 1.8 | 1.6 | |||
| 7.2 | - | 7.6 | 36.7 | 1.6 | 1.4 | |||
| 7.6 | - | 8.0 | 33.9 | 1.6 | 1.3 | |||
| 8.0 | - | 8.4 | 36.2 | 1.6 | 1.4 | |||
| 8.4 | - | 8.8 | 33.1 | 1.6 | 1.2 | |||
| 8.8 | - | 9.2 | 30.1 | 1.5 | 1.1 | |||
| 9.2 | - | 9.6 | 26.0 | 1.4 | 1.0 | |||
| 9.6 | - | 10.0 | 25.4 | 1.4 | 1.0 | |||
| 10.0 | - | 10.8 | 24.2 | 1.0 | 0.9 | |||
| 10.8 | - | 11.6 | 19.7 | 0.8 | 0.8 | |||
| 11.6 | - | 12.4 | 18.1 | 0.8 | 0.7 | |||
| 12.4 | - | 13.2 | 14.3 | 0.8 | 0.5 | |||
| 13.2 | - | 14.0 | 13.3 | 0.8 | 0.5 | |||
| 14.0 | - | 14.8 | 10.4 | 0.7 | 0.4 | |||
| 14.8 | - | 15.6 | 8.8 | 0.7 | 0.3 | |||
| 15.6 | - | 16.4 | 8.6 | 0.7 | 0.3 | |||
| 16.4 | - | 17.2 | 7.4 | 0.6 | 0.3 | |||
| 17.2 | - | 18.0 | 5.5 | 0.6 | 0.2 | |||
| 18.0 | - | 18.8 | 3.7 | 0.5 | 0.1 | |||
| 18.8 | - | 19.6 | 3.7 | 0.5 | 0.2 | |||
| 19.6 | - | 20.4 | 1.9 | 0.3 | 0.1 | |||
| 20.4 | - | 21.2 | 1.7 | 0.3 | 0.1 | |||
| 20 | - | 40 | 0.2 | - | 0.3 | 15.9 | 1.1 | 1.2 |
|---|---|---|---|---|---|---|---|---|
| 0.3 | - | 0.4 | 23.2 | 1.7 | 1.6 | |||
| 0.4 | - | 0.5 | 34.8 | 1.8 | 2.5 | |||
| 0.5 | - | 0.6 | 43.8 | 1.8 | 3.3 | |||
| 0.6 | - | 0.7 | 54.3 | 2.0 | 4.0 | |||
| 0.7 | - | 0.8 | 54.2 | 1.9 | 4.0 | |||
| 0.8 | - | 0.9 | 59.7 | 2.0 | 4.6 | |||
| 0.9 | - | 1.0 | 59.4 | 2.0 | 4.6 | |||
| 1.0 | - | 1.2 | 64.9 | 1.6 | 4.8 | |||
| 1.2 | - | 1.4 | 72.4 | 1.7 | 5.0 | |||
| 1.4 | - | 1.6 | 77.1 | 1.8 | 5.3 | |||
| 1.6 | - | 1.8 | 83.5 | 1.8 | 5.5 | |||
| 1.8 | - | 2.0 | 88.3 | 1.8 | 5.4 | |||
| 2.0 | - | 2.2 | 88.6 | 1.9 | 5.3 | |||
| 2.2 | - | 2.4 | 91.4 | 1.9 | 5.3 | |||
| 2.4 | - | 2.6 | 94.5 | 2.0 | 5.2 | |||
| 2.6 | - | 2.8 | 98.7 | 2.2 | 5.3 | |||
| 2.8 | - | 3.2 | 97.9 | 1.7 | 5.1 | |||
| 3.2 | - | 3.6 | 95.1 | 1.9 | 4.8 | |||
| 3.6 | - | 4.0 | 92.4 | 1.9 | 4.3 | |||
| 4.0 | - | 4.4 | 91.6 | 1.9 | 4.0 | |||
| 4.4 | - | 4.8 | 89.3 | 1.9 | 4.0 | |||
| 4.8 | - | 5.2 | 85.4 | 1.9 | 3.6 | |||
| 5.2 | - | 5.6 | 76.4 | 1.8 | 3.2 | |||
| 5.6 | - | 6.0 | 74.3 | 1.7 | 3.0 | |||
| 6.0 | - | 6.4 | 74.1 | 1.7 | 3.0 | |||
| 6.4 | - | 6.8 | 66.8 | 1.6 | 2.7 | |||
| 6.8 | - | 7.2 | 64.3 | 1.5 | 2.5 | |||
| 7.2 | - | 7.6 | 58.5 | 1.5 | 2.3 | |||
| 7.6 | - | 8.0 | 53.0 | 1.4 | 2.0 | |||
| 8.0 | - | 8.4 | 48.4 | 1.3 | 1.8 | |||
| 8.4 | - | 8.8 | 45.4 | 1.3 | 1.7 | |||
| 8.8 | - | 9.2 | 42.9 | 1.3 | 1.6 | |||
| 9.2 | - | 9.6 | 36.1 | 1.2 | 1.3 | |||
| 9.6 | - | 10.0 | 37.1 | 1.2 | 1.4 | |||
| 10.0 | - | 10.8 | 30.0 | 0.7 | 1.1 | |||
| 10.8 | - | 11.6 | 22.6 | 0.6 | 0.8 | |||
| 11.6 | - | 12.4 | 19.5 | 0.6 | 0.7 | |||
| 12.4 | - | 13.2 | 15.6 | 0.6 | 0.5 | |||
| 13.2 | - | 14.0 | 12.5 | 0.5 | 0.4 | |||
| 14.0 | - | 14.8 | 9.6 | 0.4 | 0.3 | |||
| 14.8 | - | 15.6 | 8.1 | 0.4 | 0.3 | |||
| 15.6 | - | 16.4 | 6.4 | 0.4 | 0.2 | |||
| 16.4 | - | 17.2 | 4.5 | 0.3 | 0.2 | |||
| 17.2 | - | 18.0 | 3.2 | 0.3 | 0.1 | |||
| 18.0 | - | 18.8 | 3.0 | 0.3 | 0.1 | |||
| 18.8 | - | 19.6 | 2.4 | 0.2 | 0.1 | |||
| 19.6 | - | 20.4 | 1.0 | 0.1 | 0.03 | |||
| 20.4 | - | 21.2 | 0.9 | 0.1 | 0.04 | |||
| 40 | - | 60 | 0.2 | - | 0.3 | 29.0 | 2.3 | 2.4 |
|---|---|---|---|---|---|---|---|---|
| 0.3 | - | 0.4 | 43.9 | 2.8 | 3.0 | |||
| 0.4 | - | 0.5 | 61.9 | 2.8 | 4.1 | |||
| 0.5 | - | 0.6 | 74.3 | 2.8 | 5.3 | |||
| 0.6 | - | 0.7 | 92.1 | 3.0 | 6.6 | |||
| 0.7 | - | 0.8 | 96.8 | 3.0 | 6.9 | |||
| 0.8 | - | 0.9 | 92.7 | 2.9 | 6.4 | |||
| 0.9 | - | 1.0 | 106.2 | 3.0 | 7.7 | |||
| 1.0 | - | 1.2 | 114.1 | 2.4 | 7.8 | |||
| 1.2 | - | 1.4 | 118.2 | 2.4 | 7.8 | |||
| 1.4 | - | 1.6 | 134.0 | 2.5 | 8.9 | |||
| 1.6 | - | 1.8 | 135.2 | 2.5 | 9.5 | |||
| 1.8 | - | 2.0 | 142.6 | 2.6 | 9.9 | |||
| 2.0 | - | 2.2 | 151.0 | 2.8 | 10.3 | |||
| 2.2 | - | 2.4 | 148.3 | 2.7 | 9.6 | |||
| 2.4 | - | 2.6 | 150.8 | 2.8 | 7.6 | |||
| 2.6 | - | 2.8 | 146.0 | 2.8 | 7.4 | |||
| 2.8 | - | 3.0 | 152.4 | 3.8 | 7.4 | |||
| 3.0 | - | 3.2 | 145.2 | 2.9 | 6.9 | |||
| 3.2 | - | 3.4 | 149.2 | 2.9 | 6.8 | |||
| 3.4 | - | 3.6 | 144.4 | 3.1 | 6.3 | |||
| 3.6 | - | 3.8 | 140.4 | 3.0 | 6.1 | |||
| 3.8 | - | 4.0 | 138.4 | 3.0 | 5.8 | |||
| 4.0 | - | 4.2 | 136.6 | 3.2 | 5.6 | |||
| 4.2 | - | 4.4 | 138.6 | 3.1 | 5.5 | |||
| 4.4 | - | 4.6 | 126.1 | 2.9 | 4.9 | |||
| 4.6 | - | 4.8 | 118.5 | 2.8 | 4.6 | |||
| 4.8 | - | 5.0 | 118.2 | 2.8 | 4.4 | |||
| 5.0 | - | 5.2 | 109.0 | 2.7 | 4.1 | |||
| 5.2 | - | 5.6 | 100.7 | 1.9 | 3.7 | |||
| 5.6 | - | 6.0 | 90.7 | 1.8 | 3.2 | |||
| 6.0 | - | 6.4 | 86.1 | 1.7 | 3.0 | |||
| 6.4 | - | 6.8 | 75.7 | 1.5 | 2.6 | |||
| 6.8 | - | 7.2 | 68.1 | 1.5 | 2.2 | |||
| 7.2 | - | 7.6 | 62.7 | 1.4 | 2.1 | |||
| 7.6 | - | 8.0 | 55.2 | 1.3 | 1.9 | |||
| 8.0 | - | 8.4 | 49.5 | 1.2 | 1.6 | |||
| 8.4 | - | 8.8 | 42.4 | 1.1 | 1.4 | |||
| 8.8 | - | 9.2 | 40.0 | 1.1 | 1.3 | |||
| 9.2 | - | 9.6 | 33.2 | 1.0 | 1.1 | |||
| 9.6 | - | 10.0 | 31.1 | 1.0 | 1.0 | |||
| 10.0 | - | 10.8 | 25.4 | 0.6 | 0.8 | |||
| 10.8 | - | 11.6 | 19.9 | 0.5 | 0.6 | |||
| 11.6 | - | 12.4 | 14.6 | 0.5 | 0.4 | |||
| 12.4 | - | 13.2 | 11.4 | 0.4 | 0.3 | |||
| 13.2 | - | 14.0 | 8.6 | 0.3 | 0.3 | |||
| 14.0 | - | 14.8 | 6.3 | 0.3 | 0.2 | |||
| 14.8 | - | 15.6 | 4.0 | 0.2 | 0.1 | |||
| 15.6 | - | 16.4 | 3.2 | 0.2 | 0.1 | |||
| 16.4 | - | 17.2 | 2.2 | 0.2 | 0.1 | |||
| 17.2 | - | 18.0 | 1.5 | 0.1 | 0.04 | |||
| 18.0 | - | 18.8 | 1.0 | 0.1 | 0.04 | |||
| 18.8 | - | 19.6 | 0.8 | 0.1 | 0.03 | |||
| 19.6 | - | 20.4 | 0.4 | 0.1 | 0.01 | |||
| 60 | - | 100 | 0.2 | - | 0.3 | 47.2 | 2.4 | 3.4 |
|---|---|---|---|---|---|---|---|---|
| 0.3 | - | 0.4 | 74.2 | 2.8 | 5.1 | |||
| 0.4 | - | 0.5 | 89.8 | 2.8 | 6.1 | |||
| 0.5 | - | 0.6 | 109.5 | 2.8 | 7.1 | |||
| 0.6 | - | 0.7 | 135.9 | 3.1 | 9.2 | |||
| 0.7 | - | 0.8 | 155.5 | 3.6 | 10.2 | |||
| 0.8 | - | 0.9 | 166.6 | 3.4 | 10.9 | |||
| 0.9 | - | 1.0 | 181.6 | 3.6 | 11.7 | |||
| 1.0 | - | 1.2 | 174.9 | 2.5 | 11.0 | |||
| 1.2 | - | 1.4 | 188.8 | 2.6 | 11.6 | |||
| 1.4 | - | 1.6 | 200.8 | 3.0 | 11.7 | |||
| 1.6 | - | 1.8 | 209.9 | 3.6 | 11.5 | |||
| 1.8 | - | 2.0 | 225.4 | 3.7 | 11.8 | |||
| 2.0 | - | 2.2 | 225.1 | 3.8 | 11.2 | |||
| 2.2 | - | 2.4 | 220.6 | 3.7 | 10.8 | |||
| 2.4 | - | 2.6 | 215.4 | 3.7 | 10.2 | |||
| 2.6 | - | 2.8 | 214.6 | 3.7 | 9.5 | |||
| 2.8 | - | 3.0 | 195.4 | 2.8 | 8.3 | |||
| 3.0 | - | 3.2 | 190.9 | 2.8 | 8.1 | |||
| 3.2 | - | 3.4 | 183.7 | 2.6 | 7.5 | |||
| 3.4 | - | 3.6 | 174.0 | 2.6 | 6.9 | |||
| 3.6 | - | 3.8 | 167.8 | 2.5 | 6.7 | |||
| 3.8 | - | 4.0 | 155.9 | 2.4 | 6.2 | |||
| 4.0 | - | 4.2 | 146.3 | 2.3 | 5.8 | |||
| 4.2 | - | 4.4 | 138.6 | 2.2 | 5.4 | |||
| 4.4 | - | 4.6 | 131.5 | 2.2 | 4.9 | |||
| 4.6 | - | 4.8 | 118.0 | 2.0 | 4.4 | |||
| 4.8 | - | 5.0 | 113.9 | 2.0 | 4.1 | |||
| 5.0 | - | 5.2 | 105.6 | 1.9 | 3.9 | |||
| 5.2 | - | 5.6 | 94.8 | 1.3 | 3.5 | |||
| 5.6 | - | 6.0 | 78.8 | 1.2 | 2.8 | |||
| 6.0 | - | 6.4 | 67.4 | 1.1 | 2.4 | |||
| 6.4 | - | 6.8 | 59.2 | 1.0 | 2.1 | |||
| 6.8 | - | 7.2 | 51.1 | 0.9 | 1.8 | |||
| 7.2 | - | 7.6 | 42.3 | 0.9 | 1.5 | |||
| 7.6 | - | 8.0 | 37.1 | 0.8 | 1.3 | |||
| 8.0 | - | 8.4 | 29.8 | 0.7 | 1.0 | |||
| 8.4 | - | 8.8 | 26.1 | 0.7 | 0.9 | |||
| 8.8 | - | 9.2 | 22.4 | 0.6 | 0.7 | |||
| 9.2 | - | 9.6 | 18.4 | 0.6 | 0.6 | |||
| 9.6 | - | 10.0 | 15.3 | 0.5 | 0.5 | |||
| 10.0 | - | 10.8 | 11.8 | 0.3 | 0.4 | |||
| 10.8 | - | 11.6 | 7.8 | 0.3 | 0.3 | |||
| 11.6 | - | 12.4 | 5.4 | 0.2 | 0.2 | |||
| 12.4 | - | 13.2 | 3.7 | 0.2 | 0.1 | |||
| 13.2 | - | 14.0 | 2.6 | 0.1 | 0.1 | |||
| 14.0 | - | 14.8 | 1.5 | 0.1 | 0.05 | |||
| 14.8 | - | 15.6 | 1.1 | 0.1 | 0.03 | |||
| 15.6 | - | 16.4 | 0.6 | 0.1 | 0.02 | |||
| 16.4 | - | 17.2 | 0.4 | 0.05 | 0.01 | |||
| 17.2 | - | 18.0 | 0.3 | 0.05 | 0.01 | |||
| 100 | - | 140 | 0.2 | - | 0.3 | 61.3 | 3.0 | 4.2 |
|---|---|---|---|---|---|---|---|---|
| 0.3 | - | 0.4 | 96.9 | 3.5 | 6.5 | |||
| 0.4 | - | 0.5 | 131.4 | 3.4 | 9.0 | |||
| 0.5 | - | 0.6 | 158.2 | 3.5 | 10.6 | |||
| 0.6 | - | 0.7 | 180.5 | 3.6 | 11.1 | |||
| 0.7 | - | 0.8 | 204.1 | 3.9 | 12.8 | |||
| 0.8 | - | 0.9 | 221.6 | 4.0 | 14.3 | |||
| 0.9 | - | 1.0 | 229.3 | 4.0 | 14.3 | |||
| 1.0 | - | 1.2 | 262.8 | 3.2 | 15.2 | |||
| 1.2 | - | 1.4 | 279.8 | 3.2 | 15.0 | |||
| 1.4 | - | 1.6 | 284.3 | 3.2 | 14.6 | |||
| 1.6 | - | 1.8 | 283.5 | 3.2 | 13.4 | |||
| 1.8 | - | 2.0 | 263.8 | 3.0 | 12.5 | |||
| 2.0 | - | 2.2 | 259.0 | 3.0 | 11.8 | |||
| 2.2 | - | 2.4 | 242.3 | 2.9 | 10.5 | |||
| 2.4 | - | 2.6 | 228.7 | 2.8 | 9.6 | |||
| 2.6 | - | 2.8 | 213.5 | 2.7 | 9.0 | |||
| 2.8 | - | 3.0 | 194.3 | 2.5 | 8.0 | |||
| 3.0 | - | 3.2 | 186.2 | 2.5 | 7.3 | |||
| 3.2 | - | 3.4 | 169.0 | 2.4 | 6.5 | |||
| 3.4 | - | 3.6 | 146.5 | 2.2 | 5.7 | |||
| 3.6 | - | 3.8 | 137.3 | 2.1 | 5.3 | |||
| 3.8 | - | 4.0 | 123.2 | 2.0 | 4.6 | |||
| 4.0 | - | 4.2 | 107.6 | 1.9 | 4.1 | |||
| 4.2 | - | 4.4 | 103.0 | 1.9 | 3.9 | |||
| 4.4 | - | 4.6 | 86.5 | 1.7 | 3.3 | |||
| 4.6 | - | 4.8 | 82.7 | 1.7 | 3.2 | |||
| 4.8 | - | 5.0 | 73.0 | 1.6 | 2.7 | |||
| 5.0 | - | 5.2 | 66.2 | 1.5 | 2.4 | |||
| 5.2 | - | 5.6 | 54.9 | 1.0 | 2.1 | |||
| 5.6 | - | 6.0 | 44.5 | 0.9 | 1.7 | |||
| 6.0 | - | 6.4 | 32.7 | 0.7 | 1.2 | |||
| 6.4 | - | 6.8 | 26.2 | 0.7 | 1.0 | |||
| 6.8 | - | 7.2 | 22.0 | 0.6 | 0.8 | |||
| 7.2 | - | 7.6 | 16.6 | 0.5 | 0.6 | |||
| 7.6 | - | 8.0 | 13.6 | 0.5 | 0.5 | |||
| 8.0 | - | 8.4 | 10.1 | 0.4 | 0.4 | |||
| 8.4 | - | 8.8 | 8.3 | 0.4 | 0.3 | |||
| 8.8 | - | 9.2 | 6.8 | 0.3 | 0.3 | |||
| 9.2 | - | 9.6 | 4.8 | 0.3 | 0.2 | |||
| 9.6 | - | 10.0 | 3.4 | 0.2 | 0.1 | |||
| 10.0 | - | 10.8 | 2.6 | 0.1 | 0.1 | |||
| 10.8 | - | 11.6 | 1.4 | 0.1 | 0.1 | |||
| 11.6 | - | 12.4 | 0.9 | 0.1 | 0.03 | |||
| 12.4 | - | 13.2 | 0.5 | 0.06 | 0.02 | |||
| 13.2 | - | 14.0 | 0.3 | 0.05 | 0.01 | |||
| 140 | - | 180 | 0.2 | - | 0.3 | 80.6 | 3.4 | 5.7 |
|---|---|---|---|---|---|---|---|---|
| 0.3 | - | 0.4 | 134.3 | 3.6 | 9.4 | |||
| 0.4 | - | 0.5 | 166.3 | 3.6 | 11.1 | |||
| 0.5 | - | 0.6 | 199.9 | 3.8 | 12.9 | |||
| 0.6 | - | 0.7 | 225.5 | 3.9 | 13.4 | |||
| 0.7 | - | 0.8 | 252.6 | 4.2 | 14.5 | |||
| 0.8 | - | 0.9 | 281.1 | 4.4 | 16.1 | |||
| 0.9 | - | 1.0 | 288.9 | 4.4 | 16.1 | |||
| 1.0 | - | 1.2 | 302.7 | 3.2 | 15.7 | |||
| 1.2 | - | 1.4 | 301.0 | 3.2 | 14.4 | |||
| 1.4 | - | 1.6 | 289.8 | 3.2 | 13.9 | |||
| 1.6 | - | 1.8 | 276.2 | 3.1 | 12.4 | |||
| 1.8 | - | 2.0 | 259.9 | 3.0 | 11.2 | |||
| 2.0 | - | 2.2 | 236.4 | 2.9 | 10.0 | |||
| 2.2 | - | 2.4 | 218.2 | 2.8 | 8.8 | |||
| 2.4 | - | 2.6 | 188.7 | 2.6 | 7.7 | |||
| 2.6 | - | 2.8 | 169.1 | 2.5 | 6.8 | |||
| 2.8 | - | 3.0 | 144.3 | 2.3 | 5.8 | |||
| 3.0 | - | 3.2 | 130.2 | 2.2 | 5.2 | |||
| 3.2 | - | 3.4 | 114.0 | 2.0 | 4.5 | |||
| 3.4 | - | 3.6 | 95.2 | 1.8 | 3.7 | |||
| 3.6 | - | 3.8 | 85.4 | 1.7 | 3.3 | |||
| 3.8 | - | 4.0 | 73.1 | 1.6 | 2.9 | |||
| 4.0 | - | 4.2 | 61.6 | 1.5 | 2.5 | |||
| 4.2 | - | 4.4 | 53.8 | 1.4 | 2.1 | |||
| 4.4 | - | 4.6 | 49.0 | 1.3 | 2.0 | |||
| 4.6 | - | 4.8 | 42.1 | 1.2 | 1.6 | |||
| 4.8 | - | 5.0 | 37.0 | 1.1 | 1.5 | |||
| 5.0 | - | 5.2 | 30.2 | 1.0 | 1.3 | |||
| 5.2 | - | 5.6 | 24.6 | 0.7 | 1.1 | |||
| 5.6 | - | 6.0 | 17.8 | 0.6 | 0.7 | |||
| 6.0 | - | 6.4 | 12.7 | 0.5 | 0.5 | |||
| 6.4 | - | 6.8 | 10.1 | 0.4 | 0.4 | |||
| 6.8 | - | 7.2 | 6.7 | 0.3 | 0.3 | |||
| 7.2 | - | 7.6 | 4.8 | 0.3 | 0.2 | |||
| 7.6 | - | 8.0 | 4.0 | 0.3 | 0.2 | |||
| 8.0 | - | 8.4 | 2.5 | 0.2 | 0.1 | |||
| 8.4 | - | 8.8 | 1.7 | 0.2 | 0.1 | |||
| 8.8 | - | 9.2 | 1.5 | 0.2 | 0.1 | |||
| 9.2 | - | 9.6 | 1.0 | 0.1 | 0.1 | |||
| 9.6 | - | 10.0 | 0.6 | 0.1 | 0.03 | |||
| 10.0 | - | 10.8 | 0.4 | 0.06 | 0.02 | |||
| 10.8 | - | 11.6 | 0.3 | 0.05 | 0.01 | |||
| 180 | - | 240 | 0.2 | - | 0.3 | 111.8 | 2.6 | 7.8 |
|---|---|---|---|---|---|---|---|---|
| 0.3 | - | 0.4 | 176.8 | 3.0 | 11.5 | |||
| 0.4 | - | 0.5 | 223.2 | 3.3 | 14.3 | |||
| 0.5 | - | 0.6 | 261.7 | 3.5 | 15.9 | |||
| 0.6 | - | 0.7 | 287.1 | 3.7 | 16.9 | |||
| 0.7 | - | 0.8 | 308.5 | 3.9 | 17.0 | |||
| 0.8 | - | 0.9 | 321.0 | 4.0 | 16.8 | |||
| 0.9 | - | 1.0 | 323.5 | 4.1 | 16.1 | |||
| 1.0 | - | 1.2 | 317.4 | 2.9 | 15.0 | |||
| 1.2 | - | 1.4 | 290.2 | 2.7 | 13.2 | |||
| 1.4 | - | 1.6 | 264.2 | 2.6 | 11.2 | |||
| 1.6 | - | 1.8 | 242.1 | 2.5 | 10.3 | |||
| 1.8 | - | 2.0 | 206.8 | 2.3 | 8.7 | |||
| 2.0 | - | 2.2 | 178.8 | 2.2 | 7.7 | |||
| 2.2 | - | 2.4 | 147.8 | 2.0 | 6.1 | |||
| 2.4 | - | 2.6 | 125.2 | 1.8 | 5.2 | |||
| 2.6 | - | 2.8 | 103.1 | 1.6 | 4.4 | |||
| 2.8 | - | 3.0 | 88.8 | 1.5 | 3.8 | |||
| 3.0 | - | 3.2 | 74.2 | 1.4 | 3.2 | |||
| 3.2 | - | 3.4 | 62.3 | 1.3 | 2.6 | |||
| 3.4 | - | 3.6 | 50.0 | 1.1 | 2.2 | |||
| 3.6 | - | 3.8 | 39.0 | 1.0 | 1.7 | |||
| 3.8 | - | 4.0 | 35.1 | 1.0 | 1.5 | |||
| 4.0 | - | 4.2 | 28.4 | 0.9 | 1.2 | |||
| 4.2 | - | 4.4 | 24.7 | 0.8 | 1.2 | |||
| 4.4 | - | 4.6 | 19.0 | 0.7 | 0.9 | |||
| 4.6 | - | 4.8 | 16.3 | 0.6 | 0.8 | |||
| 4.8 | - | 5.0 | 14.0 | 0.6 | 0.7 | |||
| 5.0 | - | 5.2 | 10.4 | 0.5 | 0.5 | |||
| 5.2 | - | 5.6 | 8.7 | 0.3 | 0.4 | |||
| 5.6 | - | 6.0 | 5.0 | 0.2 | 0.2 | |||
| 6.0 | - | 6.4 | 3.4 | 0.2 | 0.2 | |||
| 6.4 | - | 6.8 | 2.5 | 0.2 | 0.1 | |||
| 6.8 | - | 7.2 | 1.7 | 0.1 | 0.1 | |||
| 7.2 | - | 7.6 | 0.9 | 0.1 | 0.1 | |||
| 7.6 | - | 8.0 | 0.6 | 0.1 | 0.03 | |||
| 8.0 | - | 8.4 | 0.5 | 0.1 | 0.02 | |||
| 8.4 | - | 8.8 | 0.3 | 0.1 | 0.02 | |||
| 240 | - | 300 | 0.2 | - | 0.3 | 166.6 | 4.9 | 12.0 |
|---|---|---|---|---|---|---|---|---|
| 0.3 | - | 0.4 | 219.6 | 5.1 | 15.1 | |||
| 0.4 | - | 0.5 | 285.3 | 5.8 | 20.0 | |||
| 0.5 | - | 0.6 | 313.2 | 6.0 | 21.1 | |||
| 0.6 | - | 0.7 | 329.9 | 6.2 | 21.6 | |||
| 0.7 | - | 0.8 | 310.9 | 5.9 | 18.4 | |||
| 0.8 | - | 0.9 | 331.6 | 4.7 | 17.6 | |||
| 0.9 | - | 1.0 | 303.4 | 4.4 | 15.9 | |||
| 1.0 | - | 1.2 | 292.4 | 3.1 | 14.3 | |||
| 1.2 | - | 1.4 | 253.2 | 2.9 | 11.7 | |||
| 1.4 | - | 1.6 | 206.1 | 2.6 | 9.3 | |||
| 1.6 | - | 1.8 | 168.4 | 2.4 | 7.6 | |||
| 1.8 | - | 2.0 | 139.0 | 2.1 | 6.1 | |||
| 2.0 | - | 2.2 | 110.4 | 1.9 | 5.0 | |||
| 2.2 | - | 2.4 | 86.1 | 1.7 | 4.0 | |||
| 2.4 | - | 2.6 | 65.8 | 1.5 | 3.0 | |||
| 2.6 | - | 2.8 | 55.0 | 1.4 | 2.7 | |||
| 2.8 | - | 3.0 | 40.2 | 1.1 | 1.8 | |||
| 3.0 | - | 3.2 | 37.1 | 1.6 | 1.7 | |||
| 3.2 | - | 3.4 | 28.6 | 1.5 | 1.4 | |||
| 3.4 | - | 3.6 | 23.2 | 1.3 | 1.1 | |||
| 3.6 | - | 3.8 | 19.7 | 1.3 | 0.9 | |||
| 3.8 | - | 4.0 | 14.1 | 1.0 | 0.6 | |||
| 4.0 | - | 4.2 | 9.6 | 0.8 | 0.4 | |||
| 4.2 | - | 4.4 | 9.1 | 0.8 | 0.4 | |||
| 4.4 | - | 4.6 | 6.2 | 0.6 | 0.4 | |||
| 4.6 | - | 4.8 | 6.3 | 0.7 | 0.4 | |||
| 4.8 | - | 5.0 | 4.8 | 0.6 | 0.2 | |||
| 5.0 | - | 5.2 | 2.9 | 0.4 | 0.1 | |||
| 5.2 | - | 5.6 | 2.9 | 0.3 | 0.1 | |||
| 5.6 | - | 6.0 | 1.5 | 0.2 | 0.1 | |||
| 6.0 | - | 6.4 | 1.0 | 0.2 | 0.1 | |||
| 6.4 | - | 6.8 | 1.7 | 0.3 | 0.1 | |||
| 300 | - | 360 | 0.2 | - | 0.3 | 178.6 | 5.5 | 12.2 |
|---|---|---|---|---|---|---|---|---|
| 0.3 | - | 0.4 | 240.9 | 6.1 | 16.8 | |||
| 0.4 | - | 0.5 | 290.1 | 6.7 | 22.8 | |||
| 0.5 | - | 0.6 | 342.3 | 7.7 | 24.3 | |||
| 0.6 | - | 0.7 | 339.2 | 7.4 | 22.0 | |||
| 0.7 | - | 0.8 | 318.9 | 7.2 | 19.7 | |||
| 0.8 | - | 0.9 | 302.4 | 7.0 | 17.5 | |||
| 0.9 | - | 1.0 | 276.6 | 6.7 | 15.4 | |||
| 1.0 | - | 1.2 | 238.8 | 4.4 | 12.8 | |||
| 1.2 | - | 1.4 | 194.4 | 4.0 | 9.1 | |||
| 1.4 | - | 1.6 | 153.0 | 3.6 | 6.8 | |||
| 1.6 | - | 1.8 | 112.1 | 3.0 | 5.2 | |||
| 1.8 | - | 2.0 | 80.4 | 2.5 | 3.7 | |||
| 2.0 | - | 2.2 | 55.7 | 2.1 | 2.9 | |||
| 2.2 | - | 2.4 | 42.4 | 1.8 | 2.2 | |||
| 2.4 | - | 2.6 | 29.1 | 1.5 | 1.4 | |||
| 2.6 | - | 2.8 | 19.6 | 1.2 | 1.0 | |||
| 2.8 | - | 3.0 | 14.3 | 1.0 | 0.7 | |||
| 3.0 | - | 3.2 | 9.9 | 0.9 | 0.5 | |||
| 3.2 | - | 3.4 | 7.3 | 0.7 | 0.4 | |||
| 3.4 | - | 3.6 | 3.9 | 0.5 | 0.2 | |||
| 3.6 | - | 3.8 | 2.6 | 0.4 | 0.1 | |||
| 3.8 | - | 4.0 | 2.8 | 0.4 | 0.2 | |||
| 360 | - | 420 | 0.2 | - | 0.3 | 183.2 | 5.4 | 13.7 |
| 0.3 | - | 0.4 | 257.7 | 6.4 | 19.4 | |||
| 0.4 | - | 0.5 | 326.1 | 7.6 | 21.6 | |||
| 0.5 | - | 0.6 | 295.2 | 6.9 | 19.2 | |||
| 0.6 | - | 0.7 | 302.2 | 7.1 | 18.7 | |||
| 0.7 | - | 0.8 | 275.9 | 6.7 | 16.3 | |||
| 0.8 | - | 0.9 | 255.6 | 6.5 | 18.0 | |||
| 0.9 | - | 1.0 | 232.8 | 6.3 | 16.3 | |||
| 1.0 | - | 1.2 | 187.8 | 4.0 | 14.9 | |||
| 1.2 | - | 1.4 | 129.2 | 3.3 | 10.1 | |||
| 1.4 | - | 1.6 | 87.8 | 2.7 | 7.0 | |||
| 1.6 | - | 1.8 | 59.2 | 2.2 | 4.9 | |||
| 1.8 | - | 2.0 | 36.3 | 1.7 | 2.9 | |||
| 2.0 | - | 2.2 | 23.8 | 1.3 | 2.1 | |||
| 2.2 | - | 2.4 | 15.3 | 1.1 | 1.4 | |||
| 2.4 | - | 2.6 | 9.9 | 0.9 | 0.9 | |||
| 2.6 | - | 2.8 | 6.3 | 0.7 | 0.6 | |||
| 2.8 | - | 3.0 | 4.1 | 0.5 | 0.4 | |||
| 3.0 | - | 3.2 | 3.1 | 0.5 | 0.3 | |||
| 0 | - | 20 | 0.8 | - | 1.6 | 2.1 | 0.5 | 0.1 |
|---|---|---|---|---|---|---|---|---|
| 1.6 | - | 2.4 | 2.8 | 0.4 | 0.2 | |||
| 2.4 | - | 3.2 | 4.6 | 0.6 | 0.2 | |||
| 3.2 | - | 4.0 | 3.7 | 0.7 | 0.2 | |||
| 4.0 | - | 4.8 | 3.5 | 0.6 | 0.2 | |||
| 4.8 | - | 5.6 | 3.8 | 0.7 | 0.2 | |||
| 5.6 | - | 6.4 | 4.3 | 0.7 | 0.3 | |||
| 6.4 | - | 7.6 | 3.5 | 0.6 | 0.3 | |||
| 7.6 | - | 8.8 | 3.1 | 0.7 | 0.3 | |||
| 8.8 | - | 10.0 | 3.0 | 0.7 | 0.3 | |||
| 10.0 | - | 11.6 | 3.2 | 0.6 | 0.4 | |||
| 11.6 | - | 13.2 | 2.3 | 1.0 | 0.4 | |||
| 13.2 | - | 14.8 | 1.4 | 1.3 | 0.3 | |||
| 14.8 | - | 16.4 | 1.6 | 1.6 | 0.4 | |||
| 20 | - | 40 | 0.8 | - | 1.6 | 4.3 | 0.6 | 0.2 |
| 1.6 | - | 2.4 | 7.6 | 0.6 | 0.3 | |||
| 2.4 | - | 3.2 | 10.6 | 0.8 | 0.4 | |||
| 3.2 | - | 4.0 | 11.9 | 0.9 | 0.5 | |||
| 4.0 | - | 4.8 | 12.2 | 1.0 | 0.5 | |||
| 4.8 | - | 5.6 | 12.9 | 1.1 | 0.6 | |||
| 5.6 | - | 6.4 | 10.3 | 1.1 | 0.5 | |||
| 6.4 | - | 7.6 | 9.7 | 0.9 | 0.5 | |||
| 7.6 | - | 8.8 | 8.6 | 0.9 | 0.6 | |||
| 8.8 | - | 10.0 | 8.5 | 0.8 | 0.8 | |||
| 10.0 | - | 11.6 | 5.8 | 0.7 | 0.8 | |||
| 11.6 | - | 13.2 | 4.1 | 0.7 | 0.7 | |||
| 13.2 | - | 14.8 | 3.7 | 0.7 | 0.8 | |||
| 14.8 | - | 16.4 | 2.4 | 0.6 | 0.5 | |||
| 40 | - | 60 | 0.8 | - | 1.6 | 10.4 | 1.3 | 0.4 |
| 1.6 | - | 2.4 | 10.9 | 1.1 | 0.3 | |||
| 2.4 | - | 3.2 | 15.7 | 1.4 | 0.4 | |||
| 3.2 | - | 4.0 | 19.9 | 1.6 | 0.5 | |||
| 4.0 | - | 4.8 | 19.5 | 1.6 | 0.5 | |||
| 4.8 | - | 5.6 | 17.0 | 1.6 | 0.5 | |||
| 5.6 | - | 6.4 | 17.4 | 1.6 | 0.6 | |||
| 6.4 | - | 7.6 | 13.8 | 1.2 | 0.6 | |||
| 7.6 | - | 8.8 | 10.7 | 1.0 | 0.6 | |||
| 8.8 | - | 10.0 | 9.2 | 0.9 | 0.7 | |||
| 10.0 | - | 11.6 | 6.5 | 0.7 | 0.6 | |||
| 11.6 | - | 13.2 | 3.7 | 0.6 | 0.5 | |||
| 13.2 | - | 14.8 | 2.5 | 0.5 | 0.4 | |||
| 14.8 | - | 16.4 | 1.7 | 0.4 | 0.3 | |||
| 16.4 | - | 18.0 | 0.4 | 0.2 | 0.1 | |||
| 18.0 | - | 19.6 | 0.4 | 0.2 | 0.1 | |||
| 60 | - | 100 | 0.8 | - | 1.6 | 9.7 | 1.1 | 0.3 |
| 1.6 | - | 2.4 | 20.5 | 1.4 | 0.6 | |||
| 2.4 | - | 3.2 | 20.0 | 1.3 | 0.5 | |||
| 3.2 | - | 4.0 | 23.3 | 1.4 | 0.6 | |||
| 4.0 | - | 4.8 | 19.8 | 1.0 | 0.6 | |||
| 4.8 | - | 5.6 | 16.5 | 0.9 | 0.5 | |||
| 5.6 | - | 6.4 | 16.1 | 0.9 | 0.5 | |||
| 6.4 | - | 7.6 | 11.6 | 0.7 | 0.5 | |||
| 7.6 | - | 8.8 | 7.8 | 0.6 | 0.4 | |||
| 8.8 | - | 10.0 | 5.2 | 0.5 | 0.3 | |||
| 10.0 | - | 11.6 | 3.2 | 0.4 | 0.2 | |||
| 11.6 | - | 13.2 | 1.2 | 0.2 | 0.1 | |||
| 13.2 | - | 14.8 | 0.9 | 0.2 | 0.1 | |||
| 14.8 | - | 16.4 | 0.3 | 0.1 | 0.04 | |||
| 100 | - | 140 | 0.8 | - | 1.6 | 16.9 | 2.2 | 0.6 |
|---|---|---|---|---|---|---|---|---|
| 1.6 | - | 2.4 | 27.7 | 2.0 | 0.8 | |||
| 2.4 | - | 3.2 | 26.3 | 1.4 | 0.7 | |||
| 3.2 | - | 4.0 | 20.7 | 1.2 | 0.6 | |||
| 4.0 | - | 4.8 | 18.0 | 1.1 | 0.5 | |||
| 4.8 | - | 5.6 | 11.8 | 0.9 | 0.4 | |||
| 5.6 | - | 6.4 | 8.6 | 0.8 | 0.3 | |||
| 6.4 | - | 7.6 | 5.2 | 0.5 | 0.2 | |||
| 7.6 | - | 8.8 | 3.1 | 0.5 | 0.2 | |||
| 8.8 | - | 10.0 | 1.5 | 0.4 | 0.1 | |||
| 10.0 | - | 11.6 | 0.6 | 0.2 | 0.05 | |||
| 11.6 | - | 13.2 | 0.3 | 0.1 | 0.03 | |||
| 140 | - | 180 | 0.8 | - | 1.6 | 18.1 | 4.1 | 0.6 |
| 1.6 | - | 2.4 | 24.2 | 1.9 | 0.7 | |||
| 2.4 | - | 3.2 | 23.7 | 1.7 | 0.6 | |||
| 3.2 | - | 4.0 | 18.2 | 1.4 | 0.5 | |||
| 4.0 | - | 4.8 | 8.8 | 1.0 | 0.2 | |||
| 4.8 | - | 5.6 | 5.6 | 0.8 | 0.2 | |||
| 5.6 | - | 6.4 | 4.0 | 0.7 | 0.1 | |||
| 6.4 | - | 7.6 | 1.6 | 0.4 | 0.1 | |||
| 7.6 | - | 8.8 | 0.6 | 0.3 | 0.03 | |||
| 8.8 | - | 10.0 | 0.2 | 0.1 | 0.01 | |||
| 180 | - | 240 | 0.8 | - | 1.6 | 22.9 | 3.3 | 0.8 |
| 1.6 | - | 2.4 | 24.9 | 2.4 | 0.8 | |||
| 2.4 | - | 3.2 | 14.0 | 1.6 | 0.4 | |||
| 3.2 | - | 4.0 | 11.5 | 1.4 | 0.3 | |||
| 4.0 | - | 4.8 | 5.4 | 1.0 | 0.1 | |||
| 4.8 | - | 5.6 | 2.0 | 0.6 | 0.1 | |||
| 5.6 | - | 6.4 | 2.4 | 0.8 | 0.1 | |||
| 6.4 | - | 7.6 | 0.4 | 0.2 | 0.02 | |||
| 240 | - | 300 | 0.8 | - | 1.6 | 24.0 | 3.2 | 0.7 |
| 1.6 | - | 2.4 | 17.4 | 2.0 | 0.5 | |||
| 2.4 | - | 3.2 | 10.2 | 1.4 | 0.3 | |||
| 3.2 | - | 4.0 | 5.5 | 1.2 | 0.1 | |||
| 4.0 | - | 4.8 | 2.2 | 0.8 | 0.1 | |||
| 4.8 | - | 5.6 | 0.5 | 0.3 | 0.01 | |||
| 0 | - | 20 | 0.8 | - | 1.6 | 0.5 | 0.2 | 0.03 |
|---|---|---|---|---|---|---|---|---|
| 1.6 | - | 2.4 | 1.5 | 0.3 | 0.1 | |||
| 2.4 | - | 3.2 | 0.9 | 0.3 | 0.1 | |||
| 3.2 | - | 4.0 | 1.7 | 0.4 | 0.2 | |||
| 4.0 | - | 4.8 | 1.7 | 0.3 | 0.2 | |||
| 4.8 | - | 5.6 | 1.7 | 0.3 | 0.2 | |||
| 5.6 | - | 6.4 | 1.2 | 0.3 | 0.1 | |||
| 6.4 | - | 7.6 | 1.2 | 0.3 | 0.1 | |||
| 7.6 | - | 8.8 | 1.2 | 0.2 | 0.1 | |||
| 8.8 | - | 10.0 | 0.5 | 0.2 | 0.04 | |||
| 10.0 | - | 11.6 | 0.7 | 0.2 | 0.1 | |||
| 11.6 | - | 13.2 | 0.2 | 0.1 | 0.02 | |||
| 13.2 | - | 14.8 | 0.4 | 0.1 | 0.1 | |||
| 14.8 | - | 16.4 | 0.1 | 0.2 | 0.02 | |||
| 20 | - | 40 | 0.8 | - | 1.6 | 1.9 | 0.4 | 0.1 |
| 1.6 | - | 2.4 | 3.9 | 0.5 | 0.2 | |||
| 2.4 | - | 3.2 | 5.5 | 0.6 | 0.2 | |||
| 3.2 | - | 4.0 | 4.9 | 0.6 | 0.2 | |||
| 4.0 | - | 4.8 | 5.0 | 0.6 | 0.2 | |||
| 4.8 | - | 5.6 | 5.4 | 0.6 | 0.2 | |||
| 5.6 | - | 6.4 | 4.1 | 0.6 | 0.2 | |||
| 6.4 | - | 7.6 | 3.0 | 0.4 | 0.1 | |||
| 7.6 | - | 8.8 | 3.2 | 0.4 | 0.2 | |||
| 8.8 | - | 10.0 | 2.2 | 0.3 | 0.1 | |||
| 10.0 | - | 11.6 | 1.7 | 0.2 | 0.1 | |||
| 11.6 | - | 13.2 | 0.7 | 0.2 | 0.1 | |||
| 13.2 | - | 14.8 | 0.2 | 0.1 | 0.02 | |||
| 14.8 | - | 16.4 | 0.1 | 0.06 | 0.01 | |||
| 16.4 | - | 18.0 | 0.1 | 0.06 | 0.02 | |||
| 18.0 | - | 19.6 | 0.1 | 0.06 | 0.02 | |||
| 40 | - | 60 | 0.8 | - | 1.6 | 4.1 | 0.9 | 0.1 |
| 1.6 | - | 2.4 | 6.5 | 0.9 | 0.2 | |||
| 2.4 | - | 3.2 | 8.2 | 1.1 | 0.2 | |||
| 3.2 | - | 4.0 | 8.0 | 1.0 | 0.2 | |||
| 4.0 | - | 4.8 | 7.5 | 1.0 | 0.2 | |||
| 4.8 | - | 5.6 | 5.6 | 0.7 | 0.2 | |||
| 5.6 | - | 6.4 | 6.6 | 0.9 | 0.2 | |||
| 6.4 | - | 7.6 | 4.4 | 0.6 | 0.2 | |||
| 7.6 | - | 8.8 | 3.0 | 0.4 | 0.1 | |||
| 8.8 | - | 10.0 | 1.2 | 0.2 | 0.1 | |||
| 10.0 | - | 11.6 | 1.5 | 0.2 | 0.1 | |||
| 11.6 | - | 13.2 | 0.8 | 0.1 | 0.04 | |||
| 13.2 | - | 14.8 | 0.1 | 0.1 | 0.01 | |||
| 14.8 | - | 16.4 | 0.1 | 0.04 | 0.00 | |||
| 16.4 | - | 18.0 | 0.1 | 0.04 | 0.00 | |||
| 60 | - | 100 | 0.8 | - | 1.6 | 5.5 | 0.9 | 0.2 |
| 1.6 | - | 2.4 | 9.6 | 1.0 | 0.3 | |||
| 2.4 | - | 3.2 | 9.1 | 0.9 | 0.3 | |||
| 3.2 | - | 4.0 | 9.7 | 0.9 | 0.3 | |||
| 4.0 | - | 4.8 | 8.0 | 0.6 | 0.2 | |||
| 4.8 | - | 5.6 | 6.6 | 0.5 | 0.2 | |||
| 5.6 | - | 6.4 | 4.7 | 0.4 | 0.1 | |||
| 6.4 | - | 7.6 | 2.5 | 0.2 | 0.1 | |||
| 7.6 | - | 8.8 | 1.7 | 0.2 | 0.1 | |||
| 8.8 | - | 10.0 | 1.1 | 0.2 | 0.05 | |||
| 10.0 | - | 11.6 | 0.5 | 0.1 | 0.03 | |||
| 11.6 | - | 13.2 | 0.1 | 0.03 | 0.00 | |||
| 13.2 | - | 14.8 | 0.1 | 0.1 | 0.01 | |||
| 14.8 | - | 16.4 | 0.01 | 0.01 | 0.00 | |||
| 16.4 | - | 18.0 | 0.01 | 0.01 | 0.00 | |||
| 100 | - | 140 | 0.8 | - | 1.6 | 7.3 | 1.5 | 0.2 |
|---|---|---|---|---|---|---|---|---|
| 1.6 | - | 2.4 | 11.4 | 1.2 | 0.4 | |||
| 2.4 | - | 3.2 | 10.0 | 0.9 | 0.3 | |||
| 3.2 | - | 4.0 | 8.5 | 0.7 | 0.2 | |||
| 4.0 | - | 4.8 | 5.4 | 0.6 | 0.1 | |||
| 4.8 | - | 5.6 | 3.9 | 0.5 | 0.1 | |||
| 5.6 | - | 6.4 | 1.5 | 0.3 | 0.05 | |||
| 6.4 | - | 7.6 | 1.4 | 0.2 | 0.05 | |||
| 7.6 | - | 8.8 | 0.6 | 0.1 | 0.02 | |||
| 8.8 | - | 10.0 | 0.2 | 0.1 | 0.01 | |||
| 10.0 | - | 11.6 | 0.02 | 0.02 | 0.00 | |||
| 11.6 | - | 13.2 | 0.3 | 0.3 | 0.01 | |||
| 140 | - | 180 | 0.8 | - | 1.6 | 12.7 | 4.1 | 0.4 |
| 1.6 | - | 2.4 | 15.9 | 1.7 | 0.5 | |||
| 2.4 | - | 3.2 | 8.9 | 1.0 | 0.2 | |||
| 3.2 | - | 4.0 | 6.4 | 0.8 | 0.2 | |||
| 4.0 | - | 4.8 | 2.7 | 0.5 | 0.1 | |||
| 4.8 | - | 5.6 | 2.0 | 0.5 | 0.1 | |||
| 5.6 | - | 6.4 | 1.6 | 0.4 | 0.05 | |||
| 6.4 | - | 7.6 | 0.4 | 0.2 | 0.02 | |||
| 7.6 | - | 8.8 | 0.5 | 0.5 | 0.02 | |||
| 180 | - | 240 | 0.8 | - | 1.6 | 11.3 | 2.5 | 0.4 |
| 1.6 | - | 2.4 | 11.3 | 1.7 | 0.4 | |||
| 2.4 | - | 3.2 | 5.0 | 0.9 | 0.1 | |||
| 3.2 | - | 4.0 | 3.6 | 0.9 | 0.1 | |||
| 4.0 | - | 4.8 | 1.5 | 0.6 | 0.04 | |||
| 4.8 | - | 5.6 | 1.4 | 0.5 | 0.04 | |||
| 5.6 | - | 6.4 | 0.1 | 0.1 | 0.01 | |||
| 0 | - | 10 | 1.2 | - | 1.6 | 2.4 | 0.5 | 0.2 |
|---|---|---|---|---|---|---|---|---|
| 1.6 | - | 2.0 | 3.1 | 0.5 | 0.3 | |||
| 2.0 | - | 2.4 | 2.2 | 0.4 | 0.2 | |||
| 2.4 | - | 2.8 | 2.3 | 0.4 | 0.3 | |||
| 2.8 | - | 3.2 | 3.6 | 0.5 | 0.5 | |||
| 3.2 | - | 3.6 | 2.7 | 0.6 | 0.3 | |||
| 3.6 | - | 4.0 | 2.3 | 0.5 | 0.2 | |||
| 4.0 | - | 4.4 | 4.1 | 0.7 | 0.5 | |||
| 4.4 | - | 4.8 | 4.8 | 0.8 | 0.5 | |||
| 4.8 | - | 5.2 | 4.5 | 1.2 | 0.4 | |||
| 5.2 | - | 5.6 | 6.0 | 1.7 | 0.4 | |||
| 5.6 | - | 6.0 | 10.3 | 2.2 | 0.9 | |||
| 6.0 | - | 6.4 | 9.3 | 1.9 | 0.8 | |||
| 6.4 | - | 6.8 | 6.8 | 1.5 | 0.6 | |||
| 6.8 | - | 7.2 | 8.1 | 1.7 | 0.6 | |||
| 7.2 | - | 7.6 | 6.4 | 1.5 | 0.5 | |||
| 7.6 | - | 8.0 | 11.1 | 2.0 | 0.7 | |||
| 8.0 | - | 8.4 | 11.4 | 2.6 | 1.3 | |||
| 8.4 | - | 8.8 | 19.0 | 3.0 | 2.3 | |||
| 8.8 | - | 9.2 | 11.5 | 2.8 | 1.4 | |||
| 9.2 | - | 9.6 | 20.2 | 3.0 | 2.4 | |||
| 9.6 | - | 10.0 | 19.5 | 2.9 | 2.3 | |||
| 10.0 | - | 10.8 | 22.9 | 2.4 | 2.7 | |||
| 10.8 | - | 11.6 | 22.2 | 2.3 | 1.4 | |||
| 11.6 | - | 12.4 | 23.1 | 2.7 | 1.5 | |||
| 12.4 | - | 13.2 | 21.0 | 3.1 | 1.4 | |||
| 13.2 | - | 14.0 | 28.4 | 3.4 | 1.9 | |||
| 14.0 | - | 14.8 | 30.8 | 3.7 | 2.1 | |||
| 14.8 | - | 15.6 | 32.4 | 4.0 | 2.3 | |||
| 15.6 | - | 16.4 | 42.6 | 5.3 | 3.0 | |||
| 10 | - | 20 | 1.2 | - | 1.6 | 9.6 | 0.9 | 0.8 |
|---|---|---|---|---|---|---|---|---|
| 1.6 | - | 2.0 | 8.6 | 0.8 | 0.8 | |||
| 2.0 | - | 2.4 | 8.8 | 0.8 | 1.0 | |||
| 2.4 | - | 2.8 | 7.6 | 0.8 | 0.8 | |||
| 2.8 | - | 3.2 | 9.8 | 1.4 | 1.0 | |||
| 3.2 | - | 3.6 | 11.4 | 1.3 | 1.3 | |||
| 3.6 | - | 4.0 | 12.6 | 1.6 | 1.5 | |||
| 4.0 | - | 4.4 | 12.6 | 1.4 | 1.3 | |||
| 4.4 | - | 4.8 | 15.0 | 1.5 | 1.4 | |||
| 4.8 | - | 5.2 | 14.9 | 1.6 | 1.5 | |||
| 5.2 | - | 5.6 | 21.6 | 2.2 | 1.8 | |||
| 5.6 | - | 6.0 | 21.6 | 2.4 | 1.8 | |||
| 6.0 | - | 6.4 | 24.8 | 2.7 | 1.9 | |||
| 6.4 | - | 6.8 | 24.8 | 2.6 | 1.8 | |||
| 6.8 | - | 7.2 | 28.5 | 3.0 | 2.2 | |||
| 7.2 | - | 7.6 | 26.7 | 3.3 | 1.7 | |||
| 7.6 | - | 8.0 | 33.4 | 3.5 | 2.1 | |||
| 8.0 | - | 8.4 | 32.6 | 3.5 | 3.2 | |||
| 8.4 | - | 8.8 | 42.0 | 4.3 | 4.1 | |||
| 8.8 | - | 9.2 | 42.3 | 3.9 | 4.2 | |||
| 9.2 | - | 9.6 | 46.2 | 4.6 | 4.5 | |||
| 9.6 | - | 10.0 | 60.5 | 4.7 | 5.8 | |||
| 10.0 | - | 10.8 | 55.1 | 3.5 | 5.3 | |||
| 10.8 | - | 11.6 | 68.3 | 4.3 | 3.9 | |||
| 11.6 | - | 12.4 | 71.2 | 3.9 | 3.9 | |||
| 12.4 | - | 13.2 | 80.8 | 4.4 | 4.4 | |||
| 13.2 | - | 14.0 | 82.7 | 4.3 | 4.5 | |||
| 14.0 | - | 14.8 | 95.1 | 4.3 | 5.0 | |||
| 14.8 | - | 15.6 | 103.8 | 4.4 | 5.5 | |||
| 15.6 | - | 16.4 | 101.0 | 4.5 | 5.3 | |||
| 16.4 | - | 17.2 | 110.3 | 4.8 | 5.8 | |||
| 17.2 | - | 18.0 | 108.5 | 4.6 | 5.7 | |||
| 18.0 | - | 18.8 | 117.6 | 5.2 | 6.2 | |||
| 18.8 | - | 19.6 | 117.2 | 5.0 | 6.2 | |||
| 19.6 | - | 20.4 | 125.6 | 5.1 | 6.7 | |||
| 20.4 | - | 21.2 | 123.4 | 5.4 | 6.6 | |||
| 21.2 | - | 22.0 | 110.2 | 5.3 | 6.0 | |||
| 20 | - | 40 | 1.2 | - | 1.6 | 14.8 | 0.7 | 1.3 |
|---|---|---|---|---|---|---|---|---|
| 1.6 | - | 2.0 | 15.4 | 0.7 | 1.6 | |||
| 2.0 | - | 2.4 | 17.5 | 0.8 | 2.0 | |||
| 2.4 | - | 2.8 | 17.7 | 1.0 | 2.0 | |||
| 2.8 | - | 3.2 | 18.9 | 1.1 | 2.1 | |||
| 3.2 | - | 3.6 | 20.1 | 1.1 | 2.0 | |||
| 3.6 | - | 4.0 | 20.3 | 1.2 | 1.9 | |||
| 4.0 | - | 4.4 | 23.9 | 1.2 | 1.9 | |||
| 4.4 | - | 4.8 | 25.0 | 1.3 | 2.4 | |||
| 4.8 | - | 5.2 | 31.0 | 1.6 | 2.4 | |||
| 5.2 | - | 5.6 | 37.3 | 1.8 | 3.1 | |||
| 5.6 | - | 6.0 | 40.0 | 1.9 | 3.0 | |||
| 6.0 | - | 6.4 | 48.4 | 1.9 | 3.5 | |||
| 6.4 | - | 6.8 | 46.8 | 2.0 | 3.1 | |||
| 6.8 | - | 7.2 | 51.8 | 2.3 | 3.3 | |||
| 7.2 | - | 7.6 | 56.3 | 2.2 | 3.3 | |||
| 7.6 | - | 8.0 | 60.3 | 2.4 | 3.6 | |||
| 8.0 | - | 8.4 | 66.3 | 2.4 | 3.8 | |||
| 8.4 | - | 8.8 | 73.0 | 2.7 | 3.8 | |||
| 8.8 | - | 9.2 | 75.8 | 2.8 | 4.0 | |||
| 9.2 | - | 9.6 | 80.4 | 2.8 | 4.1 | |||
| 9.6 | - | 10.0 | 76.9 | 2.9 | 3.8 | |||
| 10.0 | - | 10.8 | 88.0 | 2.2 | 4.2 | |||
| 10.8 | - | 11.6 | 89.0 | 2.2 | 4.2 | |||
| 11.6 | - | 12.4 | 96.1 | 2.3 | 3.8 | |||
| 12.4 | - | 13.2 | 100.7 | 2.5 | 3.9 | |||
| 13.2 | - | 14.0 | 98.4 | 2.5 | 3.7 | |||
| 14.0 | - | 14.8 | 101.5 | 2.5 | 3.8 | |||
| 14.8 | - | 15.6 | 95.0 | 2.5 | 3.5 | |||
| 15.6 | - | 16.4 | 97.9 | 2.5 | 3.5 | |||
| 16.4 | - | 17.2 | 93.5 | 2.4 | 3.3 | |||
| 17.2 | - | 18.0 | 88.2 | 2.4 | 3.1 | |||
| 18.0 | - | 18.8 | 82.8 | 2.3 | 2.9 | |||
| 18.8 | - | 19.6 | 77.7 | 2.3 | 2.7 | |||
| 19.6 | - | 20.4 | 71.9 | 2.3 | 2.5 | |||
| 20.4 | - | 21.2 | 66.5 | 2.1 | 2.3 | |||
| 21.2 | - | 22.0 | 63.8 | 2.2 | 2.2 | |||
| 40 | - | 60 | 1.2 | - | 1.6 | 26.6 | 1.3 | 1.9 |
|---|---|---|---|---|---|---|---|---|
| 1.6 | - | 2.0 | 25.3 | 1.3 | 2.3 | |||
| 2.0 | - | 2.4 | 26.5 | 1.4 | 2.5 | |||
| 2.4 | - | 2.8 | 27.0 | 1.6 | 2.5 | |||
| 2.8 | - | 3.2 | 26.2 | 1.6 | 2.5 | |||
| 3.2 | - | 3.6 | 32.7 | 2.0 | 2.8 | |||
| 3.6 | - | 4.0 | 34.5 | 2.1 | 3.2 | |||
| 4.0 | - | 4.4 | 38.4 | 2.2 | 2.8 | |||
| 4.4 | - | 4.8 | 42.5 | 2.4 | 3.5 | |||
| 4.8 | - | 5.2 | 40.9 | 2.2 | 2.8 | |||
| 5.2 | - | 5.6 | 45.0 | 2.5 | 3.3 | |||
| 5.6 | - | 6.0 | 54.0 | 2.8 | 3.8 | |||
| 6.0 | - | 6.4 | 55.6 | 2.8 | 3.5 | |||
| 6.4 | - | 6.8 | 64.0 | 3.1 | 3.6 | |||
| 6.8 | - | 7.2 | 68.5 | 3.1 | 3.5 | |||
| 7.2 | - | 7.6 | 71.0 | 3.2 | 3.6 | |||
| 7.6 | - | 8.0 | 68.7 | 2.8 | 3.1 | |||
| 8.0 | - | 8.4 | 78.2 | 2.9 | 3.4 | |||
| 8.4 | - | 8.8 | 76.0 | 2.7 | 3.1 | |||
| 8.8 | - | 9.2 | 80.1 | 2.9 | 3.3 | |||
| 9.2 | - | 9.6 | 75.8 | 2.6 | 3.0 | |||
| 9.6 | - | 10.0 | 80.3 | 2.7 | 3.1 | |||
| 10.0 | - | 10.8 | 83.8 | 1.9 | 3.1 | |||
| 10.8 | - | 11.6 | 77.9 | 1.9 | 2.7 | |||
| 11.6 | - | 12.4 | 78.5 | 1.9 | 2.6 | |||
| 12.4 | - | 13.2 | 73.8 | 1.8 | 2.4 | |||
| 13.2 | - | 14.0 | 65.5 | 1.6 | 2.1 | |||
| 14.0 | - | 14.8 | 62.1 | 1.6 | 1.9 | |||
| 14.8 | - | 15.6 | 52.3 | 1.4 | 1.6 | |||
| 15.6 | - | 16.4 | 49.0 | 1.4 | 1.4 | |||
| 16.4 | - | 17.2 | 44.6 | 1.3 | 1.3 | |||
| 17.2 | - | 18.0 | 34.2 | 1.1 | 0.9 | |||
| 18.0 | - | 18.8 | 30.3 | 1.1 | 0.8 | |||
| 18.8 | - | 19.6 | 25.7 | 1.0 | 0.7 | |||
| 19.6 | - | 20.4 | 21.0 | 0.9 | 0.6 | |||
| 60 | - | 100 | 1.2 | - | 1.6 | 42.3 | 1.6 | 3.1 |
| 1.6 | - | 2.0 | 40.3 | 1.6 | 3.2 | |||
| 2.0 | - | 2.4 | 37.1 | 1.7 | 3.1 | |||
| 2.4 | - | 2.8 | 39.9 | 1.7 | 3.9 | |||
| 2.8 | - | 3.2 | 44.1 | 1.9 | 3.9 | |||
| 3.2 | - | 3.6 | 44.4 | 1.6 | 3.9 | |||
| 3.6 | - | 4.0 | 45.8 | 1.6 | 3.9 | |||
| 4.0 | - | 4.4 | 49.5 | 1.6 | 4.1 | |||
| 4.4 | - | 4.8 | 49.4 | 1.6 | 3.9 | |||
| 4.8 | - | 5.2 | 53.8 | 1.7 | 3.7 | |||
| 5.2 | - | 5.6 | 53.6 | 1.6 | 3.6 | |||
| 5.6 | - | 6.0 | 52.6 | 1.6 | 3.2 | |||
| 6.0 | - | 6.4 | 56.0 | 1.7 | 3.3 | |||
| 6.4 | - | 6.8 | 54.7 | 1.7 | 2.9 | |||
| 6.8 | - | 7.2 | 56.9 | 1.7 | 2.8 | |||
| 7.2 | - | 7.6 | 53.9 | 1.7 | 2.4 | |||
| 7.6 | - | 8.0 | 56.2 | 1.7 | 2.5 | |||
| 8.0 | - | 8.4 | 56.0 | 1.7 | 2.3 | |||
| 8.4 | - | 8.8 | 49.9 | 1.6 | 1.9 | |||
| 8.8 | - | 9.2 | 47.9 | 1.5 | 1.9 | |||
| 9.2 | - | 9.6 | 44.4 | 1.5 | 1.6 | |||
| 9.6 | - | 10.0 | 43.0 | 1.5 | 1.5 | |||
| 10.0 | - | 10.8 | 40.0 | 1.0 | 1.4 | |||
| 10.8 | - | 11.6 | 33.8 | 0.9 | 1.1 | |||
| 11.6 | - | 12.4 | 28.6 | 0.9 | 0.9 | |||
| 12.4 | - | 13.2 | 22.5 | 0.8 | 0.7 | |||
| 13.2 | - | 14.0 | 17.7 | 0.7 | 0.5 | |||
| 14.0 | - | 14.8 | 13.6 | 0.6 | 0.4 | |||
| 14.8 | - | 15.6 | 11.4 | 0.5 | 0.3 | |||
| 15.6 | - | 16.4 | 8.6 | 0.5 | 0.2 | |||
| 16.4 | - | 17.2 | 6.0 | 0.4 | 0.2 | |||
| 17.2 | - | 18.0 | 4.5 | 0.3 | 0.1 | |||
| 100 | - | 140 | 1.2 | - | 1.6 | 60.0 | 2.7 | 4.0 |
|---|---|---|---|---|---|---|---|---|
| 1.6 | - | 2.0 | 55.4 | 2.5 | 3.7 | |||
| 2.0 | - | 2.4 | 56.4 | 2.1 | 4.7 | |||
| 2.4 | - | 2.8 | 56.0 | 1.9 | 4.5 | |||
| 2.8 | - | 3.2 | 51.2 | 1.8 | 4.0 | |||
| 3.2 | - | 3.6 | 50.7 | 1.8 | 3.9 | |||
| 3.6 | - | 4.0 | 48.9 | 1.8 | 3.7 | |||
| 4.0 | - | 4.4 | 47.9 | 1.8 | 3.4 | |||
| 4.4 | - | 4.8 | 45.3 | 1.8 | 2.8 | |||
| 4.8 | - | 5.2 | 47.2 | 1.9 | 2.7 | |||
| 5.2 | - | 5.6 | 41.8 | 1.7 | 2.2 | |||
| 5.6 | - | 6.0 | 38.0 | 1.7 | 1.9 | |||
| 6.0 | - | 6.4 | 37.3 | 1.7 | 1.6 | |||
| 6.4 | - | 6.8 | 35.4 | 1.6 | 1.5 | |||
| 6.8 | - | 7.2 | 32.0 | 1.6 | 1.3 | |||
| 7.2 | - | 7.6 | 23.6 | 1.3 | 1.0 | |||
| 7.6 | - | 8.0 | 24.2 | 1.4 | 0.9 | |||
| 8.0 | - | 8.4 | 21.2 | 1.3 | 0.7 | |||
| 8.4 | - | 8.8 | 17.1 | 1.1 | 0.6 | |||
| 8.8 | - | 9.2 | 18.2 | 1.2 | 0.6 | |||
| 9.2 | - | 9.6 | 11.8 | 1.0 | 0.4 | |||
| 9.6 | - | 10.0 | 12.0 | 0.9 | 0.4 | |||
| 10.0 | - | 10.8 | 8.4 | 0.6 | 0.3 | |||
| 10.8 | - | 11.6 | 6.3 | 0.5 | 0.2 | |||
| 11.6 | - | 12.4 | 3.7 | 0.4 | 0.1 | |||
| 12.4 | - | 13.2 | 3.2 | 0.3 | 0.1 | |||
| 140 | - | 180 | 1.2 | - | 1.6 | 74.5 | 6.2 | 6.5 |
| 1.6 | - | 2.0 | 71.7 | 3.0 | 6.8 | |||
| 2.0 | - | 2.4 | 65.0 | 2.6 | 4.6 | |||
| 2.4 | - | 2.8 | 57.4 | 2.4 | 3.9 | |||
| 2.8 | - | 3.2 | 54.4 | 2.4 | 3.6 | |||
| 3.2 | - | 3.6 | 50.8 | 2.3 | 3.4 | |||
| 3.6 | - | 4.0 | 44.2 | 2.2 | 2.7 | |||
| 4.0 | - | 4.4 | 42.9 | 2.2 | 2.9 | |||
| 4.4 | - | 4.8 | 37.9 | 2.1 | 1.9 | |||
| 4.8 | - | 5.2 | 30.6 | 1.8 | 1.4 | |||
| 5.2 | - | 5.6 | 27.6 | 1.8 | 1.5 | |||
| 5.6 | - | 6.0 | 21.8 | 1.6 | 0.9 | |||
| 6.0 | - | 6.4 | 16.6 | 1.4 | 0.7 | |||
| 6.4 | - | 6.8 | 14.4 | 1.3 | 0.5 | |||
| 6.8 | - | 7.2 | 12.8 | 1.3 | 0.5 | |||
| 7.2 | - | 7.6 | 10.1 | 1.0 | 0.3 | |||
| 7.6 | - | 8.0 | 8.7 | 1.1 | 0.3 | |||
| 8.0 | - | 8.4 | 5.6 | 0.8 | 0.2 | |||
| 8.4 | - | 8.8 | 5.4 | 0.7 | 0.2 | |||
| 8.8 | - | 9.2 | 3.3 | 0.6 | 0.1 | |||
| 9.2 | - | 9.6 | 1.3 | 0.4 | 0.04 | |||
| 9.6 | - | 10.0 | 1.3 | 0.4 | 0.05 | |||
| 180 | - | 240 | 1.2 | - | 1.6 | 104.0 | 4.4 | 5.9 |
|---|---|---|---|---|---|---|---|---|
| 1.6 | - | 2.0 | 78.5 | 3.6 | 4.2 | |||
| 2.0 | - | 2.4 | 65.4 | 3.1 | 3.6 | |||
| 2.4 | - | 2.8 | 57.5 | 2.7 | 3.4 | |||
| 2.8 | - | 3.2 | 50.7 | 2.5 | 2.7 | |||
| 3.2 | - | 3.6 | 41.1 | 2.1 | 2.0 | |||
| 3.6 | - | 4.0 | 35.3 | 2.0 | 1.7 | |||
| 4.0 | - | 4.4 | 31.1 | 1.9 | 1.4 | |||
| 4.4 | - | 4.8 | 20.4 | 1.4 | 0.9 | |||
| 4.8 | - | 5.2 | 16.1 | 1.2 | 0.6 | |||
| 5.2 | - | 5.6 | 12.4 | 1.2 | 0.5 | |||
| 5.6 | - | 6.0 | 10.1 | 1.0 | 0.4 | |||
| 6.0 | - | 6.4 | 6.4 | 0.8 | 0.2 | |||
| 6.4 | - | 6.8 | 5.6 | 0.7 | 0.2 | |||
| 6.8 | - | 7.2 | 3.0 | 0.5 | 0.1 | |||
| 7.2 | - | 7.6 | 3.4 | 0.6 | 0.1 | |||
| 240 | - | 300 | 1.2 | - | 1.6 | 114.5 | 4.5 | 5.8 |
| 1.6 | - | 2.0 | 91.6 | 4.0 | 4.4 | |||
| 2.0 | - | 2.4 | 77.5 | 3.8 | 3.5 | |||
| 2.4 | - | 2.8 | 58.1 | 3.3 | 2.6 | |||
| 2.8 | - | 3.2 | 43.8 | 2.9 | 1.9 | |||
| 3.2 | - | 3.6 | 30.7 | 2.4 | 1.3 | |||
| 3.6 | - | 4.0 | 20.9 | 2.0 | 0.9 | |||
| 4.0 | - | 4.4 | 13.6 | 1.6 | 0.6 | |||
| 4.4 | - | 4.8 | 11.6 | 1.7 | 0.4 | |||
| 4.8 | - | 5.2 | 7.2 | 1.2 | 0.2 | |||
| 300 | - | 360 | 1.2 | - | 1.6 | 110.2 | 5.4 | 4.9 |
| 1.6 | - | 2.0 | 81.2 | 5.5 | 3.2 | |||
| 2.0 | - | 2.4 | 55.7 | 5.5 | 2.2 | |||
| 2.4 | - | 2.8 | 57.3 | 8.1 | 2.6 | |||
| 2.8 | - | 3.2 | 33.3 | 8.2 | 3.0 | |||
| 3.2 | - | 3.6 | 13.9 | 8.8 | 0.3 | |||
| 0 | - | 40 | 0.4 | - | 3.4 | 4.9 | 0.6 | 0.7 |
| 3.4 | - | 6.4 | 5.1 | 0.5 | 0.9 | |||
| 6.4 | - | 9.4 | 2.4 | 0.3 | 0.5 | |||
| 9.4 | - | 12.4 | 1.6 | 0.2 | 0.3 | |||
| 40 | - | 60 | 0.4 | - | 3.4 | 11.1 | 1.3 | 1.9 |
| 3.4 | - | 6.4 | 11.4 | 0.9 | 1.8 | |||
| 6.4 | - | 9.4 | 5.3 | 0.6 | 0.7 | |||
| 9.4 | - | 12.4 | 1.8 | 0.3 | 0.3 | |||
| 60 | - | 100 | 0.4 | - | 2.4 | 10.6 | 1.1 | 2.1 |
| 2.4 | - | 4.4 | 15.1 | 1.0 | 1.7 | |||
| 4.4 | - | 6.4 | 10.8 | 0.7 | 1.3 | |||
| 6.4 | - | 8.4 | 5.4 | 0.4 | 1.1 | |||
| 8.4 | - | 10.4 | 2.6 | 0.3 | 0.5 | |||
| 10.4 | - | 12.4 | 1.1 | 0.2 | 0.2 | |||
| 100 | - | 140 | 0.4 | - | 2.4 | 12.2 | 1.3 | 2.1 |
| 2.4 | - | 4.4 | 16.4 | 1.0 | 1.6 | |||
| 4.4 | - | 6.4 | 7.2 | 0.5 | 0.7 | |||
| 6.4 | - | 8.4 | 2.8 | 0.3 | 0.5 | |||
| 8.4 | - | 12.4 | 0.4 | 0.1 | 0.1 | |||
| 140 | - | 180 | 0.4 | - | 2.4 | 13.7 | 1.8 | 2.1 |
| 2.4 | - | 4.4 | 11.6 | 0.8 | 1.1 | |||
| 4.4 | - | 6.4 | 3.7 | 0.3 | 0.3 | |||
| 6.4 | - | 9.4 | 0.9 | 0.1 | 0.1 | |||
| 180 | - | 240 | 0.4 | - | 2.4 | 14.5 | 1.8 | 2.5 |
| 2.4 | - | 4.4 | 7.7 | 0.5 | 0.5 | |||
| 4.4 | - | 9.4 | 0.7 | 0.1 | 0.1 | |||
| 240 | - | 300 | 0.4 | - | 3.4 | 12.8 | 1.3 | 2.6 |
| 3.4 | - | 9.4 | 0.4 | 0.1 | 0.1 | |||
| 0 | - | 40 | 0.4 | - | 4.4 | 2.0 | 0.3 | 0.2 |
| 4.4 | - | 7.4 | 3.9 | 0.4 | 0.6 | |||
| 7.4 | - | 10.4 | 5.5 | 0.4 | 0.8 | |||
| 10.4 | - | 13.4 | 6.0 | 0.4 | 0.7 | |||
| 13.4 | - | 17.4 | 5.9 | 0.4 | 0.7 | |||
| 17.4 | - | 21.4 | 2.8 | 0.3 | 0.2 | |||
| 40 | - | 60 | 0.4 | - | 4.4 | 5.3 | 0.8 | 0.7 |
| 4.4 | - | 7.4 | 7.4 | 0.7 | 0.8 | |||
| 7.4 | - | 10.4 | 8.4 | 0.6 | 0.8 | |||
| 10.4 | - | 13.4 | 7.4 | 0.5 | 0.6 | |||
| 13.4 | - | 17.4 | 4.0 | 0.3 | 0.7 | |||
| 17.4 | - | 21.4 | 1.0 | 0.1 | 0.1 | |||
| 60 | - | 100 | 0.4 | - | 2.9 | 5.8 | 0.9 | 0.8 |
| 2.9 | - | 4.4 | 8.2 | 0.8 | 1.8 | |||
| 4.4 | - | 6.4 | 8.6 | 0.5 | 1.3 | |||
| 6.4 | - | 8.4 | 7.7 | 0.4 | 0.8 | |||
| 8.4 | - | 10.4 | 6.0 | 0.3 | 0.6 | |||
| 10.4 | - | 12.4 | 3.5 | 0.3 | 0.5 | |||
| 12.4 | - | 18.0 | 1.2 | 0.1 | 0.1 | |||
| 100 | - | 140 | 0.4 | - | 2.9 | 8.2 | 0.9 | 1.5 |
| 2.9 | - | 4.4 | 10.3 | 0.7 | 1.9 | |||
| 4.4 | - | 6.4 | 6.9 | 0.4 | 1.0 | |||
| 6.4 | - | 8.4 | 4.4 | 0.3 | 0.6 | |||
| 8.4 | - | 11.0 | 1.8 | 0.2 | 0.3 | |||
| 11.0 | - | 16.4 | 0.2 | 0.04 | 0.03 | |||
| 140 | - | 180 | 0.4 | - | 2.9 | 9.7 | 1.0 | 1.5 |
| 2.9 | - | 4.4 | 9.5 | 0.6 | 0.9 | |||
| 4.4 | - | 6.4 | 5.0 | 0.3 | 0.8 | |||
| 6.4 | - | 8.0 | 2.0 | 0.2 | 0.3 | |||
| 8.0 | - | 11.4 | 0.5 | 0.1 | 0.1 | |||
| 180 | - | 240 | 0.4 | - | 2.4 | 10.0 | 1.0 | 0.9 |
| 2.4 | - | 4.4 | 7.6 | 0.4 | 0.7 | |||
| 4.4 | - | 6.4 | 2.2 | 0.2 | 0.3 | |||
| 6.4 | - | 11.0 | 0.3 | 0.1 | 0.1 | |||
| 240 | - | 300 | 0.4 | - | 2.4 | 7.4 | 1.0 | 1.3 |
| 2.4 | - | 4.4 | 5.4 | 0.4 | 0.5 | |||
| 4.4 | - | 10.4 | 0.3 | 0.04 | 0.1 | |||
| 300 | - | 420 | 0.4 | - | 3.0 | 7.2 | 0.7 | 0.9 |
| 3.0 | - | 5.6 | 0.9 | 0.1 | 0.2 | |||