SNe Ia as a cosmological probe
Abstract
Type Ia supernovae luminosities can be corrected to render them useful as standard candles able to probe the expansion history of the universe. This technique was successful applied to discover the present acceleration of the universe. As the number of SNe Ia observed at high redshift increases and analysis techniques are perfected, people aim to use this technique to probe the equation of state of the dark energy. Nevertheless, the nature of SNe Ia progenitors remains controversial and concerns persist about possible evolution effects that may be larger and harder to characterize than the more obvious statistical uncertainties.
keywords:
SNe Ia, dark energyPACS numbers:
1 Introbuction
“Guest stars”, the name given to supernovae by ancient Chinese astronomers, have been recorded for several thousands of years, but the first modern study of supernovae began on the 31 August 1885. On that day, Hartwig discovered a “nova” in M31, which disappeared 18 months later. In 1919, Lundmark[1] noticed that the distance to M31 is about 0.7 million ly (later studies found it to be actually 2.5 million ly), which implies that the Hartwig “nova” is brighter than other novae by three orders of magnitude. The term “supernova” was coined shortly after. Later, it was realized that supernovae can be a powerful tool for measuring the distance to extragalactic sources. However, for want of detailed enough observed spectra, supernovae were not classified until 1940[2]. With the advent of consistently accurate observed spectra, it was finally realized that there are two physically distinct classes of supernovae: thermonuclear supernovae, i.e. SNe Ia, and core collapse supernovae, including SN IIP, IIL, IIn, IIb, Ib and Ic[3]. Type I supernovae are distinguished by the absence of hydrogen lines in their optical spectra. SNe Ia are defined by a deep absorption trough around 6150 , which is now known to be due to silicon, additionally[3].
Due to the homogeneity of their properties, SNe Ia are often used to measure distance. Here, we will review the methods commonly used to standardize SNe Ia for this purpose in Section. 2, and the progenitor problem in Section. 3. In 4, we discuss the effect of different populations of SNe Ia on their brightness. In Section. 5, we will present the application of SNe Ia in cosmology, i.e. the discovery of accelerating cosmic expansion, and the efforts to probe the equation of the state of dark energy. Finally, we summarize the future promise for SNe Ia as the probe to precision cosmology in Section. 6.
2 SNe Ia as a standardizable distance candle
Generally, for two nearby objects () with astronomy apparent magnitudes and , so that a Euclidean spatial geometry can be assumed, the ratio of their apparent brightness, , is related by the following equation,
| (1) |
which indicates that if the apparent magnitudes of one object is lower than that of another one by 5 magnitudes, the object is brighter than another by 100 times. For the same object, its apparent magnitudes at 10 parsecs is defined as absolute magnitude, which may reflect its intrinsic luminosity. Assuming the absence of extinction by dust, its apparent magnitude, , and absolute magnitude, , follow the equation
| (2) |
where is the apparent brightness at 10 parsecs, the observed brightness, and the distance to the object in units of parsecs. Equation (2) basically expresses the inverse-square law between apparent brightness and distance. Therefore, apparent magnitude, absolute magnitude and distance are related by the following equation,
| (3) |
and is called distance modulus. As we shall discuss later in Section. 5, at larger redshifts, for which does not hold, the relation between apparent and absolute magnitude is no longer so simple and depends on the details of the cosmological model assumed. If there is a method to independently obtain the absolute magnitude of an object, the distance may be obtained by measuring its apparent magnitude, like equation (3), and then this object may be taken as a standard candle to measure distance. SNe Ia are excellent candidates for standard candles after corrected by some methods.
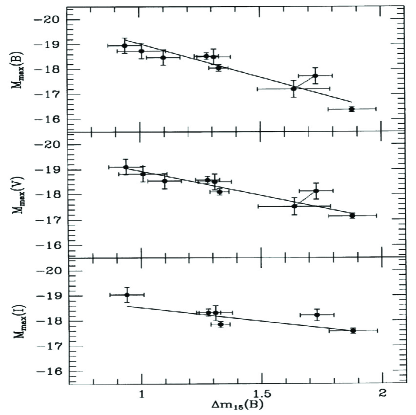
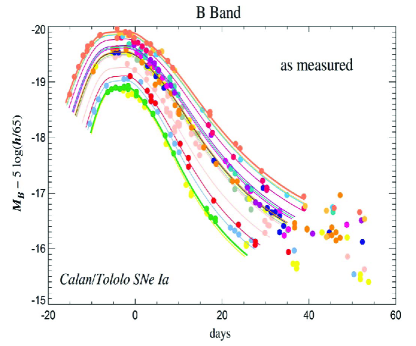
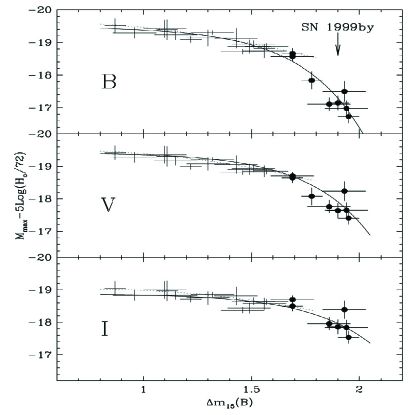
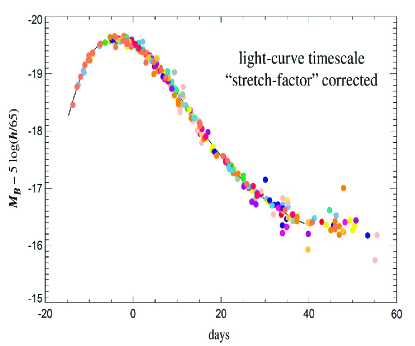
Among all the sub-classes of different supernovae[3], SNe Ia are the most homogeneous, with many practically identical properties, e.g. light curve shape, maximum luminosity, spectrum, and as a result, SNe Ia were taken to be perfect standard candles[4]. However, 1991 was a fateful year for SNe Ia studies, two peculiar SNe Ia were found, SN 1991bg and 1991T. SN 1991bg was fainter than normal SNe Ia by about 2 magnitudes in the V band[5, 6], while SN 1991T was brighter than normal SNe Ia by 0.4 magnitudes[7, 8]. The discovery of these two peculiar SNe Ia implies a distance error of about 30% if SNe Ia are assumed to be perfect standard candles. As shown by the collection of different supernova lightcurves in Fig. 1, different SNe Ia have different peak brightnesses. It became a matter of critical importance to find a way to reduce the distance error originating from this heterogeneity of SNe Ia[106]. In 1993, Phillips[10] discovered that the absolute magnitude at maximum light of SNe Ia and the speed at which the luminosity fades in the B-band (blue light) over the 15 days after the maximum light are related, as shown in Fig. 2. This relation implies that the brightness of SNe Ia is mainly dominated by one parameter, and it is widely agreed that this parameter is the amount of 56Ni produced during the supernova explosion that determines its maximum luminosity. Actually, one may arrive at another conclusion from Fig. 2, that the intrinsic magnitude dispersion of SNe Ia in the I band is smaller than those in the B and V bands, i.e. the infrared measurement of SNe Ia may yield a more precise distance. However, several years later, after increasingly dim SNe Ia were included, the linear relation was found to be a quadratic or an exponential relation as shown in Fig. 3[11, 12]. Although this relation is widely accredited to Phillips, it was originally discovered by Rust[13] and Pokovskii[14, 15], who noticed the correlation between the maximum light of SNe Ia and their light decline rate.
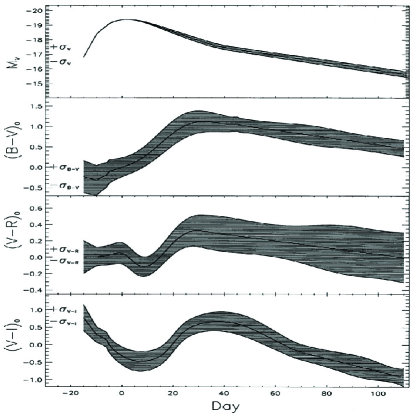
Following the discovery of Phillips[10], several groups developed further improved methods to reduce the distance error, and SNe Ia were not a standard candle any more, but a distance indicator. Most notably, Riess et al.[16, 17] developed the mult-color light-curve shapes(MLCS) method, which is known as the most mathematically sound method for inferring a distance. The method account for the non-uniform error on the distance from the effect of different bands and different supernova colors. In this method, a “training set” of several SN Ia light curves was constructed, and a complete model of the light curves is dependent on three parameters, i.e. a distance modulus, a brightness offset which is called “luminosity correction”, and an extinction value. To calibrate the brightness of the training set, the distance modulus and the extinction value are obtained by independent methods. Actually, the brightness offset reflects that a SN Ia with a broader light curve has a higher peak luminosity, i.e. the Phillips relation. The reason that a correction was made for color is that redder SNe Ia are generally less luminous, both in intrinsic terms, and for dust reddening considerations[16, 18]. Compared to the Phillips relation, although the MLCS method does not significantly increase the precision of distance measurements, the method may be the most complete and rigorous mathematically. Fig. 4 shows the typical dispersions of light and color curves after correction by the MLCS method, and from the figure, we can see that the SNe Ia can be very good distance indicators, because the dispersion at peak brightness is very small. Almost at the same time, Perlmutter et al.[19, 20] developed another tool, named the stretch factor method. This method has a similar distance precision compared with the MLCS method, as shown in Fig. 5, where the data are the same to those in Fig. 1. Again, SNe Ia are proven to be potent distance indicators. It is worth noting that the MLCS method and the stretch factor method essentially take advantage of the same underlying phenomena as that underlying the Phillips relation, i.e. the slower the lighcurve evolves, the brighter the SN Ia. To obtain the parameters crucial to the implementation of these methods, various algorithms have been developed to fit the light curves of SNe Ia data, such as BATM, MLCS2k2, SALT2, and SiFTO[21, 22, 23, 24, 25, 26].
Other research groups have also tried to find other methods to obtain more accurate SNe Ia distance measurements. For example, in 1995, Nugent et al.[27] noticed a linear relation between the maximum luminosity of a SN Ia and the ratio of the fractional depth of the bluer to that of the redder absorption trough of its silicon absorption line, or the flux ratio over the Ca II, H and K absorption features in a spectrum near maximum light (see also [28, 29]). SNe Ia were therefore calibrated to be practical standard candles, and have been applied successfully for cosmological purposes, ultimately leading to the discovery of the accelerating expansion of the Universe[17, 20].
The above methods generally decrease the distance error to 5% - 10%. However, for a well-observed sample, the typical dispersion on a Hubble diagram may be as small as 0.12 mags, indicating a typical distance accuracy of 5% for a single SN Ia. In 2005, Wang et al.[30] found that the peak brightness of SNe Ia and their colors at 12 days after peak B-band luminosity were strongly correlated. Calibrating SNe using this correlation, the typical error of the SNe Ia on a Hubble diagram can be reduced to less than 0.12 mags. For a typical sample of SNe Ia with little reddening from host galaxies, the scatter may drop further to only 0.07 mag, or 3%-4% in distance [30, 31]. Here, it must be emphasized that for most cases, the observational error is not mainly due to imperfections in the observational apparatus, but rather from a lack of uninterrupted telescope time, i.e. it is difficult to obtain a complete light curve for each single object. Recently, in addition to the light-curves and the colors of the SNe Ia, some spectra properties were found to be helpful for improving the accuracy of derived distances to SNe Ia[28, 29, 32, 33].
For precision cosmology, within most redshift intervals, systematic errors from the above correlations dominate over the statistical errors, the latter of which can be dealt with by increasing the size of an observational sample[34, 35, 36]. The dominant systematic uncertainties for SNe Ia are survey-dependent. As far as what the uncertainties are and how they can be improved are concerned, one may refer to relevant detailed reviews[37, 38, 39].
3 Progenitors of type Ia supernovae
In 1960, Hoyle & Fowler[40] suggested that a degenerate white dwarf (WD) may ignite a runaway thermonuclear fusion in its center, and the released energy may disrupt the whole WD, resulting in a type Ia supernova (SN Ia) explosion. Owing to a series of breakthroughs on the subject since then, it has been indisputably proven that all SNe Ia arise from such explosions of carbon-oxygen white dwarfs (CO WDs) in binary systems, of which the most substantial evidence is derived from the observation of SN 2011fe [41]. For a CO WD to undergo such an explosion, it must reach or exceed a mass of about 1.4 , henceforth referred to as the Chandrasekhar mass limit. The limit was named after Subrahmanyan Chandrasekhar, who was the first person to work out that there was a maximum mass for a white dwarf to be supported by electron degeneracy pressure. He did this by combining quantum theory with relativity, and it was the first time to make a quantitative prediction about the maximum mass of WDs. In 1983, he was awarded the Nobel Prize in Physics mainly due to the discovery of the mass limit of WDs.
However, the mass of a CO WD at birth cannot be more than 1.1 [42, 43], according to canonical stellar evolutionary theory, and therefore the CO WD must accrete additional material somehow (i.e. from its companion in a binary system), and gradually increase its mass to the aforementioned maximum stable mass before it can achieve this state and undergo a SN explosion. The details of this accretion process will be discussed later. During a SN Ia explosion, nearly half of the mass involved is depleted and synthesized into radioactive 56Ni, the radioactive energy of which is then injected into the supernova ejecta, heating it to the point where it becomes very luminous, ultimately resulting in the emissions which we observe[44]. The amount of 56Ni resulting from a SN explosion is the dominant determining factor behind the maximum luminosity of the SN Ia[45]. However, despite all that we know, there still remain quite a few unresolved problems where SNe Ia are concerned. To name but a few, what are the progenitors of SNe Ia, or how does a CO WD increase its mass to the Chandrasekhar limit? How exactly does the WD explode? Do the basic properties of SNe Ia remain constant with redshift? Among all these basic problems, the most urgent is the one regarding the progenitors of SNe Ia, which can potentially affect the precision of distance measuring via SNe Ia, and hinder the development of precision cosmology. More specifically, the progenitor problem is important, for cosmology as well as for other areas of astrophysics, in the following ways. 1) When measuring the cosmological parameters with SNe Ia, one needs to know of any possible evolution of the luminosity and birth rate of SNe Ia as a function of redshift, which is mainly determined by the progenitor model. 2) The progenitor model provides basic input parameters for explosion models of SNe Ia. 3) Galactic chemical evolution models require some basic parameter input, such as the stellar feedback from SNe Ia, both chemical and radiative. These basic input parameters are closely related to the progenitor models of SNe Ia. 4) The identification of the progenitor systems of SNe Ia may constrain binary evolution theory[46, 47, 48, 49].
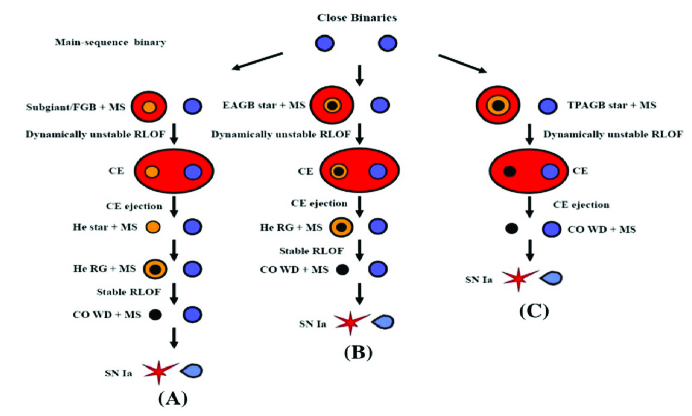
Over the course of the last 3 decades, several progenitor models were discussed by many research groups. These models may be categorized based on the nature of the proposed companion of the CO WD, and we list the most notable ones below. 1) The single degenerate (SD) scenario[50, 51]: In this scenario, the companion may be a main sequence star, a subgiant, a red giant or a helium star[52, 53, 54, 55, 56, 57]. The accreted hydrogen-rich or helium-rich material undergoes stable burning on the surface of a CO WD, yields carbon and oxygen, which is then deposited onto the WD. When the WD mass reaches some value approaching the Chandrasekhar mass limit, a SN Ia is produced. The companion survives after the supernova explosion. This scenario is widely accepted and is the leading scenario. 2) The double degenerate (DD) scenario: In this scenario, a binary system comprising two CO WDs loses its orbital angular momentum by means of gravitational radiation, and merges as a consequence. If the total mass of the merger exceeds the Chandrasekhar mass limit, a SN Ia may be expected[58, 59, 60, 61]. In this scenario, the merger is disrupted completely and the companion does not survive. Note, however, it is possible that the merger product may experience a core collapse rather than a thermonuclear explosion[62, 63]. The SD and DD scenarios are the two main competing scenarios in the SN Ia community. Generally, to form a SD system leading to a SN Ia, a primordial binary system needs to experience one common envelope phase, while to form a DD system, the situation is more complicated and one extra common envelope phase can be necessary. For example, in Fig. 6, three sub-channels lead to a WD + main sequence system ending in a SN Ia explosion, and for every sub-channel, the system experiences a single common envelope phase only (see details in Wang & Han[48]).
In addition to the models mentioned above, the double-detonation model (sub-Chandrasekhar mass model) is also frequently discussed. In this model, the companion of the CO WD is a helium WD or a helium star, which fills its Roche Lobe and initiates a stable mass transfer. If the mass-transfer rate is not high enough, the helium material may not burn stably, and as a consequence gradually accumulates on the CO WD. When the helium layer is massive enough, a detonation, which is a supersonic blast wave, is ignited at the bottom of the helium layer, in which the critical mass to ignite a detonation is generally dependent on the WD mass and the mass transfer rate[64]. At the moment of the ignition, the WD is generally less massive than the Chandrasekhar mass limit. The resulting detonation wave compresses the inner CO material, leading to a second detonation near the core of the CO WD[65, 66, 67]. After the supernova explosion, a low mass helium star or a low mass helium WD may survive to form a hyper-velocity star, whose velocity is high enough to exceed the escape velocity of its parent galaxy[68]. Remarkable progress has been made on this model recently, though many problems still exist[69, 70]. If this model does indeed produce SNe Ia, it would contribute quite significantly to SNe Ia rates[71].
Besides the SD and DD scenarios and the double detonation model, other similar models have been proposed to explain the diversity generally observed among SNe Ia, such as the the super-Chandrasekhar mass model, the single star model, the spin-up/spin-down model, the delayed dynamical instability model, the core-degenerate model, the model of a collision between two WDs, and the model of WDs near black holes, etc. (See Wang & Han [48] for a review). At present, it is premature to exclude any of these models conclusively, and no single model can explain all the properties of SNe Ia alone. It is possible that many of these models, or at least both the SD and DD scenarios, contribute to SNe Ia[48, 49, 72, 73].
4 Effect of SN Ia populations on their brightness
When applying SNe Ia as cosmological standard candles, it is usually assumed that their properties and the above calibrated relations are invariant with redshift, i.e. the demographics of SNe Ia does not evolve with redshift, or the difference between SNe Ia arising from different stellar populations is negligible. This assumption is crucial for precision cosmology, since it may lead to systematic errors in the measurements of cosmological parameters. One way to test this assumption is to search for correlations between the properties of SNe Ia and those of their environments, since the environments of SNe Ia can represent the host population which gives rise to SNe Ia to a great extent. By the merit of these studies, it is now known that SN light curves and peak luminosities are correlated with host galaxy star formation rate, host population age, galaxy mass and metallicity[74, 75, 76, 77].
Even before SNe Ia were applied to measure cosmological parameters, it was generally agreed upon that the brightest SNe Ia always occur in late-type galaxies[78]. It should be noted, however, that both late- and early-type galaxies can host dimmer SNe Ia, and sub-luminous SNe Ia tend to be discovered in galaxies with a significant old population[79], which leads to a lower mean peak luminosity for SNe Ia in early-type galaxies than in their late-type counterparts[78, 80]. In addition, the mean peak brightness of SNe Ia in a galaxy are more homogeneous in the outer than in the inner regions[81, 82]. Also, both the birth rate and luminosity of SNe Ia trace the star formation rate of host galaxies[77, 74]. All these observations seem to imply that age is one of the factors which affect the luminosity of SNe Ia, and that dimmer SNe Ia can arise from progenitors spanning a wide range of ages[75, 76, 83, 84, 85]. Considering that typical galactic star formation rates increase by a factor of up to , one may expect that the luminosities of SNe Ia will generally increase with redshift, and it has been shown that the mean “stretch factor” increases as well[86, 87]. According to these observations, we may conclude that the average value of the maximum luminosities of SNe Ia, as well as the range over which they span, both decrease with their delay time. It can also be concluded that, should the maximum luminosity be determined by only one parameter, as postulated by the Phillips relation[10], it can be expected that the possible range of the parameter must decrease, and that its mean value must either increase or decrease with the age of SNe Ia. At present, although it has been widely accepted that the peak luminosity of SNe Ia is dictated by the quantity of 56Ni produced during their explosion, it is still controversial which parameter physically determines the 56Ni production[88]. The dimmer brightness for an old SN Ia could be either due to a high ignition density for a long cooling time before accretion[89, 90], or due to a lower carbon abundance requirement for a massive WD with a less massive secondary under the frame of the SD model[91, 92, 93]. In addition, the total mass of the DD systems was suggested to the origin of the brightness variation of SNe Ia[37, 94], but it seems not to fit the age constrains on the brightness of SNe Ia from observations[95].
Metallicity is another factor affecting the luminosity of SNe Ia[75, 76, 77, 96, 97]. Theoretically, high metallicity progenitors would produce sub-luminous SNe Ia: a high 22Ne abundance in high metallicity white dwarfs generates more neutrons to feed the explosion nucleosynthesis, yielding more stable 58Ni, a process which consumes the radioactive 56Ni powering the lightcurve of SNe Ia[98]. The spectra of high-z SNe Ia, whose metellicity is on average lower than that of local SNe Ia, contain less intermediate mass elements, which is consistent with the idea that these SNe Ia produce more 56Ni to power their luminosity[87]. Metallicity may lead to a % variation on the peak luminosity of SNe Ia, but observation has shown that metallicity might only have a % effect on this luminosity[75]. Such a difference between theory and observation could be the result of a metellicity-age-carbon abundance degeneracy, or an unknown metallicity effect. A high metallicity may lead to a relatively shorter delay time[95, 99, 100], regardless of what the progenitor model is, and hence a slightly brighter SNe Ia. On the other hand, a star of given mass with a high metallicity will produce a relatively less massive WD[42, 43] that has a higher carbon abundance[92], which was suggested to produce a brighter SNe Ia[92, 93]. Therefore, the effect of metallicity on the peak luminosity of SNe Ia could be more complex than what one would imagine at first glance.
The mass of a host galaxy may also significantly affect the properties of SNe Ia. For example, many observations have shown that the birth rate of SNe Ia depends heavily on the mass of their host galaxies[101, 102, 103]. Compared with the age and metallicity, the effect of the mass of host galaxies could be more significant[77, 84, 96, 104, 105]. More massive galaxies tend to give rise to dimmer SNe Ia[77, 105], a trend which seems to be a combined result of the effects of age and metallicity on the brightness of SNe Ia, i.e. higher mass galaxies have the tendency to retain more metals due to gravitational effects, and at the same time, tend to have more old stars, supergiant elliptical galaxies in particular.
The above facts imply that the peak luminosities of SNe Ia evolve with redshift. Despite this, if the absolute magnitude of SNe Ia corrected by their lightcurve shape and color does not change with redshift, it is not necessarily problematic to take SNe Ia as standard candles for cosmology. However, people have to face an embarrassing situation that the age, metallicity and host galaxy mass have a systemic effect on the brightness of SNe Ia even after their brightness was corrected by the lightcurve shape and color[77, 84, 96, 97, 104, 105].
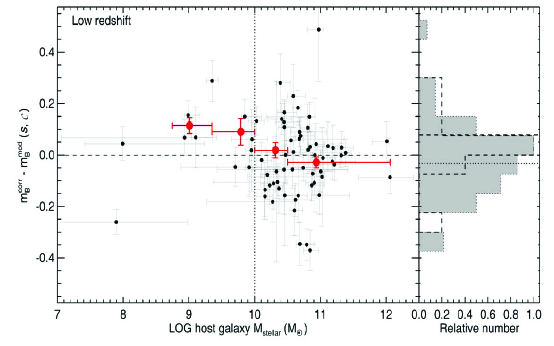
For example, as shown in Fig. 7, Sullivan et al.[77] found that SNe Ia originating in massive host galaxies and galaxies with low specific star-formation rates, of the same light curve shape and color, are generally 0.08 mags brighter than those found anywhere else. This result does not depend on any assumed cosmological model or SN light-curve width. Such a trend may lead to a systematic error on the measurement of the equation of state of dark energy, if it is not corrected. Therefore, besides the lightcurve shape and the color, at least a third parameter to correct the brightness of SNe Ia, which is correlated to one or more properties of the host galaxies, must be incorporated to avoid systematic Hubble diagram residuals.
5 SN Ia’s role in cosmology
The previous sections have discussed the properties of SNe Ia with an emphasis on the corrections that can be applied to compensate for the variations in the absolute luminosities and also in their spectra.222When the apparent luminosities of objects at differing redshifts are being compared, care must be taken to correct for the redshifting of the spectral bands. This is known as the so-called ‘K-correction’. In this section we focus on how equation (3) must be modified when the condition no longer holds. We emphasize how information concerning the cosmological model can be extracted from the observed redshift-apparent magnitude relation.
To this end we must first refine our definition of distance, which is complicated by the expansion of the universe. The ‘co-moving’ distance to an object at redshift is given by the integral
| (4) |
where is the Hubble constant, which is a function of , and is its present value. For a universe filled with radiation, matter, and a cosmological constant
| (5) |
where In the case of a ‘quintessence’ or ‘dark energy’ component of constant instead of a cosmological constant (with ), we would replace the term with For (a spatially flat universe), the ‘co-moving’ distance as defined above coincides with the ‘angular-diameter’ distance but in the presence of a nonflat spatial geometry,
| (6) |
Finally, the ‘luminosity’ distance is defined in terms of the ‘angular-diameter’ distance according to
| (7) |
where the factor has been inserted in order to account for two effects: (1) as a photon propagates from redshift to us today, its energy is redshifted, or diminished, by a factor of and (2) the rate of emission of photons is lowered by a factor of in terms of today’s time, rather than the time at the instant of emission.
It follows that using the formula
| (8) |
where is the absolute (bolometric) luminosity and is the apparent (bolometric) luminosity holds for all redshifts when the luminosity distance as defined above is used.
The object of cosmological supernova studies is to measure the function beyond its first-order linear term whose coefficient is By measuring the higher-order corrections (quadratic order and beyond), we uncover the equation of state of what is driving the present expansion of the universe, and through the cubic and higher terms discover how this equation of state evolved with redshift. The SN Ia’s role in cosmology has been reviewed by many authors and further details on this technique can be found in the these reviews[38, 39, 106, 107]. Here, we summarize some historic events in this field.
In 1927, Lemaître[108] deduced that the velocity of recession of distant objects relative to an observer can be approximated to be proportional to distance, should Einstein’s general relativity equation be assumed to be true. In 1929, Hubble[109] noticed that a linear relation actually exists between an object’s recession velocity and its distance, judging by 22 external galaxies. This relation was henceforth named Hubble’s law, and hallmarks the discovery of the expansion of the universe. After this discovery, two questions arise naturally, i.e. what is the future of the universe, and what are the energy sources driving the expansion of the universe. To answer these questions, one needs to measure the recession velocity variation as a function of time or redshift, i.e. the deceleration parameter of the expansion . In modern cosmology, including Einstein’s cosmological constant[110], the cosmic deceleration parameter is defined as
| (9) |
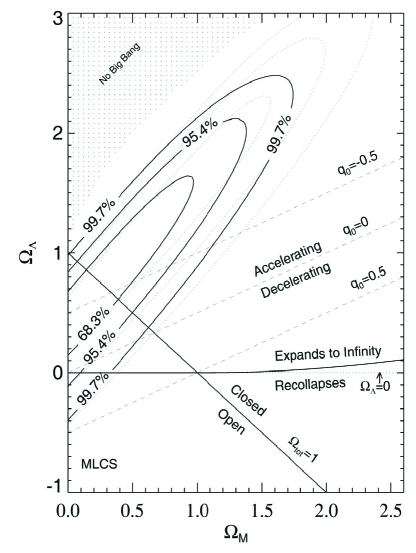
where is the ratio between the actual mass density of the universe and the critical density above which the universe would collapse again someday if , which is only dependent on the actual mass density of the universe, and describes how the cosmological constant affects the expansion of the universe[107]. For a universe of , the behavior of the universe is determined by and together. leads to a constant expansion velocity, an accelerating expansion, and a decelerating expansion. It can be clearly seen in the equation that the expansion of the universe is accelerating if . For a universe of , , and therefore, the universe is always decelerating, where , and corresponds to the closed, flat and open universe, respectively (please see Fig. 8).
Although it was known that SNe Ia are very good standard candles[4], significant progress on this subject had yet to be made until the 1990s, after the advent of CCD imagers[111, 112]. In the 1990s, two teams focused on the measurement of the distance to high-z supernovae, i.e. the Supernova Cosmology Project (SCP) and the High-z team (HZT). Both teams built up large samples, including those measured by the Hubble Space Telescope (HST), and then individually published their twin studies[17, 20]. In the twin studies, they adjusted the parameters of an (, ) universe to fit their data, as shown in Fig. 8 which is an example from Riess et al.[17], and obtained a similar conclusion. The surprising result is that high-z SNe Ia were observed to be fainter than expected from their low-z counterparts in a matter-dominated universe. A matter-dominated closed universe (i.e. ) was unambiguously ruled out at a confidence level of greater than 7 . Neither does an open, cosmology fit the data well; the cosmological constant is nonzero and positive, with a confidence level of P()=99%. For a flat universe ( + =1), a positive was found to be required at a confidence level of 7 . Actually, the probability of an accelerating expansion of the universe with (, , ) was modest, typically 3 or less, i.e. the confidence level for a dominated accelerating expansion was less than 3 . For a flat universe, the best-fit parameters are and , which supported an accelerated expansion as derived from equation (9). The twin studies are regarded as the original evidence for the discovery of the accelerating-expansion universe, and in 2011, Saul Perlmutter, Brian Schmidt and Adam Riess were awarded the Nobel Prize in Physics for the discovery. It should be noticed that the expansion of the universe is actually evolving. At , the density of matter and dark energy was equal, and matter dominated at early epochs, i.e. the expansion of the universe was decelerating at [39].
The discovery of accelerating expansion today implies that our universe is dominated by some unknown form of energy, which is often characterized by the ratio of pressure to density, i.e. the dark energy equation of state, . For some arbitrary length scale , the density of the universe evolves as
| (10) |
From this equation, it is easily seen that for normal matter, i.e. the density decreases as the universe expands. If , which corresponds to Einstein’s cosmological constant, its density is a constant, and does not dilute with the expansion of the universe. A value of is permitted although it is debatable theoretically. In this situation, the dark energy density will increase with time, and may ultimately lead to the destruction of galaxies[37, 113]. If , the dark energy density will decrease with time, and it will become problematic whether the expansion of the universe will continue to accelerate if the value of is large enough. Were assumed to be negligible, a value of for dark energy would be sufficient for the indefinite acceleration of its expansion. However, considering that it is very likely for to have a value of larger than 0.2[17, 20], the dark energy has to have an even smaller value of for this to happen. It is verified that the critical point for the expansion of the universe to continue accelerating is in fact [114]. However, it is possible that is not a constant, but rather a variable which also evolves with time in the general form , where will be a constant if .
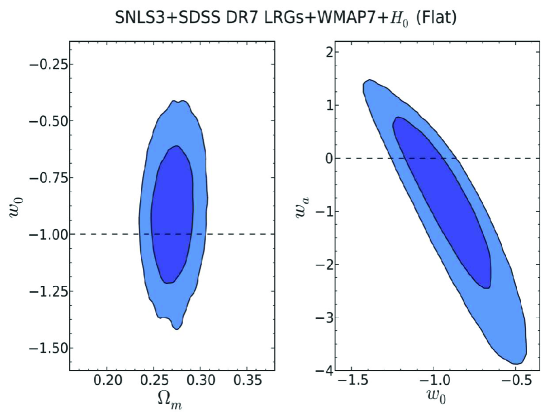
Following the discovery of dark energy, the equation of the state of dark energy (EOSDE) and the evolution of EOSDE with time became burning issues. Although the measurement of is still consistent with an accelerating expansion of the universe, the uncertainty of is still very large in those early observations. The value of was generally located between and at a typical confidence level of 95%[22, 114, 115]. Today, more and more evidence based on SNe Ia observations from SNe Ia groups and other observational constraints, such as those from Supernova Legacy Survey (SNLS), Harvard-Smithsonian Center for Astrophysics (CfA), Sloan Digital Sky Survey (SDSS) and SCP, supports a flat universe with a constant , i.e. at least rapidly evolving forms of dark energy were ruled out although the current observational constraints on are weak[34, 35, 36, 116, 117, 118, 119, 120]. For example, in Fig. 9, combined with full Wilkinson Microwave Anisotropy Probe 7-year (WMAP7) power spectrum, SNLS3 and SDSS DR7 data, , and were obtained, which are consistent with a flat, universe[120]. For most of these studies, the HST played a vital role in determining the cosmological parameters, and provides many high-quality, high-z observation which remain one of our most efficient tools for understanding the properties of dark energy[115, 116, 121]. An event at was even discovered recently by HST, whose magnitude is consistent with that expected from CDM cosmology[122].
6 Issues and prospects
SNe Ia are now applied to constrain the properties of the dark energy and the evolution of the properties with time. Although SNe Ia may provide more strict constraints than some other surveys, such as baryon acoustic oscillations (BAO) and weak gravitational lensing (WL), the combination of the results from more than one survey is often applied to constrain the EOSDE parameter[113, 120]. For dark energy, a change of 1% in only leads to a change of 3% in dark energy density at redshift and a change of 0.2% at - [113]. Therefore, to study the properties of the dark energy quantitatively, a precision of better than 2% is required[123]. However, even for the most well-observed sample, the present distance accuracy seems not to be good enough. At present, a well-observed low redshift sample may fulfill the requirement of 2% precision, but the distance error increases to 5% at redshifts greater than 1[106, 127]. As we know, SNe Ia with redshifts greater than 1 provide the best constraints on the EOSDE.
For precision cosmology, there are still several difficulties with regard to SNe Ia. Firstly, not all SNe Ia may be taken to be distance indicators, such as 2002cx-like supernovae[124]. Such SNe Ia conform to no relations which regular SNe Ia do, such as the Phillips relation, and therefore cannot be standardised. Another sub-class of SNe Ia that do not adhere to the Phillips relation are the so-called super-luminous SNe Ia[125]. If these peculiar supernovae are not excluded from a SNe Ia sample, the confidence level of the resulting distance measurement would decrease greatly. Secondly, new light curve analysis methods which have been developed tend to be based on new intrinsic parameters, which are assumed either to be invariant with redshift, or at least to vary with redshift in such a way that does not introduce further systematic uncertainty. Despite the reduction of the luminosity uncertainty from 0.15 mag to less than 0.10 mag, or better than 5% in terms of distance uncertainty[126, 33], which these methods serve to achieve, such assumptions ought to be checked carefully, since it has been shown that systematic-uncertainty-inducing evolution may exist[86, 87], and besides the light-curve shape and the color, a third parameter correlated to one or some properties of the host galaxy is necessary. Finally, it is crucial to increase the detection efficiency of SNe Ia at high redshifts for further studies, especially at redshifts greater than 1. Two factors may affect this detection efficiency. One is that only luminous SNe Ia are likely to be detected due to Malmquist bias, but luminous SNe Ia are relatively rare. The other is that most of the radiation may be shifted into infrared bands for the SNe Ia at high redshifts, which makes it difficult to detect SNe Ia by optical telescopes. Infrared space telescopes, in this context, may be an alternative for future SNe Ia science[38]. For example, the recently installed Wide-Field Camera 3 on HST has granted SN surveys an unprecedented depth, i.e. it is possible to detect a typical SN Ia at by HST. Another merit of infrared observations is that the intrinsic dispersion of SNe Ia after correction is smaller than optical band as shown in Fig. 2. In addition to the difficulties mentioned above, for high-z supernovae, the confidence level for classification by spectrum is not as high as that for low-z supernovae. For a high-z SNe Ia sample, although practical studies of photometric identification have developed methods which achieve a purity of % for SNe Ia[128, 129, 130], there exists a possibility that such samples may be contaminated by a few type Ib/c supernovae[122, 131]. Therefore, techniques to remove such sample impurities need to be developed.
However, if an appropriate observational strategy is adopted, the effect of time dilation could provide a great opportunity for high-z SN observation. If the cosmological redshift is derived from the expansion of the universe, the observed time interval of an event will be dilated by a factor of , which means that the light curve of a high-z SN Ia will present a broadening peak and a more shallow slope for the later exponential decline phase. Therefore, the effect of time dilation increases the probability to detect the high-z SNe Ia, although it becomes relatively difficult to obtain a complete light curve.
Acknowledgments
We are very grateful to the anonymous referees for their kind comments that improved this manuscript greatly. This work was partly supported by NSFC (11473063,11522327, 11390374, 11521303), the Western Light Key Project of the Chinese Academy of Sciences and Key Laboratory for the Structure and Evolution of Celestial Objects, Chinese Academy of Sciences. Z.H. thanks the support by the Strategic Priority Research Program “The Emergence of Cosmological Structures” of the Chinese Academy of Sciences, Grant No. XDB09010202, and Science and Technology Innovation Talent Programme of the Yunnan Province (Grant No. 2013HA005).
References
- [1] K. Lundmark, Kungl. Svenska Vetenskapsakademiens Handlingar. 60 (1920) 1
- [2] R. Minkowski, Publ. Astron. Soc. Pac. 52 (1940) 206
- [3] A.V. Filippenko, Annu. Rev. Astron. Astr. 35 (1997) 309
- [4] D. Branch, G.A. Tammann, Annu. Rev. Astron. Astr. 30 (1992) 359
- [5] A.V. Filippenko et al., Astron. J. 104 (1992a) 1543
- [6] B. Leibundgut et al., Astron. J. 105 (1993) 301
- [7] A.V. Filippenko et al., Astrophys. J. 384 (1992b) L15
- [8] M.M. Phillips et al., Astron. J. 103 (1992) 1632
- [9] A. Kim, LBNL Report. No. LBNL-56164 (2004)
- [10] M.M. Phillips, Astrophys. J. Lett. 413 (1993) L105
- [11] M.M. Phillips, P. Lira, N.B. Suntzeff et al., Astron. J. 118 (1999) 1766
- [12] P.M. Garnavich, A.Z. Bonanos, K. Krisciunas et al., Astrophys. J. 613 (2004) 1120
- [13] B.W. Rust, PhD thesis, University of Illinois, 1974
- [14] Y.P. Pskovskii, Sv. Astron. 21 (1977) 675
- [15] Y.P. Pskovskii, Sv. Astron. 28 (1984) 658
- [16] A. Riess et al., Astrophys. J. 473 (1996) 88
- [17] A. Riess et al., Astron. J. 116 (1998) 1009
- [18] A. Conley, R.G. Carlberg, J. Guy et al., Astrophys. J. 664 (2007) L13
- [19] S. Perlmutter et al., Ap. J. 483 (1997) 565
- [20] S. Perlmutter et al., Astrophys. J. 517 (1999) 565
- [21] G. Contardo, B. Leibundgut, W.D. Vacca et al., Astron. Astrophys. 359 (2000) 876
- [22] J.L. Tonry, B.P. Schmidt, B. Barris et al., Astrophys. J. 594 (2003) 1
- [23] S. Jha, A.G. Riess, R.P. Kirshner, Astrophys. J. 659 (2007) 122
- [24] J. Guy, P. Astier, S. Baumont et al., Astron. Astrophys. 466 (2007) 11
- [25] A. Conley, M. Sullivan, E.Y. Hsiao et al., Astrophys. J. 681 (2008) 482
- [26] S. Dado, A. Dar, Astrophys. J. accepted, 2015 arXiv:1301.3333
- [27] P. Nugent, M. Phillips, E. Baron et al., Astrophys. J. Lett. 455 (1995) L147
- [28] S. Bailey, G. Aldering, P. Antilogus et al., Astron. Astrophys. 500 (2011) L17
- [29] J.M. Silverman, M. Ganeshalingam, W. Li et al., Mon. Not. R. Astron. Soc. 425 (2012) 1889
- [30] X.F. Wang, L.F. Wang, X. Zhou et al., Astrophys. J. Lett. 620 (2005) L87
- [31] X.F. Wang, L.F. Wang, R. Pain et al., Astrophys. J. 645 (2006) 488
- [32] K. Maeda, G. Leloudas, S. Taubenberger et al., Mon. Not. R. Astron. Soc. 413 (2011) 3075
- [33] A.G. Kim, R.C. Thomas, G. Aldering et al., Astrophys. J. 766 (2013) 84
- [34] R. Kessler, A.C. Becker, D. Cinabro et al., Astrophys. J. Suppl. S. 185 (2009) 32
- [35] M. Hicken, W.M. Wood-Vasey, S. Blondin et al., Astrophys. J. 700 (2009) 1097
- [36] R. Amanullah, C. Lidman, D. Rubin et al., Astrophys. J. 716 (2010) 712
- [37] D.A. Howell, Nat. Commun. 2 (2011) 350
- [38] B. Leibundgut, Annu. Rev. Astron. Astr. 39 (2001) 67
- [39] P. Astier, Rep. Prog. Phys. 75 (2012) 116901
- [40] F. Hoyle, W.A. Fowler, Astrophys. J. 132 (1960) 565
- [41] P.E. Nugent, M. Sullivan, S.B. Cenko et al. Nature. 480 (2011) 344
- [42] H. Umeda, K. Nomoto, H. Yamaoka et al., Astrophys. J. 513 (1999) 861
- [43] X. Meng, X. Chen, Z. Han, Astron. Astrophys. 487 (2008) 625
- [44] D. Branch, Nature. 431 (2004) 1044
- [45] W.D. Arnett, Astrophys. J. 253 (1982) 785
- [46] M. Livio, in Truran, J., Niemeyer, T., eds, Type Ia Suppernova: Theory and Cosmology. Cambridge Univ. Press, New York, 1999, p.33
- [47] B. Leibundgut, Astron. Astrophys. Rev. 10 ( 2000) 179
- [48] B. Wang & Z. Han, New. Astron. Rev. 56 (2012) 122
- [49] D. Maoz, F. Mannucci, G. Nelemans, Annu. Rev. Astron. Astr. 52 (2014) 107
- [50] J. Whelan, I. Iben, Astrophys. J. 186 (1973) 1007
- [51] K. Nomoto, F-K. Thielemann, K. Yokoi, Astrophys. J. 286 (1984) 644
- [52] X.D. Li, E.P.J. van den Heuvel, Astron. Astrophys. 322 (1997) L9
- [53] I. Hachisu, M. Kato, K. Nomoto, H. Umeda, Astrophys. J. 519 (1999a) 314
- [54] I. Hachisu, M. Kato, K. Nomoto, Astrophys. J. 522 (1999b) 487
- [55] N. Langer, A. Deutschmann, S. Wellstein et al., Astron. Astrophys. 362 (2000) 1046
- [56] Z. Han, Ph. Podsiadlowski, Mon. Not. R. Astron. Soc. 350 (2004) 1301
- [57] B. Wang, X. Meng, X. Chen, Z. Han, Mon. Not. R. Astron. Soc. 395 (2009) 847
- [58] I. Iben, A.V. Tutukov, Astrophys. J. Suppl. S. 54 (1984) 335
- [59] R.F. Webbink, Astrophys. J. 277 (1984) 355
- [60] R. Pakmor, M. Kromer, F. K. Röpke et al., Nature. 463 (2010) 61
- [61] M.H. van Kerkwijk, P. Chang, S. Justham, Astrophys. J. 722 (2010) L157
- [62] H. Saio, K. Nomoto, Astron. Astrophys. 150 (1985) L21
- [63] H. Saio, K. Nomoto, Astrophys. J. 500 (1998) 388
- [64] I. Iben, A.V. Tutukov, Astrophys. J. 342 (1989) 430
- [65] S.E. Woosley, T.A. Weaver, Astrophys. J. 423 (1994) 371
- [66] E. Livne, D. Arnett, Astrophys. J. 452 (1995) 62
- [67] K. J. Shen, J. Guillochon, R.J. Foley, Astrophys. J. 770 (2013) L35
- [68] S. Geier, F. Fürst, E. Ziegerer et al., Science. 347 (2015) 1126
- [69] K. J. Shen, L. Bildsten, Astrophys. J. 699 (2009) 1365
- [70] S.A. Sim, M. Fink, M. Kromer et al., Mon. Not. R. Astron. Soc. 420 (2012) 3003
- [71] A.J. Ruiter, K. Belczynski, S.A. Sim et al., Mon. Not. R. Astron. Soc. 417 (2011) 408
- [72] P. Ruiz-Lapuente, New. Astron. Rev. 62 (2014) 15
- [73] X.F. Wang, L.F. Wang, A.V. Filippenko et al., Science. 340 (2013) 170
- [74] M. Sullivan, D. Le Borgne, C.J. Pritchet et al., Astrophys. J. 648 (2006) 868
- [75] D.A. Howell, M. Sullivan, E.F. Brown et al., Astrophys. J. 691 (2009) 661
- [76] J.S. Gallagher, P.M. Garnavich, N. Caldwell et al., Astrophys. J. 685 (2008) 752
- [77] M. Sullivan, A. Conley, D.A. Howell et al., Mon. Not. R. Astron. Soc. 406 (2010) 782
- [78] M. Hamuy, M.M. Phillips, N.B. Suntzeff et al., Astron. J. 112 (1996) 2391
- [79] D.A. Howell, Astrophys. J. 554 (2001) L193
- [80] T.D. Brandt, R.Tojeiro, É. Aubourg et al., Astron. J. 140 (2010) 804
- [81] L. Wang, P. Höflich, J.C. Wheeler, Astrophys. J. Lett. 483 (1997) L29
- [82] A.G. Riess, R.P. Kirshner, B.P. Schmidt et al., Astron. J. 117 (1999) 707
- [83] J.D. Neill, M. Sullivan, D.A. Howell et al., Astrophys. J. 707 (2009) 1449
- [84] R.R. Gupta, C.B. D’Andrea, M. Sako et al., Astrophys. J. 740 (2011) 92
- [85] M. Rigault, G. Aldering, M. Kowalski et al., Astrophys. J. 802 (2015) 20
- [86] D.A. Howell, M. Sullivan, A. Conley, R. Carlberg, Astrophys. J. Lett. 667 (2007) L37
- [87] M. Sullivan, R.S. Ellis, D.A. Howell et al., Astrophys. J. Lett. 693 (2009) L76
- [88] Ph. Podsiadlowski, P. Mazzali, P. Lesaffre et al., New. Astron. Rev. 52 (2008) 381
- [89] B.K. Krueger, A.P. Jackson, D.M. Townsley et al., Astrophys. J. Lett. 719 (2010) L5
- [90] X. Chen, Z. Han, X. Meng, Mon. Not. R. Astron. Soc. 438 (2014) 3358
- [91] X. Meng, W. Yang, Astrophys. J. 710 (2010) 1310
- [92] H. Umeda, K. Nomoto, C. Kobayashi et al., Astrophys. J. Lett. 522 (1999) L43
- [93] X. Meng, W. Yang, Astron. Astrophys. 531 (2011) A94 Maoz,
- [94] D. Maoz, F. Mannucci, Publ. Astron. Soc. Aust. 29 (2012) 447
- [95] X. Meng, W. Yang, Astron. Astrophys. 543 (2012) A137
- [96] M. Childress, G. Aldering, P. Antilogus et al., Astrophys. J. 770 (2013) 108
- [97] B.T. Hayden, R.R. Gupta, P.M. Garnavich et al., Astrophys. J. 764 (2013) 191
- [98] F.X. Timmes, E.F. Brown, J.W. Truran, Astrophys. J. Lett. 590 (2003) L83
- [99] X. Meng, X. Chen, Z. Han, Mon. Not. R. Astron. Soc. 395 (2009) 2103
- [100] X. Meng, Z. Li, W. Yang, Publ. Astron. Soc. Jpn. 63 (2011) L31
- [101] F. Mannucci, Chin. J. of Astron. Astrophys. Suppl. 8 (2008) 143
- [102] W. Li, R. Chornock, J. Leaman et al., Mon. Not. R. Astron. Soc. 412 (2011) 1473
- [103] Y. Gao, C. Pritchet, Astron. J. 145 (2013) 83
- [104] J. Johansson, D. Thomas, J. Pforr et al., Mon. Not. R. Astron. Soc. 435 (2013) 1680
- [105] M. Rigault, Y. Copin, G. Aldering et al., Astron. Astrophys. 560 (2013) A66
- [106] A.G. Kim, N. Padmanabhan, G. Aldering et al., Astropart. Phys. 63 (2015) 2
- [107] S.M. Carroll, W.H. Press, E.L. Turner, Annu. Rev. Astron. Astr. 30 (1992) 499
- [108] G. Lemaître, Annales de la Société Scientifique de Bruxelles. A47 (1927) 49
- [109] E. Hubble, Contributions from the Mount Wilson Observatory. 3 (1929) 23
- [110] A. Einstein, Sitzungsberichte der Königlich Preußischen Akademie der Wissenschaften. (1917) 142
- [111] M. Hamuy, M.M. Phillips, N.B. Suntzeff et al., Astron. J. 112 (1996) 2408
- [112] M. Hamuy, M.M. Phillips, N.B. Suntzeff et al., Astron. J. 112 (1996) 2398
- [113] J.A. Frieman, M.S. Turner, D. Huterer, Annu. Rev. Astron. Astr. 46 (2008) 385
- [114] R.A. Knop, G. Aldering, R. Amanullah et al., Astrophys. J. 598 (2003) 102
- [115] A.G. Riess, L. Strolger, J. Tonry et al., Astrophys. J. 607 (2004) 665
- [116] A.G. Riess, L. Strolger, S. Casertano et al., Astrophys. J. 659 (2007) 98
- [117] G. Miknaitis, G. Pignata, A. Rest et al., Astrophys. J. 666 (2007) 674
- [118] W.M. Wood-Vasey, G. Miknaitis, C.W. Stubbs et al., Astrophys. J. 666 (2007) 694
- [119] A. Conley, J. Guy, M. Sullivan et al., Astrophys. J. Suppl. S. 192 (2011) 1
- [120] M. Sullivan, J. Guy, A. Conley et al., Astrophys. J. 737 (2011) 102
- [121] P.M. Garnavich, R.P. Kirshner, P. Challis et al., Astrophys. J. Lett. 493 (1998) L53
- [122] D.O. Jones, S.A. Rodney, A.G. Riess et al., Astrophys. J. 768 (2013) 166
- [123] P. Höflich, K. Krisciunas, A.M. Khokhlov et al., Astrophys. J. 710 (2010) 444
- [124] W.D. Li, A.V. Filippenko, R. Chornock, et al., Publ. Astron. Soc. Pac. 115 (2003) 453
- [125] D.A. Howell, M. Sullivan, P.E. Nugent et al. Nature. 443 (2006) 308
- [126] K.S. Mandel, G. Narayan, R.P. Kirshner, Astrophys. J. 731 (2011) 120
- [127] P. Astier, C. Balland, M. Brescia et al., Astron. Astrophys. 572 (2014) A80
- [128] R. Kessler, B. Bassett, P. Belov et al., Publ. Astron. Soc. Pac. 122 (2010) 1415
- [129] M. Sako, B. Bassett, B. Connolly et al., Astrophys. J. 738 (2011) 162
- [130] G. Bazin, V. Ruhlmann-Kleider, N. Palanque-Delabrouille et al., Astron. Astrophys. 534 (2011) A43
- [131] S.A. Rodney, A.G. Riess, T. Dahlen et al., Astrophys. J. 746 (2012) 5