Reconstruction of Chirp Mass in the Search of Compact Binaries
Abstract
Excess energy method is used in searches of gravitational waves (GWs) produced from sources with poorly modeled characteristics. It identifies GW events by searching for a coincidence appearance of excess energy in a GW detector network. While it is sensitive to a wide range of signal morphologies, the energy outliers can be populated by background noise events (background), thereby reducing the statistical confidence of a true signal. However, if the physics of the source is partially understood, weak model dependent constraints can be imposed to suppress the background. This letter presents a novel idea of using the reconstructed chirp mass along with two goodness of fit parameters for suppressing background when search is focused on GW produced from the compact binary coalescence.
pacs:
95.85.Sz, 04.80.Nn]Dated:
I Introduction
Laser Interferometer Gravitational-Wave Observatory (LIGO) is a large-scale physics experiment targeting the first direct detection and study of gravitational waves from astrophysical sources LIGO . Two LIGO detectors in Livingston, LA and Hanford, WA have been upgraded to increase their sensitivity by an order of magnitude and started to take data in September 2015.
LIGO data is searched for GW signals by using matched filtering technique when GW waveforms of the source can be modeled. Furthermore, if source model is not understood or it is computationally or scientifically challenging to model waveforms, excess energy methods (aka ‘burst method’) are used in the analysis. Coherent WaveBurst (cWB) method kymm2008 has been used to conduct multiple searches in the past burstS52009 ; burstS62012 ; lvc2012 . This method identify GW events by searching for coincidence appearance of excess energy in a network of GW detectors. The cWB parameter space is not constrained, because of its “eyes wide open approach” and allows for the detection of multiple types of signals. Because of that, the cWB method is affected by background noises, which can be suppressed by providing the search an additional discriminating power PRD05 . This can be done by the application of weak model based constraints.
In the presented letter we describe the event selection criteria based on the reconstructed chirp mass (addressed as chirp cut from henceforth) in a burst search for compact binary coalescence (CBC) sources. Reconstructed chirp mass along with two goodness of fit parameters is shown to greatly suppresses the background while keeping the robustness of the search intact. This letter is organized as follows: In Section II we describe the algorithm used for the reconstruction of the chirp mass; in Section III we discuss the application of the algorithm; results are discussed in Section IV and paper is concluded in Section V.
II Algorithm
The frequency evolution of GW from a coalescing binary is given by Equation 1
| (1) |
where is the chirp mass of the binary with component masses and , G is the gravitational constant, and c is the speed of light ca2007 . Integrating Equation 1 with respect to time gives,
| (2) |
where is the constant of integration. Furthermore, on identifying and , the chirp mass can be calculated from the slope of the line fitted through the data points.
In our case, line fitting is performed on a collection of time-frequency (TF) pixels extracted from an excess energy event appearing in the detector network data. The center of the pixels are promoted as the data points by including dimension of the pixels ( and ) as errors in the , defined as:
| (3) |
where , and . The value of measures the quality of the fitted line, which has the slope b and the intercept C. First the line of the best fit is estimated by maximizing the number of data points, which are intersected with the line. If a data point has a value of less than 2, it is counted towards the intersecting points. The value 2 has been hand picked. A larger value will increase the number of intersecting data points as it will also consider distant data points from Gaussian noise and hence may not achieve a good fit. A smaller value may try to fit a line through a region densely packed with data points and may fit line through just the merger stage of the waveform.
Ones the fitting pixel set is defined, the line of the best fit is obtained by minimizing the value and the chirp mass is calculated from the slope b. The in Equation 3 is not normalized, as and are not statistical errors but the uncertainities in time and frequency. Hence, it cannot be used to estimate error in the reconstructed chirp mass. Alternatively, the goodness of fit is assessed by analyzing if an event has a chirp like structure. This is quantified using two parameters, 1) energy fraction (F) = the energy of all pixels intersected by the line divided by the total energy of the event. 2) ellipticity (e) = 1 - , where corresponds to the line orthogonal to the line of best fit. The maximum possible value of both the parameters is 1 and a chirping GW signal is expected to have F and e close to unity. To impose a chirping signal criteria, only events crossing certain thresholds on reconstructed chirp mass, F and e are admitted for further investigation.
III Application of the chirp cut
Chirp cut was tested on the data collected by the LIGO and the Virgo detectors from the S6A-VSR2 run. The excess power events were identified with the coherent waveburst algorithm and background was estimated by performing the time-shift analysis i.e. events were identified after data from two detectors were shifted to remove the possibility of coincident GW signal kymm2008 . The sensitivity of the analysis to simulated CBC waveforms was estimated with Monte Carlo simulations by using waveforms from the EOBNRv2 family with a uniform distribution of chirp mass from 4.35 M⊙ to 21.76 M⊙ lvc2012 . Only events identified with a signal-to-noise ratio (SNR) of 6 or more were considered for further processing.
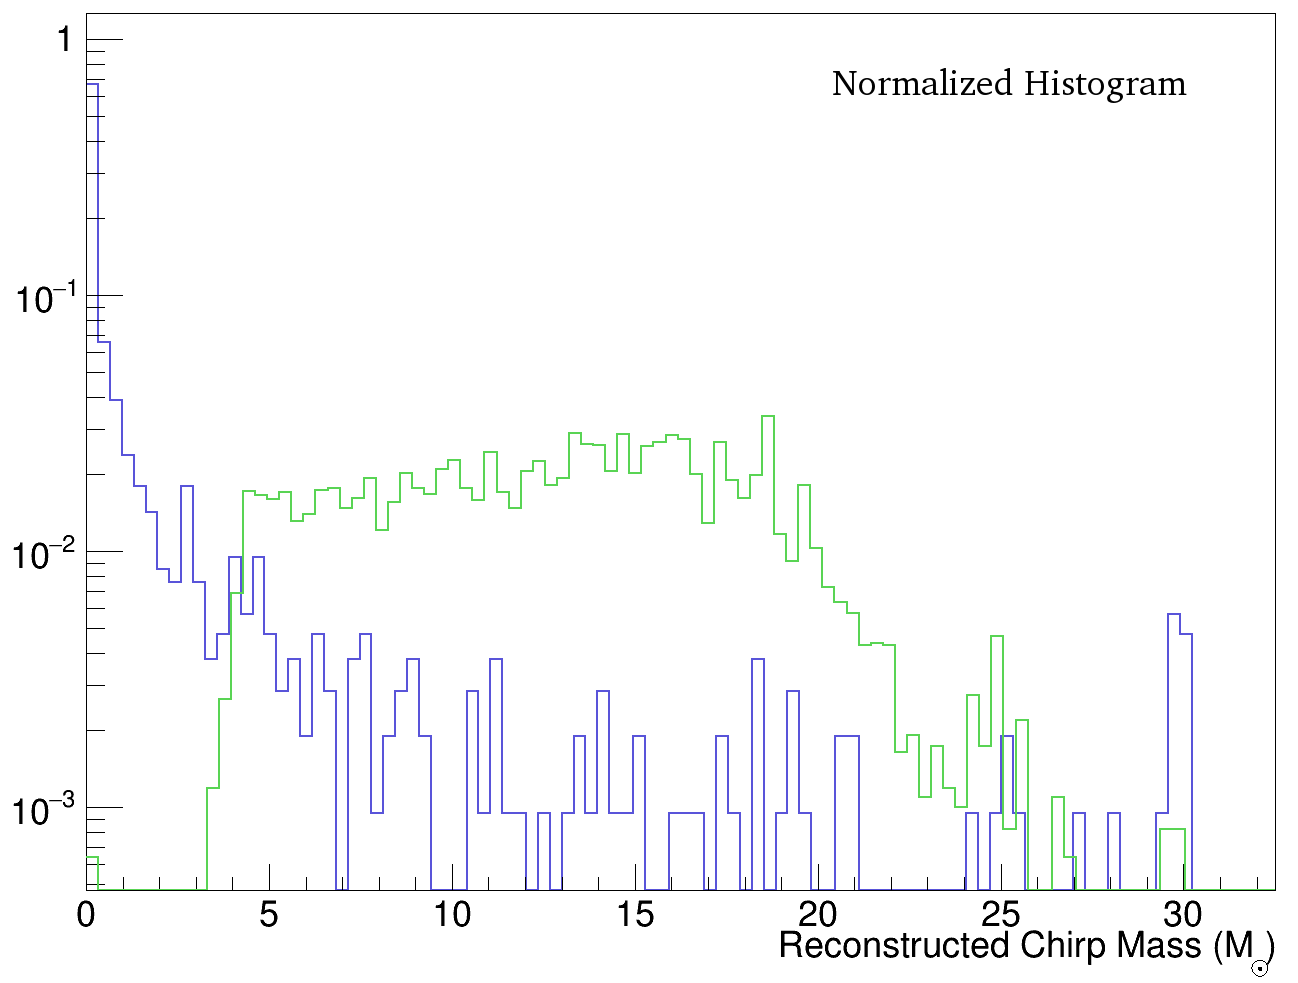
The background events are unlikely to have a chirp structure. In fact for an event with data points randomly distributed on the TF map, the reconstructed chirp mass will be close to zero. Hence, the first cut is applied to the reconstructed chirp mass. Figure 1 plots the distribution of reconstructed chirp mass for simulated signals (injections) and background events. A large fraction of the background events have a reconstructed chirp mass value of less than one solar mass. Setting a threshold of on the reconstructed chirp mass value removes a large fraction of background events while the number of injection removed from this cut is negligible.
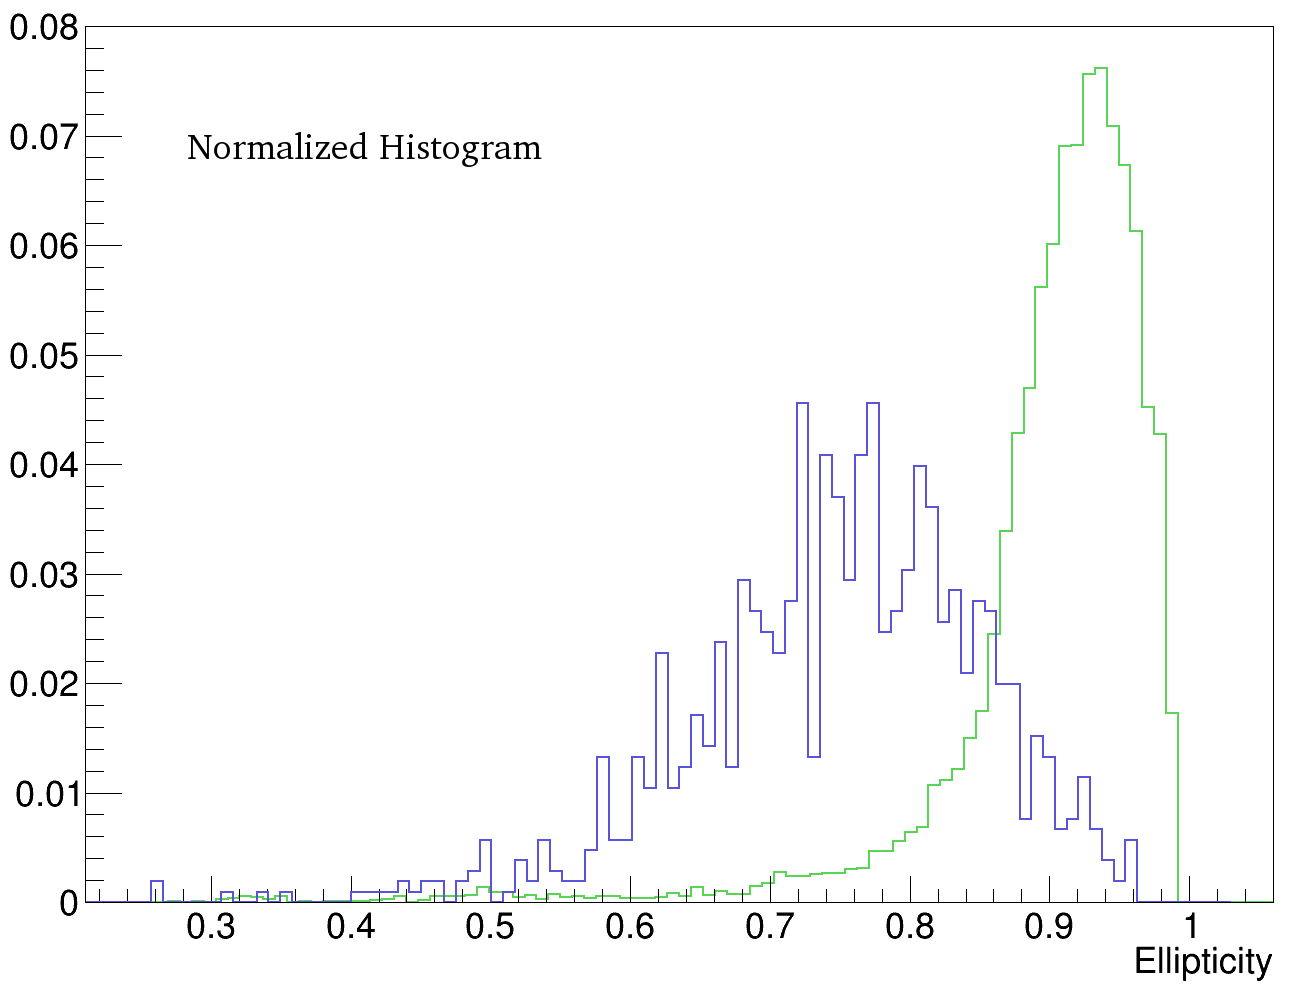
Events comprised of small number of data points may have a large value of reconstructed chirp mass. Such events can be vetoed by using their ellipticity. A chirping signal is expected to have e close to unity, while background events are expected to have value close to 0. Figure 2 plots the distribution of ellipticity for the injections and background events. The ellipticity threshold of has been used to produce the results presented in this letter.
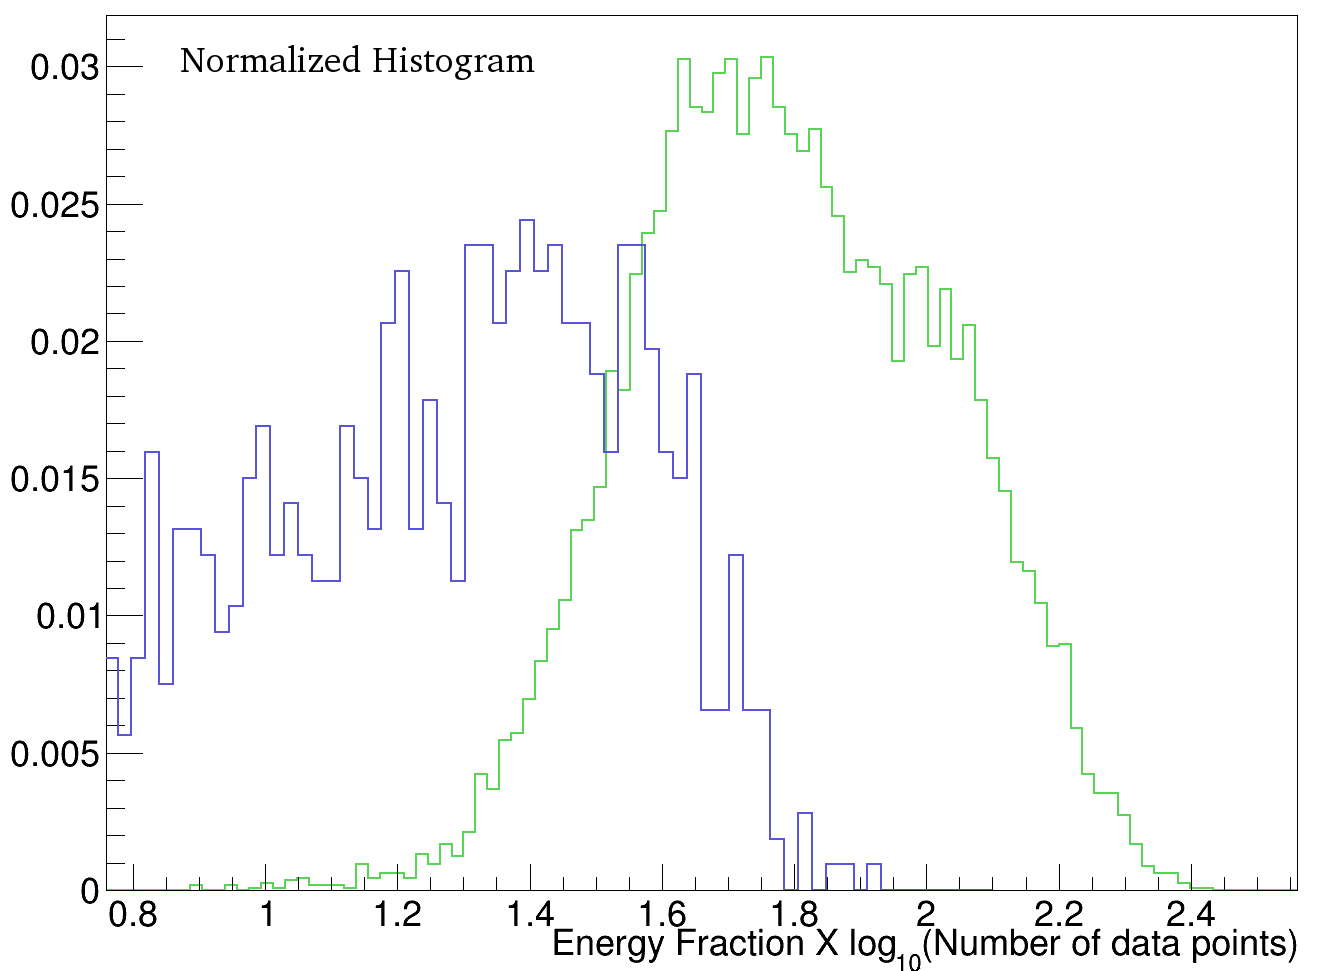
Background events may have a large value of reconstructed chirp mass as well as ellipticity when number of data points in the event are large. Such events can be removed by using their energy fraction value. Events with small number of data points are not penalized by applying the cut on the energy fraction statistics weighted by . Figure 3 plots the distribution of weighted energy fraction for injections and background events. The energy fraction threshold has been used in the results presented in this letter.
IV Results
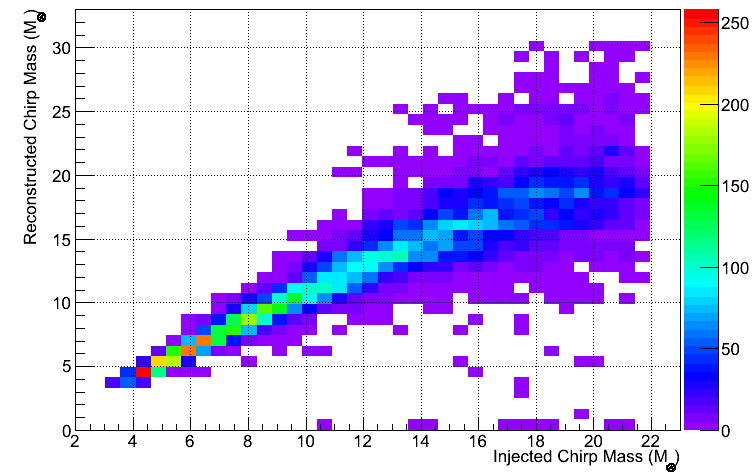
Figure 4 plots the injected vs reconstructed chirp mass of all the recovered events. Reconstructed chirp mass is within a few percent of the injected chirp mass. The curve begins to flatten (20 M⊙ and onwards) for higher values of injected chirp mass primarily because the inspiral stage becomes covered by the seismic noise affecting the detector.
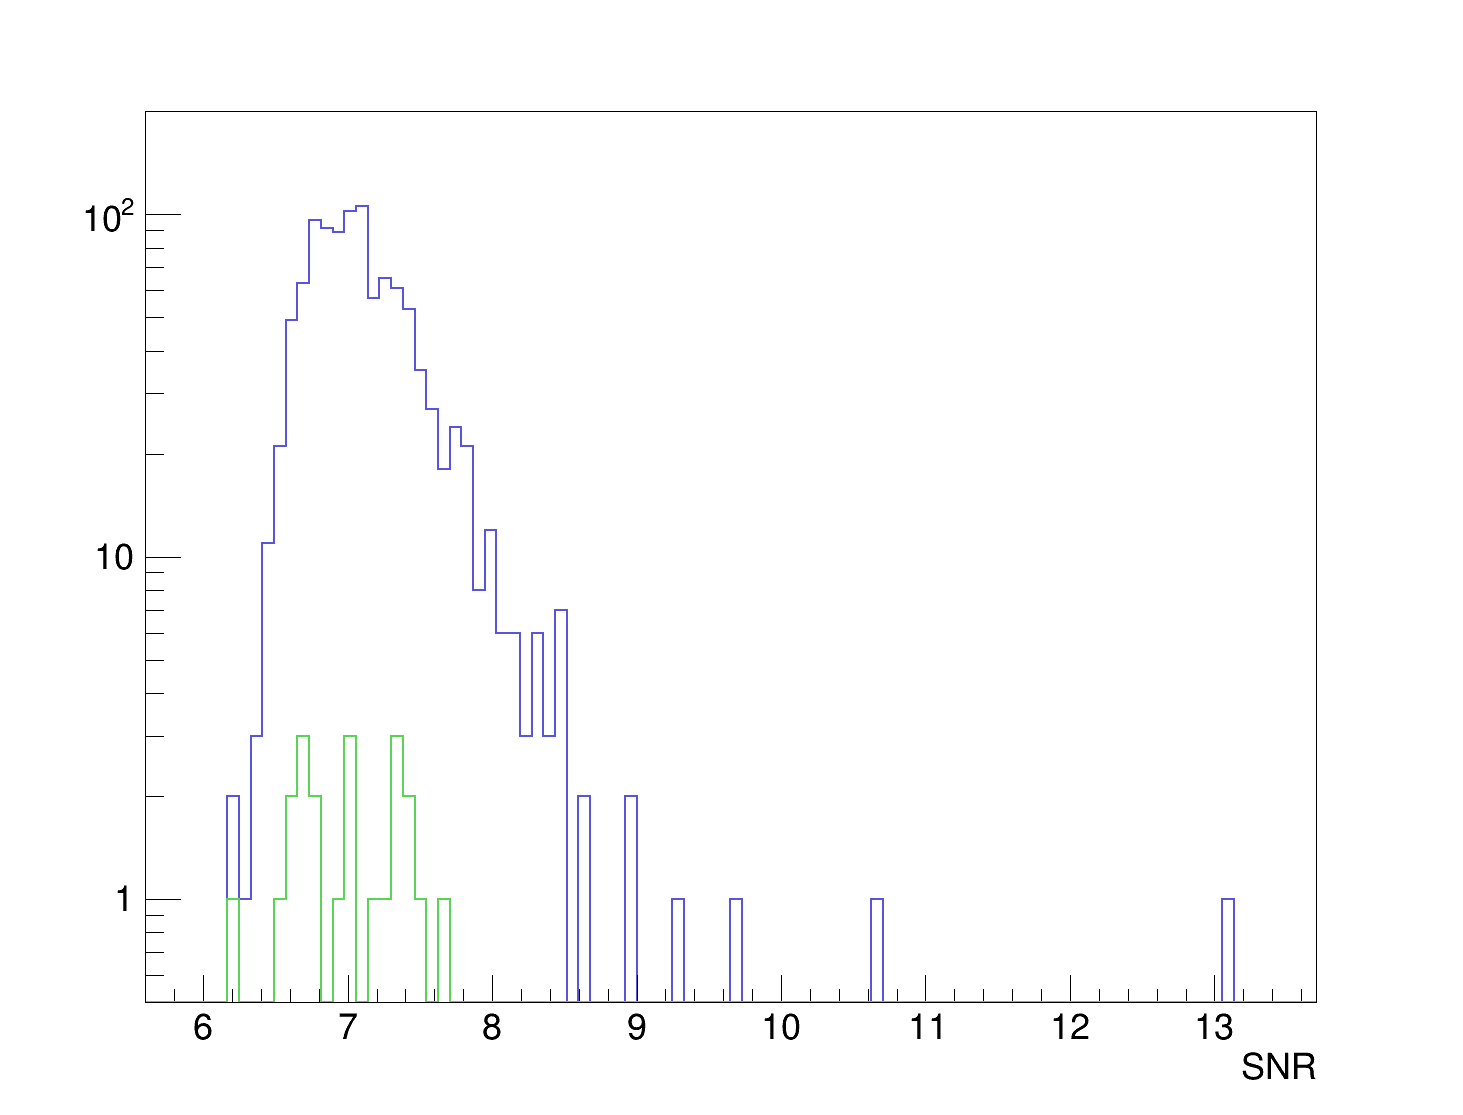
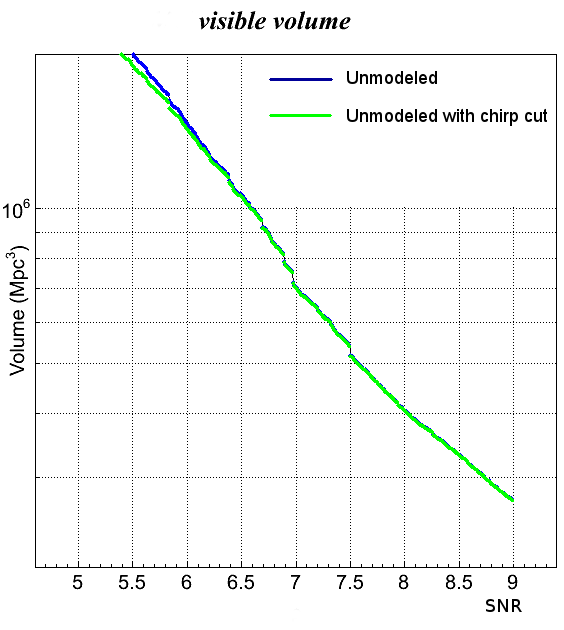
The primary objective of the chirp cut is to reduce the background while not affecting the search sensitivity. This is shown in Histogram 5, which plots the SNR distribution of the background events before and after the application of the chirp cut. There is a significant reduction in the number of background events (approximately two orders of magnitude) and the outliers have also been removed. Moreover, the sensitivity of the search remained mostly unchanged as shown in Figure 6. It plots the visible volume of the search before and after the application of chirp cut. The loss in visible volume is negligible, indicating that most of the recovered injections passed the chirp cut.
V Conclusion
The chirp cut is a powerful tool to reduce background without using the CBC template analysis, which requires knowledge of the exact source model. The algorithm admits only events with chirping TF signature resulting in background reduction by two orders of magnitude. Other than the overall reduction of the background, algorithm also succeeds in removing most of the loud outliers. On the other hand it does not compromise the search sensitivity for the CBC sources, therefore its application will boost the statistical confidence of these sources. So far stellar mass CBC sources have been searched for with the matched filtering methods using simulated waveforms of binaries on circular orbits. However, it has been shown that these methods could be sub-optimal for sources such as eccentric binaries, intermediate mass-ratio coalescence or extreme cases of precessing binariesbz2010 ; sm2013 ; ia2014 , and the burst search can be a viable alternative.
The strength of chirp cut lies in its simple application. Algorithm is not computationally intensive and does not require separate computational infrastructure when implemented in a search. Reconstructed chirp mass, ellipticity and energy fraction can be estimated during an unmodeled all-sky burst search and the chirp cut can be imposed once all the excess energy events have been identified. CBC signals are expected to last multiple seconds for the sensitivity of advanced detectors. We expect chirp cut to be an effective tool in search of GWs from the CBC sources.
VI Acknowledgement
We are thankful to the National Science Foundation for support under grants PHY 1205512 and PHY 1505308. This document has been assigned LIGO Laboratory document number P1500171.
References
References
- (1) B.P. Abbott et al (LIGO Scientific Collaboration), LIGO: the Laser Interferometer Gravitational-Wave Observatory, Rep Prog. Phys. 72 076901/1-25 (2009).
- (2) S. Klimenko, I. Yakushin, A. Mercer, and G. Mitselmakher. Coherent algorithm for detection of gravitational wave bursts, Class. Quant. Grav. 25, 114029 (2008).
- (3) LIGO-Virgo Collaboration, Search for gravitational-wave bursts in the first year of the fifth LIGO science run, Phys. Rev. D 80, 102001, 2009.
- (4) LIGO-Virgo Collaboration, All-sky search for gravitational-wave bursts in the second joint LIGO-Virgo run, Phys. Rev. D 85, 122007, 2012.
- (5) LIGO-Virgo Collaboration, Search for gravitational waves from intermediate mass binary black holes, Phys. Rev. D 85, 102004, 2012.
- (6) S. Klimenko, S. Mohanty, M. Rakhmanov and G. Mitselmakher, Constraint likelihood analysis for a network of gravitational wave detectors, Phys. Rev. D 72, 122002 (2005).
- (7) J.D.E. Creighton and W.G. Anderson, Gravitational-Wave Physics and Astronomy: An Introduction to Theory, Experiment and Data Analysis, Wiley publishing, ISBN-13: 978-3527408863 (2007).
- (8) Yi Pan et al., Inspiral-merger-ringdown multipolar waveforms of nonspinning black-hole binaries using the effective-one-body formalism, Phys. Rev. D 84, 124052 (2011).
- (9) P. Ajith et al., Inspiral-Merger-Ringdown Waveforms for Black-Hole Binaries with Nonprecessing Spins, Phys. Rev. Lett. 106, 241101 (2011).
- (10) W. E. East, S.T. McWilliams, J. Levin, and F. Pretorius, Observing complete gravitational wave signals from dynamical capture binaries, Phys.Rev. D 87, 043004 (2012).
- (11) D.A. Brown and P.J. Zimmerman, The effect of eccentricity on searches for gravitational-waves from coalescing compact binaries in ground-based detectors, Phys. Rev. D 81, 024007 (2010).
- (12) I.W. Harry et at, Investigating the effect of precession on searches for neutron-star–black-hole binaries with Advanced LIGO, Phys. Rev. D 89, 024010 (2014).
- (13) R.J.E. Smith, I. Mandel and A. Vecchio, Studies of waveform requirements for intermediate mass-ratio coalescence searches with advanced gravitational-wave detectors, Phys. Rev. D 88, 044010 (2013).