SF2A 2015
News from the CFHT/ESPaDOnS spectropolarimeter
Abstract
The ESPaDOnS spectropolarimeter has been in use on the Canada-France-Hawaii Telescope (CFHT) since 2004, for studying stars, galactic objects and planets. ESPaDOnS is used in queued service observing mode since 2008, which allows an optimization of the science outcome. In this article, we summarize the new functionalities and analyses made on ESPaDOnS operations and data for the present and future users. These modifications include: signal-to-noise ratio based observing, radial velocity nightly drifts, the OPERA pipeline under development, the measurement of H2O content in the Maunakea sky, and the use of ESPaDOnS with the neighbour telescope Gemini.
keywords:
Observatory, spectrograph, stars1 Introduction
The ESPaDOnS spectropolarimeter is used in three different modes: Star-only (single fiber on the star, highest resolving power, 81000), Star+Sky (68000 resolving power, second fiber observes the sky background), and Polarimetric (68000 resolving power, linear or circular polarisation). With its twin instrument NARVAL at Telescope Bernard Lyot, ESPaDOnS has the unique capability of measuring the magnetic topologies of stars. Recent examples of ESPaDOnS results are given in, e.g., Donati et al. (2015); Shultz et al. (2015); Melendez et al. (2015); Martins et al. (2015); Sabin et al. (2015); Walker et al. (2015). While ESPaDOnS is highly efficient, cover the totality of the visible bandpass (370-1050nm) and benefits from the exquisite conditions at Maunakea 4200m-high Observatory, its performances and global science outcome can still be optimized in a number of ways. In the following, we summarize the directions taken by the observatory staff to improve the consistency, reliability and performance of ESPaDOnS operations. This report is also meant to help present and future users to understand their data better and/or to plan more efficiently their future ESPaDOnS observing campaigns.
2 Signal-to-noise based observations
ESPaDoNS is operated in queued service observing mode since 2008, from Phase 2 information provided by the users: instrumental configuration, exposure time per exposure, sequence strategy, science priorities, finding charts, sky constraints and potentially timing parameters. Then the queue for a given night is built from the entire database of observations, by a queue coordinator who minimizes the telescope motion, the instrumental changes (only two modes out of the three can be used in a given night), and maximizes the science outcome, while trying to accomodate all timing constraints. Backup queues are also prepared with alternate targets. This queue can be executed as such during the night, if the conditions are good and stable; the observer can also pick any observation from the queue, skipping or re-ordering observations as needed . If conditions are bad and/or variable, the remote observer can repeat high priority observations or switch to low priority snapshot programs. However, when conditions are better than median, the stellar signal increases rapidly and it would be possible to fit in more observations and increase the overall quality of the collected data. For this reason, the CFHT observatory aims at offering an operational strategy based on the measured signal-to-noise ratio (SNR) rather than fixed exposure times for ESPaDonS. Note that this mode is already used for some MegaPrime imaging surveys (Cuillandre et al. 2014), allowing an homogeneous depths in a wide field of view. For ESPaDOnS, in addition to adapt exposure times as a function of observing conditions, an SNR-based operation would also allow to homogeneize the quality of the numerous polarimetric sequences (10 to 15 identical observations spread over two weeks).
In order to set up the SNR mode, the observatory needs additional information from the users, namely: 1) the magnitude and effective temperature of the target, 2) the goal SNR per pixel and per intensity spectrum. By using this information, when available, we were able to estimate that 25 to 30% of the exposure time would have been saved, by observing at the requested SNR and not beyond. The science validation of this new mode requires that the users provide the observatory staff with relevant and complete information. One way to verify this in a systematic way is to use the instrument model (exposure time calculator***http://etc.cfht.hawaii.edu/esp/) with adequate ranges of image quality and airmass. The user can now iterate with the different values of exposure time, external constraints and goal SNR, in the Phase 2 web tool, until all information is consistent in the database.
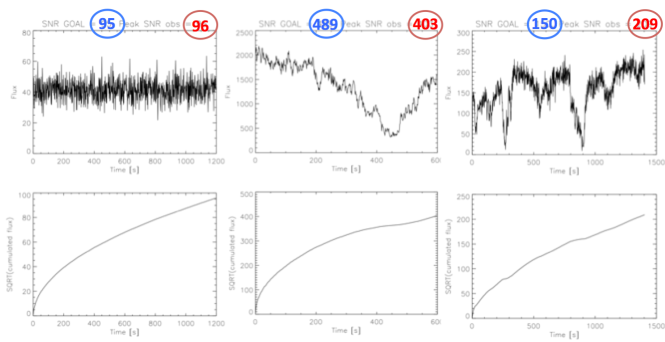
Second, the remote observer needs a realtime estimate of the SNR during the night, or even during the exposure. This is possible with the exposuremeter, a photodiode that collects a small part of the light going through the spectrograph. By comparing exposuremeter counts and final SNR as measured by the pipeline (examples in Figure 1), we were able to calibrate the realtime flux and estimate the realtime behaviour of the SNR. This calibration depends on the instrumental mode and requires adjustements for the spectrograph temperature, which affects the mechanical structure of the optical mounts. The realtime estimate of the SNR is presently (Sept 2015) in testing, for further validation. When deemed a robust estimate, the observer will be able to trigger the anticipated readout of the exposure in the cases where the goal SNR has been reached before the expected end of the exposure. A final complication comes from the fact that the SNR for ESPaDOnS can be defined at several places in the spectrum, which is freely specified by the user, while the calibration of the exposuremeter is done at a specific wavelength (755nm, center of order 30). So it is first necessary to use the exposure time calculator from the database to derive the goal SNR at order 30, from the goal SNR at any wavelength provided by the user. Users are also encouraged to use order 30 as their new reference for goal SNR requests!
With a simultaneous monitoring of the flux count entering the spectrograph, one could also prevent saturated exposures -for program relying on extreme SNR values- but mostly, the gain in exposure time would be beneficial to the whole user community. The SNR operation mode with ESPaDOnS could be made available in 2016A, provided that all tools are validated and robust, and at the discretion of the users. Indeed, some programs may be inadequate for SNR mode observations: time critical sequences, targets of very variable magnitude, moving targets or very faint objects.
3 Radial velocity shifts and precision
ESPaDOnS is not an optimized velocimeter: the spectrograph is not actively controlled in temperature nor pressure, the fiber injection is not scrambled, and there is no possible simultaneous wavelength calibration as in high-precision radial-velocity spectrographs. However, the spectral range and resolution allow to obtain a good precision on the spectrum of Earth atmosphere bands, and to correct at first order for the wide velocity shift that occurs during the night. The wavelength calibration of the spectrograph, done in the afternoon or the morning, results in an error of about 200 m/s. There are ways to reduce this error, by improving the pipeline (see section 5). By observing known exoplanets, previous studies have shown that a residual scatter of 20 m/s remains on the stellar radial velocity measurement, when the Least Square Deconvolution intensity profile is used (Donati & Brown 1997) and when the measurement is corrected for the spectrograph shift as measured on the telluric spectrum (Moutou et al. 2007). On a very short timescale of 1 hour, the scatter is of the order of 10 m/s.
The typical shift during a night is of the order of 200 to 500 m/s, depending on the temperature and pressure evolution. The behaviour of the drift also depends on the range of these parameters, and can be linear or sinusoid-like, or anything in between! In the coming month, this drift evolution will be continuously monitored on ESPaDOnS data, to spot any change of the behaviour due to the recent installation of a second external, passive, thermal enclosure. Although passive, the new enclosure should limit the temperature changes on a given timescale; also, it immediately resulted in a new temperature range (the spectrograph has become warmer), which may affect the mechanical distortions and the residual spectral shifts.
4 Water content above Maunakea
With its spectral coverage of 370-1050nm, the ESPaDOnS spectra contain a wealth of information about the Earth atmosphere features. As the mean telluric band is extracted from the spectra by the pipeline, for the correction of the spectral shift, this profile can also be used for calibrating the water content in the sky at the time of the observation. The equivalent width of the telluric profile () has been correlated to the simultaneous measurement of the water absoption by the Caltech Submm Observatory ontop Maunakea†††http://cso.caltech.edu/tau/. The following equations are used to derive the precipitable water vapor from the ESPaDOnS spectra:
| (1) |
| (2) |
where is the value at the observed and the value at zenith.
Using more than 1 year of data where this measurement is available, we could derive some statistical values, which are useful for specific programs limited by the water content in the spectra and more generally, for the future CFHT/SPIRou programs (where water content will directly affect the radial-velocity precision). During 50% of the time, the PWV in the atmosphere is less than 2.5mm H2O during nights where ESPaDOnS is used, and at the real observed airmasses.
5 OPERA pipeline
The standard pipeline of ESPaDOnS is Libre-Esprit (Donati & Brown 1997). It conducts the pre-processing of the spectra, recognizes the order from flatfield calibration exposures, performs the wavelength calibration, uses optimal extraction to derive the final spectra, calculates polarization from 4 polarimetric sub-exposures, and subtracts the sky spectrum for data taken in the Star+Sky mode. Libre-Esprit, is embedded in the data flow software Upena and used daily to process the ESPaDOnS nights and provide users with final products.
The OPERA pipeline has started development a few years ago to fulfill additional needs from the users: get intermediate products, and use a two-amplifier readout mode of the detector that would reduce the readout overheads by about a factor of two. OPERA is also used for the reduction of GRACES data (see below), for which the processing parameters are different. Fine tuning of OPERA algorithms is still underway but made a lot of progress in the last year (Martioli, Malo et al, in prep.). Both OPERA and Libre-Esprit products will be distributed to users in 2016, in order for the observatory to get feedback before OPERA pipeline eventually becomes the new standard.
Special care has been put into the spectral calibration into OPERA. The selection of Thorium and Neon lines from the atlas and from the observed lamp exposures has been optimized, with the result that the radial-velocity scatter per order is of the order of 50 to 70 m/s. A combination of long and short exposures on the spectral lamp also prevents some of the saturated lines to blur out the neighbour orders. This gain of radial-velocity precision is promising and may open new science capability.
Finally, the 2-amplifier mode is still being tested, but its reduction poses no issue with the OPERA pipeline, although the noise properties are different than in 1-amplifier images and changing along the chip. Science validation is yet needed before this 2-amplifier mode is offered for observations.
6 Meeting the giants: GRACES
GRACES stands for Gemini Remote Access to CFHT ESPaDOnS Spectrograph. It is literally the links between the neighbour 8m telescope located at about 200m from the CFHT dome and the ESPaDOnS spectrograph. A 270m fiber has been deployed that feeds ESPaDOnS when it is not used by CFHT. GRACES has two spectroscopic modes (no polarimetric mode) with resolving powers of 67k and 40k and covers the same spectral range than ESPaDOnS, although the bluest part of the spectrum is less efficient. Lamp calibration and fiber injection are provided by the Gemini North GMOS instrument. First tests and science results obtained with GRACES are described in Chene et al. (2014) and Malo et al (in prep).
As foreseen in the agreement between both observatories, the CFHT community will receive a few nights of observing at Gemini North or South in compensation for the use of ESPaDOnS (with a ratio 3/20). A first call for proposals should appear in 2016B (March 2016).
References
- Chene et al. (2014) Chene, A.-N., Padzer, J., Barrick, G., et al. 2014, in Society of Photo-Optical Instrumentation Engineers (SPIE) Conference Series, Vol. 9151, Society of Photo-Optical Instrumentation Engineers (SPIE) Conference Series, 47
- Cuillandre et al. (2014) Cuillandre, J., Mahoney, B., & Withington, K. 2014, in Astronomical Society of the Pacific Conference Series, Vol. 485, Astronomical Data Analysis Software and Systems XXIII, ed. N. Manset & P. Forshay, 81
- Donati & Brown (1997) Donati, J.-F. & Brown, S. F. 1997, A&A, 326, 1135
- Donati et al. (2015) Donati, J.-F., Hébrard, E., Hussain, G. A. J., et al. 2015, MNRAS, 453, 3706
- Martins et al. (2015) Martins, F., Hervé, A., Bouret, J.-C., et al. 2015, A&A, 575, A34
- Melendez et al. (2015) Melendez, J., Tucci Maia, M., & Ramirez, I. 2015, in Astronomical Society of the Pacific Conference Series, Vol. 496, Astronomical Society of the Pacific Conference Series, ed. S. M. Rucinski, G. Torres, & M. Zejda, 411
- Moutou et al. (2007) Moutou, C., Donati, J.-F., Savalle, R., et al. 2007, A&A, 473, 651
- Sabin et al. (2015) Sabin, L., Wade, G. A., & Lèbre, A. 2015, MNRAS, 446, 1988
- Shultz et al. (2015) Shultz, M., Wade, G. A., Alecian, E., & BinaMIcS Collaboration. 2015, MNRAS, 454, L1
- Walker et al. (2015) Walker, G., Bohlender, D., Maier, J., & Campbell, E. 2015, ArXiv e-prints