Evidence of weak superconductivity at the room-temperature grown LaAlO3/SrTiO3 interface
Abstract
The two-dimensional electron gas at the crystalline LaAlO3/SrTiO3 (c-LAO/STO) interface has sparked large interest due to its exotic properties including an intriguing gate-tunable superconducting phase. While there is growing evidence of pronounced spatial inhomogeneity in the conductivity at STO-based interfaces, the consequences for superconductivity remain largely unknown. We study interfaces based on amorphous LAO top layers grown at room temperature (a-LAO/STO) and demonstrate a superconducting phase similar to c-LAO/STO, however, with a gate-tunable critical temperature of , higher than any previously reported values for c-LAO/STO. The dependence of the superconducting critical current on temperature, magnetic field and backgate-controlled doping is found to be consistently described by a model of a random array of Josephson-coupled superconducting domains.
Understanding the physics of normal/superconductor hybrid systems have been a subject of active research since the original work of Josephson Josephson (1962). Recently, however, driven by theoretical insights Kitaev (2001); Recher et al. (2001) and experimentally enabled by the development of new materials, nanoscale hybrid devices have led to a number of key breakthroughs in quantum transport Doh et al. (2005); Hofstetter et al. (2009); Mourik et al. (2012). Strontium titanate (STO) is a wide-gap insulating perovskite oxide with a strong interdependence of structural, magnetic and electronic properties Fleury et al. (1968); Schooley et al. (1965). Interfacing STO with other complex oxides, such as lanthanum aluminate (LAO), leads to a two dimensional electron gas with remarkable properties such as high mobility Ohtomo and Hwang (2004) and gate-tunable superconductivity Reyren et al. (2007); Caviglia et al. (2008) coexisting with magnetism Bert et al. (2012); Li et al. (2011) and strong spin-orbit coupling Caviglia et al. (2010). This system therefore provides the right conditions for creating exotic quantum states in a new generation of hybrid devices with electrostatic control Fidkowski et al. (2013). In order to exploit this potential, however, a detailed understanding of the nature of the superconducting phase and how it is affected by nearby electrostatic gates is required, and methods are needed for fabricating advanced device geometries.
Recently, the importance of micron scale inhomogeneity for the properties of the two-dimensional electron system in STO-based heterostructures have become evident from direct spatial mapping of the current distribution, the superfluid density, and the electrostatic landscape Bert et al. (2012); Kalisky et al. (2013); Honig et al. (2013). Furthermore, signs of phase-coherent superconductivity in the metallic and insulating states were found Richter et al. (2013); Bucheli et al. (2015); Fillis-Tsirakis et al. (2016) and attributed to tetragonal domain boundaries in STO. The superconducting transition is commonly described as a two-dimensional system using the Berezinskii-Kosterlitz-Thouless (BKT) model Berezinskii (1970); Kosterlitz and Thouless (1973); Reyren et al. (2007); Caviglia et al. (2008), valid for homogeneous or granular superconducting thin films Beasley et al. (1979), however, an alternative model based on percolation of superconducting islands embedded in a metallic background is also found to provide a consistent description Caprara et al. (2013, 2011); Biscaras et al. (2013). So far, the possible consequences of inhomogeneity on the critical current and its dependence on magnetic field, temperature and electrostatic doping have not yet been considered.
The aim of the present paper is twofold. First we introduce interfaces of STO and room-temperature grown amorphous LAO (a-LAO)Liu et al. (2013); Chen et al. (2011); Fuchs et al. (2014) to the family of STO-based heterostructures that exhibit exhibit superconductivity. While the doping mechanism leading to conductivity in a-LAO/STO is dominated by oxygen vacanciesLiu et al. (2013); Chen et al. (2011); Fuchs et al. (2014) different from polar discontinuities in c-LAO/STO, the characteristics of superconductivity are found to be similarReyren et al. (2007); Caviglia et al. (2008). However, we find that a-LAO/STO exhibits a significantly higher than reported for c-LAO/STO and has the added benefit that room temperature growth is compatible with standard semiconductor fabrication processesFuchs et al. (2014). We include a full phase diagram of the critical current dependence on temperature and magnetic field. Secondly, we study and compare the gate-dependence of the superconducting critical current and critical temperature . Both exhibit a dome-like dependence on however, with a clear shift which provide qualitative evidence a superconducting phase best described to as a random array of superconducting domains Caprara et al. (2013) interconnected by metallic weak links or Josephson junctions (JJs) Mehta et al. (2012). Such Josephson junction arrays (JJA) have been shown to undergo a BKT quantum phase transition Berezinskii (1970); Kosterlitz and Thouless (1973); van der Zant et al. (1987), consistent with previous work on c-LAO/STO Reyren et al. (2007); Caviglia et al. (2008). The presence of intrinsic weakly coupled superconducting domains may be a crucial element in the design and study of gate-defined devices at STO-based interfaces Gallagher et al. (2014).
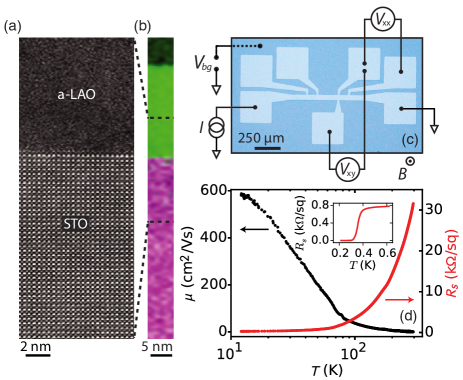
Our samples were grown by room-temperature pulsed laser deposition (PLD) and patterned in a Hall bar geometry (width , length ) using a LaSrMnO3 hard mask following Ref. Trier et al. (2015). The 16 nm LAO top layer is amorphous Chen et al. (2015) as confirmed by the absence of long-range order in the cross-sectional high-angle annular dark-field (HAADF) scanning transmission electron microscopy (STEM) image and corresponding electron energy loss spectroscopy (EELS) scan in Fig. 1(a,b) of an unpatterned reference sample. Figure 1(c) shows an optical image of the final device. The chip was glued to a ceramic chip-carrier using conducting silver paste and the back plane of the chip served as a global electrostatic backgate, tuning the interface carrier density when biased at a voltage .
Initial characterization of the device was done by sourcing a current and measuring the longitudinal and transverse voltages, and while applying an out-of-plane magnetic field (Fig. 1(c)). The temperature dependence of the sheet resistance is shown in Fig. 1(d) confirming the metallic behavior of the sample and the carrier density is found from the measured Hall coefficient . Upon cooling the sample from room temperature, is constant at until from where it linearly decreases to a value of at . The carrier freeze-out below is consistent with previous reports on both amorphous and crystalline LAO/STO samples Huijben et al. (2006); Chen et al. (2011, 2014). The mobility (Fig. 1(d)) increases upon cooling and reaches a value of at low temperature. Subsequently, the sample was measured in a dilution refrigerator with a base temperature of . A transition to the superconducting state is observed at (inset to Fig. 1(d)). Here the critical temperature was defined as the temperature where is 50% of the normal-state resistance at . The transition temperature is comparable to the values ranging from 200 to reported for c-LAO/STO samples Reyren et al. (2007); Caviglia et al. (2008); Bert et al. (2011); Richter et al. (2013).
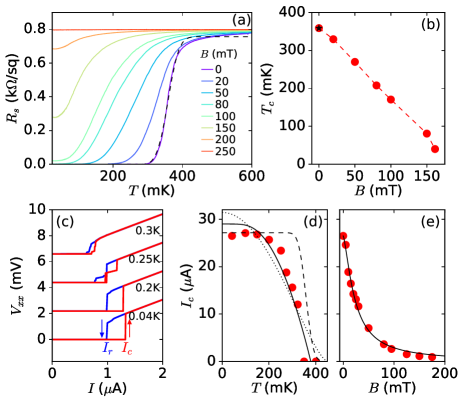
To study the properties of the superconducting phase, was measured at different sweeping the temperature at a slow temperature ramp rate to ensure a stable equilibrium situation. Figure 2(a) shows for different magnetic field and the resulting is shown in Fig. 2(b). Also included in Fig. 2(b) is extracted from fitting the data to the Effective Medium Theory (EMT) of Ref. Caprara et al. (2013) which considers a sample composed of percolating superconducting regions with a Gaussian distribution of transition temperatures with width and average . The fit shown by the dashed line in Fig. 2(a) is in good agreement with the experimental curve111The model does not capture the difference in sharpness of the transition close to and which could be related to a non-symmetric distribution.. The 50% transition point (reached at ) agrees with the found by fitting EMT theory (black symbol in Fig. 2(b)), and extrapolating to gives a measure of the upper critical field . This corresponds to a coherence length of close to the values found for c-LAO/STO Reyren et al. (2007); Ben Shalom et al. (2010). Note that the dependence is expected to go to zero with a vertical tangent Tinkham (1996), which is not observed due to limits of the measurement. Also, the extracted coherence length depends on the definition of and taking the 5% or 95% transition point for results in of and , respectively.
Four-terminal finite bias -characteristics are presented in Fig. 2(c-e). When increasing the bias current (Fig. 2(c), red trace) the device is initially in the superconducting state and , but switches abruptly to a resistive state at the critical current . When reversing the sweep direction (blue trace), the sample returns to the superconducting state at the retrapping current . Such hysteretic behavior can be an effect of Joule heating Tinkham et al. (2003); Courtois et al. (2008), however, since the hysteretic behavior is largely unchanged up to , this seems unlikely. Alternatively, hysteretic -curves are characteristic for an array of Josephson junctions Tinkham (1996); Yu and Stroud (1992) in the underdamped regime. For an individual junction of capacitance and normal state resistance the quality factor is , where is the plasma frequency, and the underdamped regime could naturally appear due to the high dielectric constant of STO providing large junction capacitances. In this scenario the multiple switching events to finite resistive states observed at in Fig. 2(c) is consistent with an array containing junctions with varying critical currents.
The temperature dependence of the critical current density is shown in Fig. 2(d). For , is constant at and drops steeply to zero around . The dotted line represents a fit to the Ginzburg-Landau mean field result which describes the critical current in homogeneous superconducting thin films Skocpol et al. (1974). Here and refer to the low temperature value of the critical field and the penetration depth. This model does not describe the data adequately and moreover, taking values and appropriate for bulk STO Schooley et al. (1965) the model estimates a low field critical current density of . Estimating a superconducting layer thickness of Chen et al. (2011) for our sample this amounts to a density of ie., three orders of magnitude larger than what we measure. The -dependence of the local superfluid density can be obtained from EMT Caprara et al. (2013) and assuming proportionality to the measured critical current results in the dashed line in Fig. 2(d). The deviation from the data is can be attributed to the connectivity of the array not being accounted for in the model. Fitting to the theory for a junction of arbitrary transparency Kulik and Omelyanchuk (1975); Haberkorn et al. (1978) and using the BCS result for the temperature dependence of the gap Richter et al. (2013), we find good agreement with the data for an individual metallic weak link in the dirty limit, with . This fit is shown by the solid line in Fig. 2(d) with , close to the value found from Fig. 2(a). The difference is within the width of the distribution .
The critical current density as a function of magnetic field is shown in Fig. 2(e). At high B-field values the sample does not reach the superconducting state, however, a clear transition to a higher resistive state is still observed at a distinct current . For an individual uniform rectangular JJ, a magnetic field will cause the measured critical current to oscillate and follow the Fraunhofer pattern Tinkham (1996). For a sample composed of a random array of junctions, the oscillations average out and we expect to follow the approximate envelope where depends on the junction geometry van der Laan et al. (2001); Mueller et al. (1991) and the characteristic scale relates to the average junction area . As seen in Fig. 2(e) this simple model shows good overall agreement the data yielding = 1.42 and a junction area of .
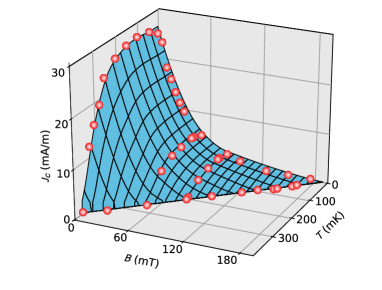
In addition to the measurements presented in Fig. 2 the temperature dependence of the critical current was measured at finite . The resulting superconducting phase diagram of the a-LAO/STO interface is shown in Fig. 3. 222To obtain the 3D surface grid, the data points obtained from the -curves were fitted to theory and smoothed using a Hanning window and connected by interpolation.
A key feature of the superconducting phase in STO-based interfaces is the dome-shaped dependence of the critical temperature on electrostatic doping Caviglia et al. (2008), related to the doping dependence of in bulk STO Schooley et al. (1965); Lin et al. (2014). Figure 4(a) shows for various for the a-LAO/STO heterostructure and Fig. 4(b) shows the corresponding -dome extracted using EMT, which reaches a maximum of at optimal doping. This value is larger than what has previously been reported for LAO/STO-based interfaces and very close to the reported transition temperature of bulk conducting STO at optimal doping Schooley et al. (1965). At the lowest (highest ) the resistance does not fall to zero and cannot be defined for these curves. As seen in Fig. 4(b) the width of the transition decreases monotonically across the dome. At low (high ) the -curves develop multiple steps, which we ascribe to different regions of the sample entering the superconducting state at different temperatures. This is consistent with scanning probe measurementsBert et al. (2012), which report a pronounced spatial inhomogeneity in the diamagnetic screening on the underdoped side of the dome.
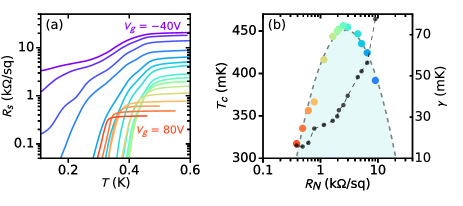
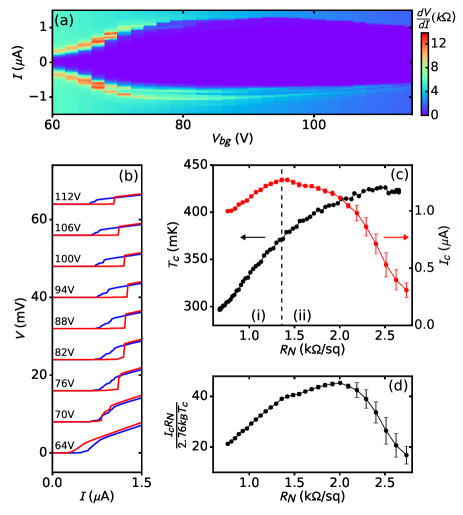
Further insight into the superconducting phase emerges by comparing the backgate dependence of the critical current and critical temperature. Figures 5 (a-b) show the -characteristics at various obtained in a separate cooldown. At each backgate voltage, DC current-biased -curves and were simultaneously measured, from which is extracted. The gate-dependence of the was obtained using a temperature feedback loop keeping at 50% of the normal-state resistance.
Figure 5(c) shows and with respect to to compensate for gate hysteresis. Both and exhibit dome-shaped dependencies on doping, however, the two domes peak at significantly different doping levels. Two regimes can be identified: (for ) and (for ). In regime the device is on the overdoped side of the dome and increases with . The critical current qualitatively follows and both exhibit an increase with with a decreasing rate. At the critical current peaks at and in regime , decreases with while continues to increases until it peaks at .
For a conventional homogeneous thin film superconductor, is described with Ginzburg-Landau theory by and is expected to follow , unlike the experiment. In the alternative scenario of a Josephson-coupled array, as a simplest model, a single Josephson junction in the superconducting percolation path triggers the transition from the superconducting to the resistive state. The low-temperature critical current is in this case with being the electron charge and we assume that depends on electrostatic doping qualitatively similar to . Thus on the overdoped side of the -dome, since tunes both and , the Josephson-array scenario allows for a situation where an increase in is accompanied by a decrease of as observed in regime . Here is progressively suppressed as increases and domains are decoupled, while does not depend on the coupling between domains but rather on the carrier density of the individual domains. Therefore this behavior provides a qualitative distinction between the homogeneous thin-film and Josephson-array scenarios, and shows that the latter describes the a-LAO/STO interface superconductivity. The formation of superconducting weak links is also described as the onset of ’weak superconductivity’ and is related to the formation of a pseudogap, shown to occur in the normal state of LAO/STO and high- superconductors Richter et al. (2013); Talantsev and Tallon (2015). Note that the scaling analysis shown in previous work Caviglia et al. (2008); Caprara et al. (2013); Biscaras et al. (2013) to capture close to the phase transition is also expected to be valid for the transition in a JJA driven by a coupling constantSondhi et al. (1997).
The -curves shown in Fig. 5(b) exhibit an increasing amount of switching events and a decreasing amount of hysteresis with lowering . This behavior is also consistent with a JJA, in the case of a dominating contribution to the -factors from lowering of the mutual capacitance as the superconducting domains are progressively decoupled and the distribution of critical currents is broadened. For an individual JJ, is a constant, and correspondingly for a regular array, is also expected to be constant for a static array. Using the measured , equal to the average of the distribution according to EMT and assuming , Fig. 5(d) shows the extracted as a function of doping which follows a dome-like structure peaked at intermediate between the center values of and . The varying suggests a gate-dependent structure of the array, possibly related to the doping dependence of the spatial variations observed in scanning probe experimentsKalisky et al. (2013); Honig et al. (2013).
In conclusion, we have demonstrated superconductivity in patterned a-LAO/STO and established the superconducting phase diagram. The room-temperature grown top layer enhances the feasibility of conventional micro fabrications techniques for designing gateable mesoscopic superconducting oxide devices. The characteristics of the phase diagram are qualitatively consistent with previous studies of c-LAO/STO samples. We recover the dome-like dependence of the critical temperature on backgate voltage with a peak value of , significantly larger than observed for the c-LAO/STO system and close to the value for bulk conducting STO at optimal doping. From the critical current phase diagram, the observation of multiple resistance steps in the -characteristics and the observation of a pronounced shift between the and domes, we show that the system can be consistently described by a model of an intrinsic Josephson junction array formed by a random network of weakly coupled superconducting domains. The inhomogeneity could be related to inhomogeneous carrier doping by oxygen vacancies or the tetragonal domain boundaries in the STO crystal. The results highlight the important role of inhomogeneity for the properties of superconductivity in STO-based heterostructures.
Acknowledgements.
We thank A. Smith, M. von Soosten, J. Folk, S.L. Folk, K.C. Nowack, N. Scopigno and H. Suominen for useful discussions, S. Upadhyay, N. Payami, C.B. Sørensen and J. Geyti for technical assistance. R. Egoavil and N. Gauquelin, University of Antwerp are acknowledged for HAADF STEM imaging. J. Kleibeuker, G. Koster, and G. Rijnders, MESA+ Institute at the University of Twente are acknowledged for input in the discussion. Work was supported by the Lundbeck Foundation and the Danish Agency for Science, Technology and Innovation. The Center for Quantum Devices is supported by the Danish National Research Foundation.References
- Josephson (1962) B. Josephson, Phys. Lett. 1, 251 (1962).
- Kitaev (2001) A. Y. Kitaev, Phys. -Usp 44, 131 (2001).
- Recher et al. (2001) P. Recher, E. V. Sukhorukov, and D. Loss, Phys. Rev. B 63, 165314 (2001).
- Doh et al. (2005) Y. Doh, J. van dam, A. Roest, E. Bakkers, L. Kouwenhoven, and S. De franceschi, Science 309, 272 (2005).
- Hofstetter et al. (2009) L. Hofstetter, S. Csonka, J. Nygard, and C. Schoenenberger, Nature 461, 960 (2009).
- Mourik et al. (2012) V. Mourik, K. Zuo, S. M. Frolov, S. R. Plissard, E. P. A. M. Bakkers, and L. P. Kouwenhoven, Science 336, 1003 (2012).
- Fleury et al. (1968) P. Fleury, J. Scott, and J. Worlock, Phys. Rev. Lett. 21, 16 (1968).
- Schooley et al. (1965) J. Schooley, W. Hosler, E. Ambler, J. Becker, M. Cohen, and C. Koonce, Phys. Rev. Lett. 14, 305 (1965).
- Ohtomo and Hwang (2004) A. Ohtomo and H. Hwang, Nature 427, 423 (2004).
- Reyren et al. (2007) N. Reyren, S. Thiel, A. D. Caviglia, L. F. Kourkoutis, G. Hammerl, C. Richter, C. W. Schneider, T. Kopp, A.-S. Ruetschi, D. Jaccard, M. Gabay, D. A. Muller, J.-M. Triscone, and J. Mannhart, Science 317, 1196 (2007).
- Caviglia et al. (2008) A. D. Caviglia, S. Gariglio, N. Reyren, D. Jaccard, T. Schneider, M. Gabay, S. Thiel, G. Hammerl, J. Mannhart, and J. M. Triscone, Nature 456, 624 (2008).
- Bert et al. (2012) J. A. Bert, K. C. Nowack, B. Kalisky, H. Noad, J. R. Kirtley, C. Bell, H. K. Sato, M. Hosoda, Y. Hikita, H. Y. Hwang, and K. A. Moler, Phys. Rev. B 86, 060503 (2012).
- Li et al. (2011) L. Li, C.Richter, J. Mannhart, and R. Ashoori, Nature Physics 7, 762 (2011).
- Caviglia et al. (2010) A. D. Caviglia, M. Gabay, S. Gariglio, N. Reyren, C. Cancellieri, and J. M. Triscone, Phys. Rev. Lett. 104, 126803 (2010).
- Fidkowski et al. (2013) L. Fidkowski, H.-C. Jiang, R. M. Lutchyn, and C. Nayak, Phys. Rev. B 87, 014436 (2013).
- Kalisky et al. (2013) B. Kalisky, E. M. Spanton, H. Noad, J. R. Kirtley, K. C. Nowack, C. Bell, H. K. Sato, M. Hosoda, Y. Xie, Y. Hikita, C. Woltmann, G. Pfanzelt, R. Jany, C. Richter, H. Y. Hwang, J. Mannhart, and K. A. Moler, Nat. Mater. 12, 1091 (2013).
- Honig et al. (2013) M. Honig, J. Sulpizio, J.Drori, A. Joshua, E. Zeldov, and S. Ilani, Nat. Mat. 12, 1112 (2013).
- Richter et al. (2013) C. Richter, H. Boschker, W. Dietsche, E. Fillis-Tsirakis, R. Jany, F. Loder, L. F. Kourkoutis, D. A. Muller, J. R. Kirtley, C. W. Schneider, and J. Mannhart, Nature 502, 528 (2013).
- Bucheli et al. (2015) D. Bucheli, S. Caprara, and M. Grilli, IOP Supercond. Sci. Technol. 28, 045004 (2015).
- Fillis-Tsirakis et al. (2016) E. Fillis-Tsirakis, C. Richter, J. Mannhart, and H. Boschker, New Journal of Physics 18 (2016).
- Berezinskii (1970) V. Berezinskii, Zh. Eksp. Teor. Fiz. 59, 907 (1970).
- Kosterlitz and Thouless (1973) J. Kosterlitz and D. Thouless, J. Phys. C 6, 1181 (1973).
- Beasley et al. (1979) M. R. Beasley, J. E. Mooij, and T. P. Orlando, Phys. Rev. Lett. 42, 1165 (1979).
- Caprara et al. (2013) S. Caprara, J. Biscaras, N. Bergeal, D. Bucheli, S. Hurand, C. Feuillet-Palma, A. Rastogi, R. C. Budhani, J. Lesueur, and M. Grilli, Phys. Rev. B 88, 020504 (2013).
- Caprara et al. (2011) S. Caprara, M. Grilli, L. Benfatto, and C. Castellani, Physical Review B 84, 014514 (2011).
- Biscaras et al. (2013) J. Biscaras, N. Bergeal, S. Hurand, C. Feuillet-Palma, A. Rastogi, R. C. Budhani, M. Grilli, S. Caprara, and J. Lesueur, Nat. Mater. 12, 542 (2013).
- Liu et al. (2013) Z. Q. Liu, C. J. Li, W. M. Lu, X. H. Huang, Z. Huang, S. W. Zeng, X. P. Qiu, L. S. Huang, A. Annadi, J. S. Chen, J. M. D. Coey, T. Venkatesan, and Ariando, Phys. Rev. X 3, 021010 (2013).
- Chen et al. (2011) Y. Chen, N. Pryds, J. E. Kleibeuker, G. Koster, J. Sun, E. Stamate, B. Shen, G. Rijnders, and S. Linderoth, Nano Lett. 11, 3774 (2011).
- Fuchs et al. (2014) D. Fuchs, R. Schafer, A. Sleem, R. Schneider, R. Thelen, and H. von Lohneysen, Applied Physics Letters 105 (2014).
- Mehta et al. (2012) M. Mehta, D. Dikin, C. Bark, S. Ryu, C. Folkman, C. Eom, and V. Chandrasekhar, Nat. Commun. 3, 955 (2012).
- van der Zant et al. (1987) H. S. J. van der Zant, B. J. van Wees, C. J. Muller, H. A. Rijken, and J. E. Mooij, Japanese Journal of Applied Physics 26, S3 (1987).
- Gallagher et al. (2014) P. Gallagher, M. Lee, J. Williams, and D. Goldhaber-Gordon, Nature Physics 10, 748 (2014).
- Trier et al. (2015) F. Trier, G. E. D. K. Prawiroatmodjo, M. von Soosten, D. Christensen, T. S. Jespersen, Y. Chen, and N. Pryds, Applied Physics Letters 107, 191604 (2015).
- Chen et al. (2015) Y. Z. Chen, F. Trier, T. Wijnands, R. J. Green, N. Gauquelin, R. Egoavil, D. Christensen, G. Koster, M. Huijben, N. Bovet, S. Macke, F. He, R. Sutarto, N. H. Andersen, J. Sulpizio, M. Honig, G. E. D. K. Prawiroatmodjo, T. S. Jespersen, S. Linderoth, S. Ilani, J. Verbeeck, G. Van Tenderloo, G. Rijnders, G. A. Sawatzky, and N. Pryds, Nat. Mater. 14, 801 (2015).
- Huijben et al. (2006) M. Huijben, G. Rijnders, D. Blank, S. Bals, S. Van aert, J. Verbeeck, G. Van tendeloo, A. Brinkman, and H. Hilgenkamp, Nat. Mater. 5, 556 (2006).
- Chen et al. (2014) Y. Z. Chen, N. Bovet, T. Kasama, W. W. Gao, S. Yazdi, C. Ma, N. Pryds, and S. Linderoth, Adv. Mater. 26, 1462 (2014).
- Bert et al. (2011) J. A. Bert, B. Kalisky, C. Bell, M. Kim, Y. Hikita, H. Y. Hwang, and K. A. Moler, Nature Physics 7, 767 (2011).
- Note (1) The model does not capture the difference in sharpness of the transition close to and which could be related to a non-symmetric distribution.
- Ben Shalom et al. (2010) M. Ben Shalom, M. Sachs, D. Rakhmilevitch, A. Palevski, and Y. Dagan, Physical Review Letters 104, 126802 (2010).
- Tinkham (1996) M. Tinkham, Introduction to Superconductivity (McGraw-Hill Inc., 1996).
- Tinkham et al. (2003) M. Tinkham, J. U. Free, C. N. Lau, and N. Markovic, Physical Review B 68, 134515 (2003).
- Courtois et al. (2008) H. Courtois, M. Meschke, J. T. Peltonen, and J. P. Pekola, PRL 101, 067002 (2008).
- Yu and Stroud (1992) W. Yu and D. Stroud, Physical Review B 46, 14005 (1992).
- Skocpol et al. (1974) W. Skocpol, M. Beasley, and M. Tinkham, J. Appl. Phys. 45, 4054 (1974).
- Kulik and Omelyanchuk (1975) I. O. Kulik and A. O. Omelyanchuk, JETP Letters 21, 96 (1975).
- Haberkorn et al. (1978) W. Haberkorn, H. Knauer, and J. Richter, Physica Status Solidi A 47, 161 (1978).
- van der Laan et al. (2001) D. van der Laan, H. van Eck, B. ten Haken, J. Schwartz, and H. ten Kate, IEEE Transactions on applied superconductivity 11 (2001).
- Mueller et al. (1991) K. Mueller, D. Matthews, and R. Driver, Physica C 191, 339 (1991).
- Note (2) To obtain the 3D surface grid, the data points obtained from the -curves were fitted to theory and smoothed using a Hanning window and connected by interpolation.
- Lin et al. (2014) X. Lin, G. Bridoux, A. Gourgout, G. Seyfarth, S. Kramer, M. Nardone, B. Fauque, and K. Behnia, Phys. Rev. Lett. 112, 207002 (2014).
- Talantsev and Tallon (2015) E. Talantsev and J. Tallon, Nature Communications 6, 7820 (2015).
- Sondhi et al. (1997) S. Sondhi, S. M. Girvin, J. P. Carini, and D. Shahar, Rev. Mod. Phys. 69 (1997).