Describing the response of saturated SiPMs
Abstract
We have developed a function which describes SiPM response in both small signal and highly saturated regimes. The function includes the reactivation of SiPM pixels during a single input light pulse, and results in an approximately linear increase of SiPM response in the highly saturated regime, as observed in real SiPMs. This article shows that the function can accurately describe the measured response of real SiPM devices over a wide range of signal intensities.
1 Introduction
Pixelated photon detectors (PPD, also known as SiPM, MPPC) [1, 2, 3, 4] are becoming widely used in many fields which require compact photon detectors. These devices achieve a gain of with a bias voltage less than 100 V, and are insensitive to magnetic fields. One complication is their intrinsically non-linear response, particularly at high input light levels, which can be described to first order by
| (1) |
in which is the number of fired pixels, is the total number of pixels in the SiPM, is the number of photons that arrive at the sensor, and is the single photon detection efficiency. This form – Leading Order (LO) – assumes that the charge produced in a pixel is the same if it is hit by one, two, or more photons.
However, when the recovery time of the SiPM pixels is shorter than the input light pulse (e.g. Hamamatsu 25m pitch MPPCs can have a pixel recovery time 4 ns.) a single pixel can contribute more than once to the output signal [6]. H. T. van Dam et al. [7] have developed a model in which they implemented this pixel recovery as well as fluctuations of gain by charge release at pixels, dark noise, crosstalk, and after pulse. Dark noise is induced by thermal excitation, and the mechanisms of crosstalk and after pulse are explained in section 3.4. The model agrees within a few percent with the properties of SiPMs coupled to mm3 LaBr3:5%Ce. In their experiments, the maximum number of fired pixels was 5 times of the number of real pixels. Their model is therefore rather complete. Their model is however mathematically rather complex, which limits its applicability to the task of calibrating and unfolding the response of SiPMs in a real experiment.
Instead, in Equation 1 can be replaced by a fitting parameter, , leading to what we call the LO′ description:
| (2) |
This form has been used in e.g. [8], using experimentally determined values of . It does not, however, describe the linear increase in SiPM signal often seen at high light levels [9]. In this paper we develop a function which can describe the SiPM response over its entire range, from small to highly over-saturated signals, using a function simple enough to use in SiPM calibrations.
2 Experiment
The responses of 72 1600-pixel MPPCs (with a pixel pitch of 25 25 m2)333 Model MPPC-11-025M 5887 provided in 2008 by Hamamatsu K.K. [5] , corresponding to S10362-11-25P were measured. Each MPPC was attached to the end of a 1 mm diameter wavelength shifting (WLS) fiber (Y-11444Kuraray Co. Ltd. [10]), which was inserted into a 3 10 45 mm3 scintillator strip. Figure 1 shows the setup of the measurement. The scintillator strip enveloped in reflecting film, the WLS fiber, and the MPPC were developed for the CALICE scintillator strip electromagnetic calorimeter for an International Linear Collider experiment [8, 11]. The scintillator strips were obtained by cutting 45 mm lengths from long 3 10 mm2 cross-section scintillator bars. The scintillator bars were produced by extrusion with a central hole to house the WLS fiber [12]. The WLS fiber has a 10 ns decay time [13]. Therefore, this system emphasizes the effect of multiple hits on a pixel. To demonstrate the effect of the length of the light pulse, a scintillator strip without WLS fiber or hole was also tested.
A 408 nm laser555PiL040X (Head) + EIG2000DX (Controller) provided by Advanced Laser Diode System A.L.S. GmbH pulse with a FWHM duration of 31 ps was used to illuminate the scintillator strip via a 2.5 mm diameter hole in the reflector film. Crossed polaroid films were used to control the laser intensity, and a half mirror was used to independently monitor the light intensity.
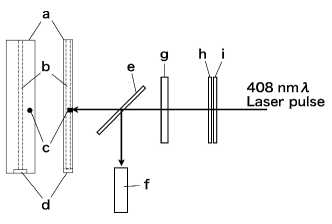
A bias voltage 3 V above the breakdown voltage was applied to the MPPCs. The voltage of the output pulses from the MPPC was integrated over 150 ns using a charge-sensitive analog-to-digital converter (ADC)666Charge sensitive ADC, C009 provided by Hoshin electronics Co. Ltd., synchronized with a signal from the laser pulser. This charge measurement was then converted into the number of fired MPPC pixels by means of the previously estimated single pixel charge.
To measure the single pixel charge, output signals were amplified777Amplifier-shaper-discriminator (ASD) IC and 16-ch ASD board for the ATLAS experiment [14] . The factor to convert the amplified ADC counts to the un-amplified ADC was determined as the ratio of mean ADC counts at a certain laser light intensity, which was measured both with and without the amplifier. Measurements were made at temperatures between 22∘C and 24∘C, and temperature-dependent effects on the gain of SiPM were corrected by using the previously measured linear relation between gain and temperature.
The intensity of laser light was simultaneously measured using a photo-multiplier tube (PMT) 888H1941-01c provided by Hamamatsu K.K. whose response in the range of this experiment was confirmed to be linear. The integrated charge of the PMT pulse was measured using the same charge-sensitive ADC used to measure MPPC signals. The ratio between the ADC counts of the PMT and the number of photons incident on the MPPC is combined with the photon detection efficiency in the parameter .
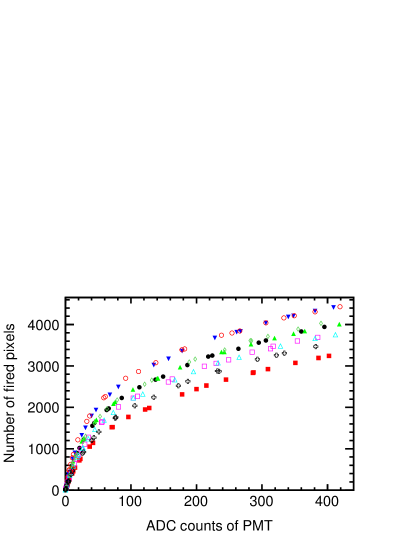
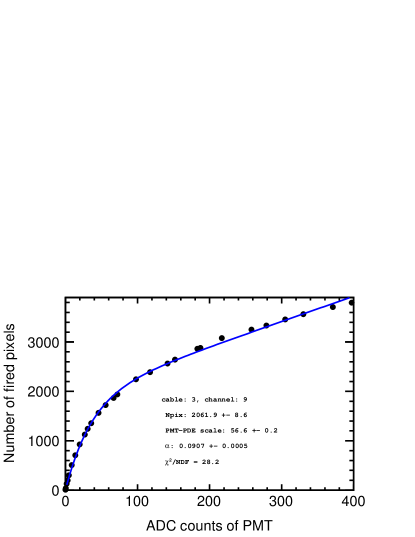
Figure 2 shows the responses of a typical group of nine MPPCs as functions of the PMT signal.
3 Developing the models and fitting to data
3.1 Fitting with the LO′
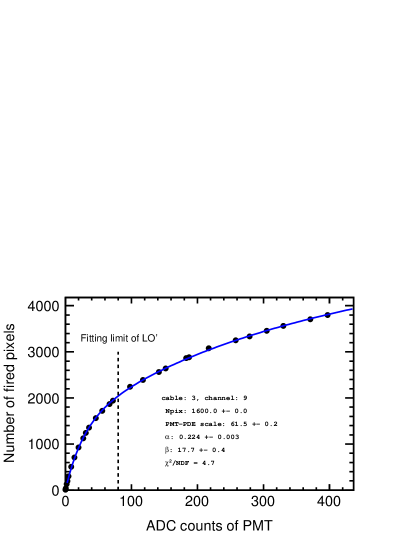
To represent the MPPC response shown in Fig. 2 with Equation 2, LO′, it is necessary to limit the range of the fitting. Otherwise, the deterioration of fitting produces a meaningless result. Figure 3 left shows an example of fitting result with Equation 2, LO′ in a limited range; the inflection point of differential of the difference ( in a logarithmic scale with respect to the ADC counts of the PMT determines the upper limit of the fitting range. Figure 3 right shows such a plot showing a kink of the linear behavior around 80 ADC counts.

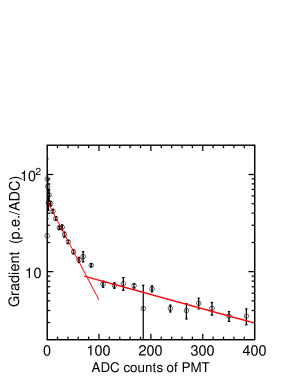
The average of of 72 MPPCs is 2428 with a standard deviation of 245. This large indicates the reactivation of the pixels. Although constant correction for the reactivation phenomenon such as works in the limited range shown in Fig. 3, rather linear like behavior is apparent after saturation.
3.2 Next to leading order
Figure 4 shows the LO SiPM response (according to Equation 1) as a function of the number of input photons, and a line representing unsaturated response.
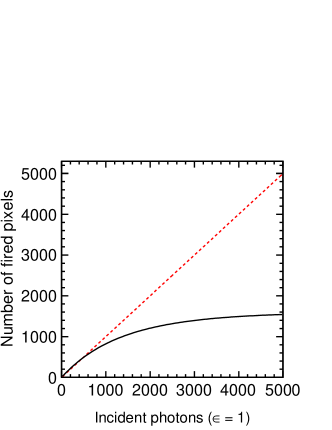
.
The photons which do not fire a pixel at LO i.e. the number of which corresponds to the distance between the curve and line, can in principle contribute to multiple pixel hits with some probability.
Therefore, the number of remaining photons which could cause a multiple hit becomes
| (3) |
With a ratio of the average signal produced by each of these photons, (this factor takes into account effects due to e.g. different quantum efficiency and signal charge for later hits), the total signal at next-to-leading order (NLO) becomes
| (4) |
Although a NLO represents the larger number of fired pixels than in the highly saturated regime, it does not represent the weak concave behavior in this regime, and the fitting results of the number of pixels is times larger than 1600 pixels. Therefore, we add additional corrections to NLO in the successive subsection.
3.3 Charge contribution of a photon as a function of the number of photons on a pixel
The charge contribution of one photon decreases as the number of photons on a pixel increases, because the allowed time for recovery for each photon decreases. The following explains more quantitatively that the charge contribution of one photon is a function of the ratio of the number of incident photons, , to LO, and we use this relation to correct NLO.
D. Jeans developed a model for the SiPM response from a first principle method [15]. The model considers that the charge produced by an avalanche induced within a SiPM pixel depends on the recharge time from preceding avalanche. It assumes that;
-
•
the recovery time is exponential with a decay time, , where the is the quenching resistance and is the capacitance of the pixel, and
-
•
the pulse shape coming into SiPM from the WLS fiber or scintillator also exponentially decays with .
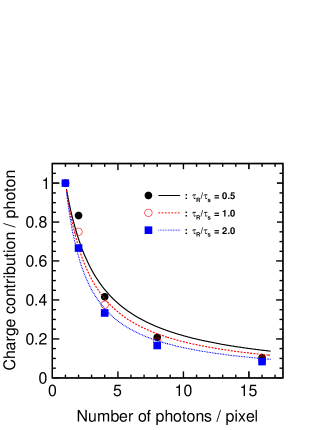
According to Equation (2.9) of [15] the average charge by single photon is the following:
| (5) |
where is the number of photons come on a single pixel, is the charge produced by a fully-charged pixel, and the sum only enters if .
| (6) |
to the calculated points using Equation 5, where is a fitting parameter. This simple Equation 6 approximately represents Equation 5.
The average is the total incident photons divided by the net number of fired pixels of this SiPM, i.e. LO. Therefore, the estimated fired pixels corrected for the effect of becomes the following:
| (7) |
Figure 7 shows an example of fitting with Equation 7 (NLO′). The discrepancy at high light regime in Fig. 5 has disappeared. The dashed vertical line is the fitting limit for LO′ showing that the applicable range is more than five times larger. Two new parameters, and , are introduced in Equation 7. On the other hand the number of pixels, is fixed to 1600 pixels. Therefore, only one increase of the number of parameters improves the fitting performance. Even if the fitting parameter becomes free, the results of is consistent with the true number of pixels.
3.4 Crosstalk and after pulse
Other considerable influences on the SiPM response are crosstalk and after pulse. Crosstalk occurs when a photon, created by the primary avalanche, subsequently induces a second avalanche in a neighboring pixel [4]. An after pulse occurs when a second avalanche is seeded by the release of an electron trapped in a lattice defect of the depletion zone, or a hole defuses toward the depleted layer and, consequently, induces a second avalanche. The hole is created by a photon in the same mechanism as the crosstalk, and this diffusion delays the after pulses because the electric field of the bulk is weak [16]. The resulting increase in the average number of fired pixels approximately becomes as
| (8) |
where represent the probability of crosstalk and represent the probability of after pulse per fired pixel. In this model, the crosstalk is proportional to the fired pixels, NLO′ and the ratio of unfired pixels to the total number of SiPM pixels, , because this immediate avalanche can only occurs on an unfired pixel. The effect of after pulses is simply increasing the number of fired pixels in the first order.
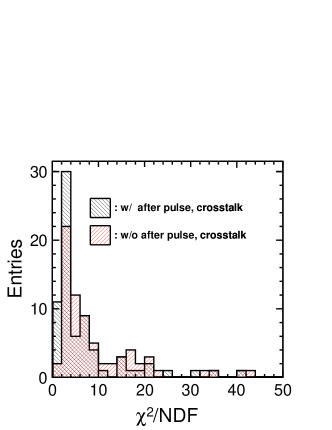
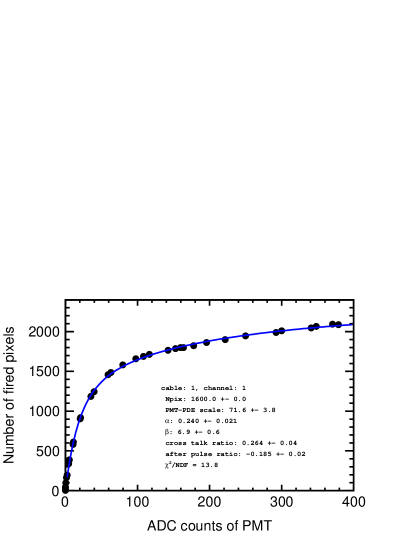
Figure 8 shows the distributions of reduced of fitting results with (NLO) and NLO′. The number of pixels is fixed to 1600 for both cases. Two corrections for crosstalk and after pulse improve the fitting. The mean of crosstalk probability is and the mean of after pulse ratio is . The direct measurement of the crosstalk probability–{(dark counts 2 p.e.) / (dark counts 1 p.e.)}–with a 3 V over voltage has given (RMS) for our MPPCs. The after pulse probability of the same type of MPPCs was measured as 10% with a 3 V over voltage [17].
3.5 Applying to fast light pluse
Figure 9 shows a fitting result of NLO to the response of MPPC coupled to a no-WLS fiber scintillator strip. The fitting result indicates that NLO is applicable to the response of MPPC-scintillator module having larger than via the WLS fiber, i.e. long light pulse. The reduced , 14, is in the range of 72 samples with WLS fiber. The obtained parameter is larger than our expected value, 0.1, and is negative, those are still in one sigma of 72 data. The following section includes discussion of those fitting parameters.
4 Discussion
The finally obtained function, NLO, has seven fitting parameters, some of which can be fixed and still give reasonable fittings. Fixing to 1600 pixels provides reasonable fitting results as already mentioned in section 3.3, and obtained value of freed agrees with 1600 pixels, whereas Equation 4, NLO, still requires larger , 2208 257 (RMS). These facts indicate that the simple relation between and LO succeeds to represent the charge contribution of one photon via the number of photons in a single pixel.
The parameter includes the photon detection efficiency and the scale factor of PMT sensitivity to one photon. The variation of in 72 samples is 25% of mean value 57.2 with free crosstalk and after pulse and with fixed to 1600 pixels.
The recovery ratio, is (RMS), and which moderates the influence of is (RMS) for 72 samples with . These two parameters have the largest impact to determine the behavior of response in the high light regime. Alpha varies to and varies to for a MPPC-scintillator direct coupling sample. The directions of both changes agree with the difference of pulse decay time; 12 ns [13] for the WLS fiber Y11 [13] and 2.5 ns for SCSN38999pulse shape from SCSN38 corresponds to SCSN61 in their catalogue [10], because large , i.e. without WLS fiber decreases the chance of recovery and increases the effect of . We however need to investigate more various types of SiPM and SiPM-scintillator combinations to extract precise relations between those parameters and .
The mean of the parameter, for 72 samples is rather larger than our direct measurement of crosstalk, 0.11 0.02. The value can be easily affected by other relations than crosstalk and after pulse, because the parameter affects weakly on the behavior of the function in plots. The after pulse ratio, , fluctuates more, because it includes not only the after pulse effect but also the fluctuation of scale factor of vertical axis, i.e. the number of measured fired pixels. Actually, RMS is 0.17 for the mean value 0.08, and 29% of 72 samples have a negative value of which is never allowed for the real after pulse ratio. The fitting result, for the MPPC direct coupling sample shown in section 3.5 is also considered as such a case. Those fluctuations of parameters imply the existence of some systematic uncertainties. We can expect that adding such uncertainties decreases the reduced of this study close to unity, because the only statistical uncertainties of the measured number of fired pixels and the ADC counts of PMT were currently implemented on each data for the fitting.
5 Conclusion
We have developed functions to represent SiPM response in a wide range considering pixel recovery. In the case of NLO′, the addition of a single fitting parameter with respect to LO′ increases the applicable range of the fitting function by more than a factor five. These functions are an approximation of the more complete model of H. T. van Dam et al. [7]. Therefore, the parameters are influenced by not only the original physical meanings of parameters but also by some distortions due to the approximations. Actually, we have seen that the crosstalk and after pulse probabilities have large fluctuations in NLO, whereas their impacts on the shape of the function are small. Nevertheless, the functions NLO′ and NLO are valuable for practical uses such as detector calibrations for experiments, because they keep simultaneously both performance and simplicity.
Acknowledgments
The authors would like to thank the CALICE collaboration. In particular, the CALICE-ASIA group provided a layer of the prototype of scintillator electromagnetic calorimeter. In the group Daniel Jeans and Satoru Uozumi have contributed to crucial important discussions. The authors extend special appreciation to Toru Iijima of Nagoya University, who allowed us to use the laser device. This work is supported in part by a Grant-in-aid for Specially Promoted Research: a Global Research and Development Program of a State-of-the-Art Detector System for the ILC’ of the Japan Society for the Promotion of Science (JSPS, Grant No. 23000002).
References
- [1] P. P. Antich et al , NIM, A389, 491 (1997).
- [2] G. Bondarenko et al., NIM, A442, p.187-192 (2000),
- [3] K. Yamamoto et al., IEEE-NSS Conference Record 2007, Honolulu, 2089, (N41-2).
- [4] S. Gomi. et al., NIM, A581, 427 (2007).
- [5] Hamamatsu Photonics KK, http://jp.hamamatsu.com/en/index.html.
- [6] H. Oide, et al., Proceedings of Photon Det 2007, Kobe, PoS(PD07), 008, (2007).
- [7] H. T. van Dam, et al., Nuclear Science, IEEE Transactions on, 57, 4, 2254 (2010).
- [8] K. Francis et al., NIM, A763, 278 (2014).
- [9] L. Gruber, S. E. Brunner, J. Marton, and K. Suzuki, arXiv:1304.2493, physics.ins-det (2013).
- [10] Kuraray Co. Ltd., http://kuraraypsf.jp/pdf/all.pdf.
- [11] K. Kotera, Proceedings of LCWS2011, Granada. arXiv:1201.6098 (2012).
- [12] Sung Hyun Chang et al., JKPS, Vol.53, No. 6, 3178 (2008).
- [13] O. Mineev, et al., arXiv:1110.2651 (2011).
- [14] O. Sasaki, et al., Proceedings of 5th Workshop on Electronics for the LHC Experiments, LEB 99 (1999).
- [15] D. Jeans, arXiv:1511.06528, physics.ins-det (2015).
- [16] F. Fetière and K. Boon, Proceedings of International Workshop on New Photon-detectors, Orsay, PoS(PhotoDet 2012), 003, (2012).
- [17] P. Eckert, et al., NIM, A620, 217 (2010).