Search for two-neutrino double electron capture on 124Xe with the XMASS-I detector
Abstract
Double electron capture is a rare nuclear decay process in which two orbital electrons are captured simultaneously in the same nucleus. Measurement of its two-neutrino mode would provide a new reference for the calculation of nuclear matrix elements whereas observation of its neutrinoless mode would demonstrate lepton number violation. A search for two-neutrino double electron capture on 124Xe is performed using 165.9 days of data collected with the XMASS-I liquid xenon detector. No significant excess above background was observed and we set a lower limit on the half-life as years at 90% confidence level. The obtained limit has ruled out parts of some theoretical expectations. We obtain a lower limit on the 126Xe two-neutrino double electron capture half-life of years at 90% confidence level as well.
keywords:
Double electron capture , Neutrino , Liquid xenon1 Introduction
The observed baryon asymmetry in the Universe still proves to be a fundamental challenge, calling for physics beyond the standard model of particle physics. Lepton number violation involving Majorana neutrinos is one way to address this challenge in the context of leptogenesis [1]. The most sensitive probe for lepton number violation is neutrinoless double beta decay ()
| (1) |
where and are the atomic number and atomic mass number of a given nucleus, respectively. Its inverse, neutrinoless double electron capture (ECEC), is also a lepton number violating process
| (2) |
where two orbital electrons are captured simultaneously. This process is expected to have a longer life-time and accompanied by a photon that carries away the decay energy. However, a possible enhancement of the capture rate by a factor as large as can occur if the masses of the initial and final (excited) nucleus are degenerate [2], and hence this nuclear decay process is also attracting attention both theoretically [3, 4, 5, 6] and experimentally [7, 8, 9, 10, 11]. Moreover, neutrinoless positron-emitting electron capture (EC) and neutrinoless double beta plus decay () may occur in the same nucleus depending on the mass difference between the initial and final nuclei. Detection of these nuclear decay modes could help to determine the effective neutrino mass and parameters of a possible right-handed weak current [12, 13].
On the other hand, two-neutrino double beta decay (2) and two-neutrino double electron capture (2ECEC) processes are allowed within the standard model. Although 2 has been observed in more than ten isotopes, there exist only a few positive experimental results for 2ECEC so far: a geochemical measurement for 130Ba with a half-life of years [14] and a direct measurement for 78Kr with a half-life of years [11]. In the case that after the 2ECEC process the nucleus is in the ground state, the observable energy comes from atomic de-excitation and nuclear recoil; depending on the nucleus, the energy deposited by nuclear recoil may become negligible, leading to a well defined energy deposit dominated by the atomic de-excitation - a line spectrum. Nevertheless, little attention has been paid to direct detection of this process because of difficulties due to small natural abundance and the energy threshold of large volume detectors. Any measurement of 2ECEC will provide a new reference for the calculation of nuclear matrix elements from the proton-rich side of the mass parabola of even-even isobars [15]. Although the matrix element for the two-neutrino mode is different from that for the neutrinoless mode, it gives constraints on the relevant parameters within a chosen model [16].
The XMASS detector uses liquid xenon in its natural isotopic abundance as its active target material. Among others it contains the double electron capture nuclei 124Xe (0.095%) and 126Xe (0.089%), as well as the double beta decay nuclei 136Xe (8.9%) and 134Xe (10.4%). It has been pointed out that large volume dark matter detectors with natural xenon as targets have the potential to measure the 2ECEC on 124Xe [17, 18]. Among the different models for calculating the corresponding nuclear matrix element, there exists a wide spread of calculated half-lives for this process: between and years as summarized in Table 1.
| Model | ( yr) | Reference |
|---|---|---|
| QRPA | 0.4-8.8 | [19] |
| QRPA | 2.9-7.3 | [13] |
| SU(4)στ | 7.0-18 | [20] |
| PHFB | 7.1-18 | [21] |
| PHFB | 61-160 | [22] |
| MCM | 390-980 | [23] |
A previous experiment used enriched xenon. A gas proportional counter containing 58.6 g of 124Xe (enriched to 23%) was looking for the simultaneous capture of two -shell electrons on that isotope, and published the latest lower bound on the half-life T as years [24, 25].
In this paper, we present the result from a search for 2ECEC on 124Xe using the XMASS-I liquid xenon detector.
2 The XMASS-I Detector
XMASS-I is a large single phase liquid xenon detector [26] located underground (2700 m water equivalent) at the Kamioka Observatory in Japan. An active target of 835 kg of liquid xenon is held inside of a pentakis-dodecahedral copper structure that holds 642 inward-looking photomultiplier tubes (PMTs) on its approximately spherical inner surface. The detector is calibrated regularly with 57Co and 241Am sources [27] inserted along the central vertical axis of the detector. Measuring with the 57Co source from the center of the detector volume the photoelectron yield is determined to be 13.9 photoelectrons (PEs)/keV [28]. This large photoelectron yield is realized by a large inner surface photocathode coverage of 62% and the large PMT quantum efficiency of approximately 30%. The non-linear response in scintillation light yield for electron-mediated events in the detector was calibrated with 55Fe, 57Co, 109Cd, and 241Am sources. When a PMT signal exceeds the discriminator threshold equivalent to 0.2 PE, a “hit” is registered on the channel. Data acquisition is triggered if ten or more hits are asserted within 200 ns. Each PMT signal is digitized with charge and timing resolution of 0.05 PE and 0.4 ns, respectively [31]. The liquid xenon detector is located at the center of a cylindrical water Cherenkov veto counter and shield, which is 11 m high with a 10 m diameter. The veto counter is equipped with 72 20-inch PMTs. Data acquisition for the veto counter is triggered if eight or more of its PMTs register a signal within 200 ns. XMASS-I is the first direct detection dark matter experiment equipped with such an active water Cherenkov shield.
3 Expected Signal and Detector Simulation
The process of 2ECEC on 124Xe is
| (3) |
with a -value of 2864 keV. In the case that two -shell electrons in the 124Xe atom are captured simultaneously, a daughter atom of 124Te is formed with two vacancies in the -shell and de-excites by emitting atomic X-rays and/or Auger electrons. The total energy deposition in the detector is keV, where is the binding energy of a -shell electron in a tellurium atom. The energy deposition from the recoil of the daughter nucleus is 30 eV at most, which is negligible. Although 126Xe can also undergo 2ECEC, this reaction is expected to be much slower than that on 124Xe since its -value of 920 keV is smaller. The -values are taken from the AME2012 atomic mass evaluation [32].
The Monte Carlo (MC) generation of the atomic de-excitation signal is based on the atomic relaxation package in Geant4 [33]. While the X-ray and Auger electron tables refer to emission from singly charged ions, 2ECEC produces a doubly charged ion. The energy of the double-electron holes in the -shell of 124Te is calculated to be 64.46 keV [34], which is only 0.8 keV different from the sum of the -shell binding energy of the singly charged ion. Therefore, this difference is negligible in this analysis. Simulated de-excitation events are generated uniformly throughout the detector volume. The MC simulation includes the nonlinearity of the scintillation response [26] as well as corrections derived from detector calibrations. The absolute energy scale of the MC is adjusted at 122 keV. The systematic difference of the energy scale between data and MC due to imperfect modeling of the nonlinearity in MC is estimated as 3.5% by comparing 241Am data to MC. The decay constants of scintillation light and the timing response of the PMTs are modeled to reproduce the time distribution observed with the 57Co (122 keV) and 241Am (60 keV) gamma ray sources [35]. The group velocity of the scintillation light in liquid xenon is calculated from its refractive index (11 cm/ns for 175 nm) [36].
4 Data Sample and Event Selection
The data used in the present analysis were collected between December 24, 2010 and May 10, 2012. Since we took extensive calibration data and various special runs by changing the detector conditions to understand the general detector response and the background, we select periods of operation under what we call normal data taking conditions with a stable temperature ( K) and pressure (0.160-0.164 MPa absolute). After furthermore removing periods of operation with excessive PMT noise, unstable pedestal levels, or abnormal trigger rates, the total livetime becomes 165.9 days.
Event selection proceeds in four stages: pre-selection, fiducial volume cut, timing balance cut, and band-like pattern cut. The pre-selection requires that no outer detector trigger is associated with the event, that the event is separated in time from the nearest event by at least 10 ms, and that the RMS spread of the inner detector hit timings of the event is less than 100 ns. This pre-selection reduces the total effective lifetime to 132.0 days in the final sample.
In order to select events occurring in the fiducial volume, an event vertex is reconstructed based on a maximum likelihood evaluation of the observed light distribution in the detector [26]. We select events satisfying that the radial distance of their reconstructed vertex from the center of the detector is smaller than 15 cm. The fiducial mass of natural xenon in that volume is 41 kg, containing 39 g of 124Xe.
During the data-taking period, a major background in the relevant energy range comes from radioactive contaminants in the aluminum seal of the PMTs. These background events often occur at a blind corner of the nearest PMT and are mis-reconstructed in the inner volume of the detector. The remaining two cuts deal with these mis-reconstructed events. The timing balance cut uses the time difference between the first hit in an event and the mean of the timings of the second half of all the time-ordered hits in the event. Events with smaller time difference are less likely to be events from the detector’s inner surface that were wrongly reconstructed and are kept. The timing balance cut reduces the data by a factor of 5.9 in the signal energy window defined later, while it keeps 80% of signal events remaining after the fiducial volume cut. The band-like pattern cut eliminates events that reflect their origin within grooves or crevices in the inner detector surface through a particular illumination pattern: The rims of the groove or crevice act as an aperture that is projected as a “band” of higher photon counts onto the inner detector surface. This band is characterized by the ratio of the maximum PEs in the band of width 15 cm to the total PEs in the event [35]. Events with smaller ratio are less likely to originate from crevices and are selected. The band pattern cut reduces the data by a factor of 24.6 while it keeps 70% of signal events remaining after the fiducial volume and timing balance cuts.
The fiducial volume, timing balance, and band pattern cut values are optimized to maximize sensitivity to a monoenergetic peak in the 60 keV region. For the fiducial volume cut, the range of the cut value was restricted in the optimization process to be larger than 15 cm in order to avoid too small of an acceptance, and this restriction turns out to determine the optimal value [37].
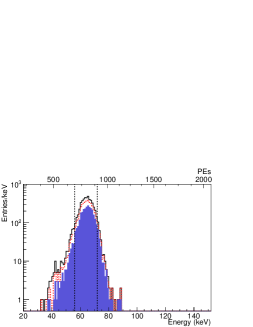
In the present analysis, the total energy deposition of events is reconstructed from the observed number of photoelectrons correcting for the non-linear response of scintillation light yield. The correction is performed assuming the light originates from two X-rays with equal energy. Finally, the signal window is defined such that it contains 90% of the simulated signal with equal 5% tails to either side after all the above were applied, which results in a 5672 keV window. Fig. 1 shows energy spectra of the simulated events after each reduction step. From the simulation, signal detection efficiency is estimated to be 59.7%.
5 Results and Discussion
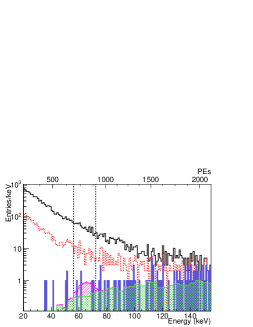
Fig. 2 shows energy distributions of data events remaining after each reduction step. After all cuts, 5 events are left in the signal region but no significant peak is seen. The main contribution to the remaining background in this energy regime is the 222Rn daughter 214Pb in the detector. The amount of 222Rn was estimated to be mBq from the observed rate of 214Bi-214Po consecutive decays. Given the measured decay rate the expected number of background events in the signal region from this decay alone is estimated to be events. The concentration of krypton in the xenon was measured to be 2.7 ppt [26], and thus background from 85Kr is negligible in this analysis. The background from of 136Xe ( years [38]) is smaller than the 214Pb background by a factor of 7 and is negligible for this analysis.
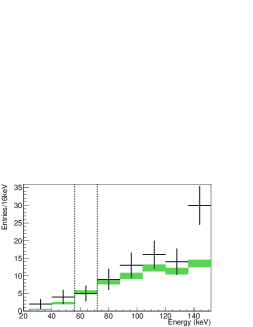
Fig. 3 shows the energy distribution of the observed events overlaid with the 214Pb background simulation after all cuts except for the energy window cut. The energy spectrum after cuts in data is consistent with the expected 214Pb background spectrum. Although the total number of observed events is 26% larger than that of the expected 214Pb background in the energy range between 24 keV and 136 keV but outside the signal window, the tension is still at a 1.4 level with this small statistics. Note that an excess in the highest energy bin is due to a gamma-ray from 131mXe in liquid xenon, and thus this energy bin is not included in the calculation. We derive a conservative limit under the assumption of the 214Pb background constrained by the 214Bi-214Po measurement.
A lower limit on the 2ECEC half-life is derived using the following Bayesian method that also accounts for systematic uncertainties to calculate the conditional probability distribution for the decay rate as follows:
| (4) | |||||
where is the decay rate, is the observed number of events, is the detector exposure including the abundance of 124Xe, is the detection efficiency, is the expected number of background events, and is a parameter representing the systematic uncertainty in the event selection which affects both signal and background. The decay rate prior probability is 1 for and otherwise 0. The prior probability distributions incorporating systematic uncertainties in the detector exposure , detection efficiency , background , and event selection are assumed to be the split normal distribution centered at the nominal value with two standard deviations since some error sources are found to have a different impact on the positive versus the negative side of the distribution center as described below.
Table 2 summarizes the systematic uncertainties in exposure, detection efficiency, and event selection. The systematic uncertainty in the detector exposure is dominated by the uncertainty in the abundance of 124Xe in the xenon. A sample was taken from the detector and its isotope composition was measured at the Geochemical Research Center, the University of Tokyo using a modified VG5400/MS-III mass spectrometer [39]. The result is consistent with that of natural xenon in air, and we treat the uncertainty in that measurement as a systematic error. The systematic uncertainty in the detection efficiency is estimated from comparisons between data and MC simulation for 241Am (60 keV -ray) calibration data at various positions within the fiducial volume. The systematic uncertainty in the energy scale is evaluated to be , summing up in quadrature the uncertainties from the nonlinearity of the scintillation yield (), position dependence (), and time variation (). Changing the number of photons generated per unit energy deposited in the simulation by this amount, the signal efficiency changes by . Since we apply the energy cut on lower and upper sides, both increasing and decreasing number of photons in MC makes signal efficiency smaller. The energy resolution in the calibration data is found to be 12% worse than that in the simulation. The uncertainty due to this difference is evaluated by worsening energy resolution in the simulation, which leads to a reduction in signal efficiency.
The uncertainty in modeling the scintillation decay constant as a function of energy is evaluated to be ns, resulting in an uncertainty in the signal efficiency of . The radial position of the reconstructed vertex for the calibration data differs from the true source position by 5 mm, which causes a reduction in efficiency. For the timing balance and band-like pattern cuts, we evaluate the impact on the signal efficiency by again taking the difference of their acceptance for calibration data and the respective simulation. The resulting change in signal efficiency is for the timing balance cut, and for the band-like pattern cut.
| Item | Error source | Fractional |
| uncertainty (%) | ||
| Exposure | Abundance of 124Xe | |
| Liquid xenon density | ||
| Efficiency | Energy scale | |
| Energy resolution | ||
| Scintillation decay time | ||
| Event selection | Fiducial volume cut | |
| Timing balance cut | ||
| Band-like pattern cut |
Finally, we calculate the 90% confidence level (CL) limit using the relation
| (5) |
to obtain
| (6) |
Note that the total systematic uncertainty worsens the obtained limit by 20%.
In addition, the fact that we do not observe significant excess above background allows us to give a constraint on 2ECEC on 126Xe in the same manner. The fiducial volume contains 36 g of 126Xe and the uncertainty in the abundance of 126Xe is estimated to be 12.1%, and we obtain at 90% CL.
The XMASS project uses a single phase liquid xenon detector with a natural abundance target. This straightforward technology offers easy scalability to larger detectors. The future XMASS-II detector will contain 10 tons of liquid xenon in its fiducial volume as target, and the expected sensitivity of XMASS-II will improve by more than two orders of magnitude over the current limit after 5 years, assuming a background level of day-1kg-1keV-1. This background is due to 2 of 136Xe and +7Be solar neutrinos.
6 Conclusions
In conclusion, we have searched for 2ECEC on 124Xe using an effective live time of 132.0 days of XMASS-I data in a fiducial volume containing 39 g of 124Xe. No significant excess over the expected background is found in the signal region, and we set a lower limit on its half-life of years at 90% CL. The obtained limit has ruled out parts of some theoretical expectations. In addition, we obtain a lower limit on the 126Xe 2ECEC half-life of years at 90% CL. A future detector with XMASS-II characteristics establishes a path toward covering the whole range of half-lives obtained in the model calculations cited in introduction.
Acknowledgments
We thank Prof. Nagao and his group for the measurement of the isotope composition of the xenon used in the XMASS-I detector. We gratefully acknowledge the cooperation of the Kamioka Mining and Smelting Company. This work was supported by the Japanese Ministry of Education, Culture, Sports, Science and Technology, Grant-in-Aid for Scientific Research, JSPS KAKENHI Grant No. 19GS0204 and 26104004, and partially by the National Research Foundation of Korea Grant funded by the Korean Government (NRF-2011-220-C00006).
References
References
- [1] W. Buchmuller, R. D. Peccei, T. Yanagida, Ann. Rev. Nucl. Part. Sci. 55 (2005) 311.
- [2] J. Bernabeu, A. De Rujula, C. Jarlskog, Nucl. Phys. B 223 (1983) 15.
- [3] Z. Sujkowski, S. Wycech, Phys. Rev. C 70 (2004) 052501.
- [4] D. Frekers, hep-ex/0506002.
- [5] M. I. Krivoruchenko et al., Nucl. Phys. A 859 (2011) 140.
- [6] J. Kotila, J. Barea, F. Iachello, Phys. Rev. C 89 (2014) 064319.
- [7] A. S. Barabash et al., Nucl. Phys. A 785 (2007) 371.
- [8] A. S. Barabash et al., Phys. Rev. C 80 (2009) 035501.
- [9] P. Belli et al., Phys. Rev. C 87 (2013) 034607.
- [10] P. Belli et al., Nucl. Phys. A 930 (2014) 195.
- [11] Y. M. Gavrilyuk et al., Phys. Rev. C 87 (2013) 035501.
- [12] W. C. Haxton, G. J. Stephenson, Prog. Part. Nucl. Phys. 12 (1984) 409.
- [13] M. Hirsch et al., Z. Phys. A 347 (1994) 151.
- [14] A. P. Meshik et al., Phys. Rev. C 64 (2001) 035205.
- [15] J. Suhonen, O. Civitarese, Phys. Rept. 300 (1998) 123.
- [16] S. M. Bilenky, C. Giunti, Int. J. Mod. Phys. A 30 (2015) 1530001.
- [17] D.-M. Mei et al., Phys. Rev. C 89 (2014) 014608.
- [18] N. Barros, J. Thurn, K. Zuber, J. Phys. G 41 (2014) 115105.
- [19] J. Suhonen, J. Phys. G 40 (2013) 075102.
- [20] O. A. Rumyantsev, M. H. Urin, Phys. Lett. B 443 (1998) 51.
- [21] S. Singh et al., Eur. Phys. J. A 33 (2007) 375.
- [22] A. Shukla, P. K. Raina, P. K. Rath, J. Phys. G 33 (2007) 549.
- [23] M. Aunola, J. Suhonen, Nucl. Phys. A 602 (1996) 133.
- [24] Y. M. Gavrilyuk et al., Phys. Part. Nucl. 46 (2015) 147.
- [25] Y. M. Gavrilyuk et al., arXiv:1507.04520 [nucl-ex].
- [26] K. Abe et al., XMASS Collaboration, Nucl. Instrum. Meth. A 716 (2013) 78.
- [27] N. Y. Kim et al., XMASS Collaboration, Nucl. Instrum. Meth. A 784 (2015) 499.
- [28] This photoelectron yield is smaller than the value reported in Ref. [26, 29, 30] since we changed a correction on the charge observed in the electronics. This correction is within the uncertainty reported earlier, PE/keV.
- [29] K. Abe et al., XMASS Collaboration, Phys. Lett. B 719 (2013) 78.
- [30] K. Abe et al., XMASS Collaboration, Phys. Lett. B 724 (2013) 46.
- [31] Y. Fukuda et al., Super-Kamiokande Collaboration, Nucl. Instrum. Meth. A 501 (2003) 418.
- [32] M. Wang et al., Chin. Phys. C 36 (2012) 1603.
-
[33]
S. Guatelli et al.,
IEEE Trans. Nucl. Sci. 54 (2007) 585;
S. Guatelli et al., IEEE Trans. Nucl. Sci. 54 (2007) 594. - [34] D. A. Nesterenko et al., Phys. Rev. C 86 (2012) 044313.
- [35] H. Uchida et al., XMASS Collaboration, Prog. Theor. Exp. Phys. (2014) 063C01.
- [36] S. Nakamura et al., in Proceedings of the Workshop on Ionization and Scintillation Counters and Their Uses, vol. 27, 2007.
- [37] K. Abe et al., XMASS Collaboration, Phys. Rev. Lett. 113 (2014) 121301.
- [38] K. A. Olive et al., Particle Data Group, Chin. Phys. C 38 (2014) 090001.
- [39] K.-I. Bajo et al., Earth Planets Space 63 (2011) 1097.