Pressure-induced collapsed-tetragonal phase in SrCo2As2
Abstract
We present high-energy x-ray diffraction data under applied pressures up to = 29 GPa, neutron diffraction measurements up to = 1.1 GPa, and electrical resistance measurements up to = 5.9 GPa, on SrCo2As2. Our x-ray diffraction data demonstrate that there is a first-order transition between the tetragonal (T) and collapsed-tetragonal (cT) phases, with an onset above approximately 6 GPa at = 7 K. The pressure for the onset of the cT phase and the range of coexistence between the T and cT phases appears to be nearly temperature independent. The compressibility along the a-axis is the same for the T and cT phases whereas, along the c-axis, the cT phase is significantly stiffer, which may be due to the formation of an As-As bond in the cT phase. Our resistivity measurements found no evidence of superconductivity in SrCo2As2 for 5.9 GPa and 1.8 K. The resistivity data also show signatures consistent with a pressure-induced phase transition for 5.5 GPa. Single-crystal neutron diffraction measurements performed up to 1.1 GPa in the T phase found no evidence of stripe-type or A-type antiferromagnetic ordering down to 10 K. Spin-polarized total-energy calculations demonstrate that the cT phase is the stable phase at high pressure with a ratio of 2.54. Furthermore, these calculations indicate that the cT phase of SrCo2As2 should manifest either A-type antiferromagnetic or ferromagnetic order.
I Introduction
The body-centered tetragonal Fe2As2 ( = Ca, Sr, Ba) compounds have provided fertile ground for investigations of the interactions between lattice, magnetic and electronic degrees of freedom, and their impact upon unconventional superconductivity (SC) in the iron arsenide compounds Johnston_2010 ; P&G_2010 ; CanBud_2010 ; Stewart_2011 ; M&A_2010 ; Dai_2012 ; Dai_2015 . The superconducting ground state is realized upon the suppression of the magnetic phase transition, ubiquitous to the iron pnictides, through elemental substitutions or under applied pressure. In Ba(Fe1-xCox)2As2, for example, the substitution of only a few percent Co for Fe destabilizes the stripe-type antiferromagnetic (AFM) order by detuning the nesting condition between the electron and hole pockets, allowing the superconducting ground state to appear in the presence of substantial magnetic fluctuations at the stripe-type AFM propagation vector, Qstripe = (). Increased Co substitution ( 0.14) leads to a complete suppression of both stripe-type magnetic fluctuations Matan_2010 and SCNi_2008 . These stripe-type magnetic fluctuations appear to be a key ingredient for SC in the Fe2As2 family in particular, and the iron arsenides more generally.Johnston_2010 ; P&G_2010 ; CanBud_2010 ; Stewart_2011 ; M&A_2010 ; Dai_2012 ; Dai_2015
Recent investigations of the end member Co2As2 ( = Ca, Sr, Ba) family have revealed interesting behavior which can provide new insight into the relationship between magnetism, structure, and SC in the iron arsenides. At ambient pressure, CaCo1.86As2 crystallizes in the so-called collapsed tetragonal (cT) phase, which possesses the same tetragonal (T) ThCr2Si2 structure () as SrCo2As2, BaCo2As2, and the parent Fe2As2 compounds, but with a much reduced lattice parameter and unit cell volume. In the cT phase, CaCo1.86As2 manifests A-type AFM ordering [ferromagnetic (FM) ab planes aligned antiferromagnetically along the c axis] below = 53-77 K,Cheng_2012 ; Ying_2012 ; Dante_2013 ; Vivek_2014 with the ordered moments lying along the c axis. This is a quite different behavior as compared to the closely related CaFe2As2 compound, which undergoes a first-order structural transition under applied pressure from the ambient pressure T or orthorhombic (O) structure (depending on the temperature) to a cT phase Milton_2008 ; Kreyssig_2008 ; Goldman_2009 ; Canfield_2009 in which the Fe magnetic moment is quenched.Pratt_2009 ; Gretarsson_2013 ; Soh_2013
Neither SrCo2As2 nor BaCo2As2 exhibit long-range magnetic order down to = 1.8 K. Instead, both display an enhanced magnetic susceptibility that has been described as Stoner-enhanced paramagnetism close to a quantum instability.Sefat_2009 ; Pandey_2013 Nevertheless, our recent inelastic neutron scattering measurements Jayasekara_2013 on SrCo2As2 indicate that magnetic fluctuations occur at positions corresponding to Qstripe = , which is the same propagation vector that is found in the Fe2As2 parent compounds and superconductors. Although ARPES measurements on both SrCo2As2 (Ref. Pandey_2013, ) and BaCo2As2 (Refs. Xu_2013, ; Dhaka_2013, ) did not reveal any obvious nesting features associated with Qstripe, as found for the Fe2As2 compounds, density-functional theory calculations employing the local-density approximation have revealed maxima in the generalized susceptibility consistent with possibilities for stripe-type, A-type, or ferromagnetic ordering.Jayasekara_2013 For the measured ratio of the lattice parameters in the T phase, calculations of the total energy suggest that the A-type AFM and FM ground states are nearly degenerate, but only slightly preferred over stripe-type AFM order.Jayasekara_2013
Many issues regarding the origin of the stripe-type magnetic fluctuations, and their relationship to SC in the iron arsenides, remain unresolved. For example, it is not clear why the stripe-type magnetic fluctuations in (Fe1-xCox)2As2 systems are suppressed for intermediate values of , only to reappear as for, at least, SrCo2As2.Jayasekara_2013 Whereas the absence of SC in the nonmagnetic cT phase of CaFe2As2 suggests that stripe-type magnetic fluctuations may be a necessary ingredient for SC in the iron arsenides, the absence of SC, down to at least 1.8 K, in the presence of such fluctuations in SrCo2As2 argues that they are not sufficient. With respect to SrCo2As2 itself, given the near degeneracy of the different magnetic ground states from the total-energy calculations mentioned above, it is interesting to consider which magnetic ground state, or perhaps even SC, ultimately triumphs as one tunes the structure and magnetic interactions via either chemical substitution or applied pressure.
Since chemical substitutions can introduce disorder, impurity scattering effects, and localized strain, we have chosen to study SrCo2As2 under applied pressure. Here, we describe high-energy x-ray diffraction measurements of SrCo2As2 at applied pressures up to = 29 GPa, neutron diffraction measurements up to = 1.1 GPa, and electrical resistance measurements up to = 5.9 GPa. Our x-ray diffraction data at = 7 K show a first-order transition between the T and cT structures with an onset above approximately 6 GPa. We find no evidence of SC in electrical resistivity measurements for pressures up to 5.9 GPa and temperatures down to 1.8 K. The resistivity data do, however, show signatures consistent with a pressure-induced phase transition for 5.5 GPa. Our single-crystal neutron diffraction measurements performed up to 1.1 GPa found no evidence of stripe-type or A-type antiferromagnetic ordering down to 10 K in the T phase with an ordered moment greater than 0.4 Co. Using the structural information from our experimental study, we performed spin-polarized total-energy calculations to show that the cT phase is the lowest energy structure for the measured values of the volume change, , with a resulting ratio of 2.5, close to the experimentally observed value. In addition, these calculations indicate that SrCo2As2 should order into either an A-type AFM or FM structure in the cT phase.
II Experimental Details
Single crystals of SrCo2As2 were grown from solution using Sn flux as described previously,Pandey_2013 and stored under inert gas. Energy-dispersive x-ray (EDX) analysis using a JEOL-JSM-5910LV scanning electron microscope found no visible peaks associated with Sn incorporation into the flux-grown sample and the EDX software provided an upper limit on the Sn content of 0.028 at.-%, consistent with previous findings.Pandey_2013
Two sets of high-energy x-ray diffraction (HE-XRD) measurements were performed on station 6-ID-D at the Advanced Photon Source. In the first experiment, data were collected at = 7 K, from ambient pressure up to 29 GPa with an incident x-ray wavelength = 0.24204 Å. A three-pin bronze alloy diamond anvil cell (DAC) was used with either silicon oil or a 4:1 mixture of methanol and ethanol as the pressure transmitting medium. In the second experiment, temperature dependent measurements were performed between = 7 and 300 K, for applied pressures ranging from = 1.8 GPa to 20 GPa using an incident x-ray wavelength = 0.12386 Å. Copper-beryllium membrane-driven DACs were used and helium gas was loaded at 1 GPa to act as the pressure transmitting medium.Yejun_2014 In both experiments finely powdered samples were produced by carefully crushing single crystals, and then loaded into the DAC. Ruby spheres and gold powder were also loaded into the cells for calibrating the applied pressure.Chervin_2001 ; Fei_2007 The DAC was mounted on the cold finger of a He closed-cycle refrigerator with a base temperature of 7 K. The x-ray powder diffraction patterns were recorded using a MAR345 image plate detector positioned 874 mm and 1188 mm behind the sample in the first and second experiments, respectively. The resulting patterns were azimuthally integrated and calibrated using Si powder and cerium dioxide as standards. Data were collected in several runs in each experiment, with different loadings of diamond anvil cells.
Neutron diffraction measurements were performed using a 136 mg single crystal on the SNAP instrument at the Spallation Neutron Source. The single crystal was cut, oriented, and loaded into a NiCrAl alloy piston-cylinder pressure cell with the ( ) reciprocal lattice plane coincident with the horizontal plane of the instrument. Using Fluorinert as the pressure medium and Pb powder as the pressure calibrant, we obtained a maximum pressure of = 1.1 GPa.
The electrical resistance of SrCo2As2 was measured by the standard four-probe method in a Quantum Design Inc., Physical Property Measurement System (PPMS) with the current applied in the ab plane. Four Au wires (12.7 m diameter) were attached to the samples by spot welding. A modified Bridgman cellColombier2007 was used with a 1:1 mixture of -pentane:iso-pentane as the pressure medium. The solidification of this medium occurs in the range of 6 - 7 GPa at ambient temperaturePiermarini1973 ; Kim2011PRB . The pressure was determined by the superconducting transition temperature of Pb,Bireckoven1988 measured by electrical resistance, and the solidification temperature of the medium is visible as a small anomaly in the temperature derivative of the resistivity of the sample.Kim2011PRB
III Results and Discussion
III.1 High-energy X-ray Diffraction Measurements Under Applied Pressure

HE-XRD data were obtained from several runs using DAC configurations with different diamond culet sizes and pressure media. Figure 1 shows background-subtracted data in the vicinity of the (0 0 2) Bragg peak of SrCo2As2 taken at = 7 K using a DAC with a diameter culet, a thick pre-indented rhenium gasket with a diameter hole, and a 4:1 mixture of methanol and ethanol as the pressure medium. Upon increasing pressure at = 7 K, Fig. 1 shows that the (0 0 2) Bragg peak broadens and moves smoothly towards higher , where = 2/, indicating a continuous decrease in the -lattice parameter. The peak broadening is likely due to non-hydrostatic pressure components present in the frozen pressure medium at low temperature. For 6 GPa, a second well-separated peak appears at a higher , signalling the onset of the transition to the cT phase. This peak increases in intensity with increasing pressure as the lower- peak, characteristic of the T phase, diminishes and disappears above 18 GPa. These data demonstrate that there is a first-order phase transition between the T and cT phases with an extended pressure range of coexistence between 6 and 18 GPa as the volume fraction of the T phase decreases and the volume fraction of the cT phase increases. We note that the integrated intensity of the cT-phase (0 0 2) Bragg peak is smaller than that for the T structure. This likely arises from either a decrease in the amount of sample illuminated by the beam, or a change in the degree of preferred orientation of the powder, as the pressure is increased.
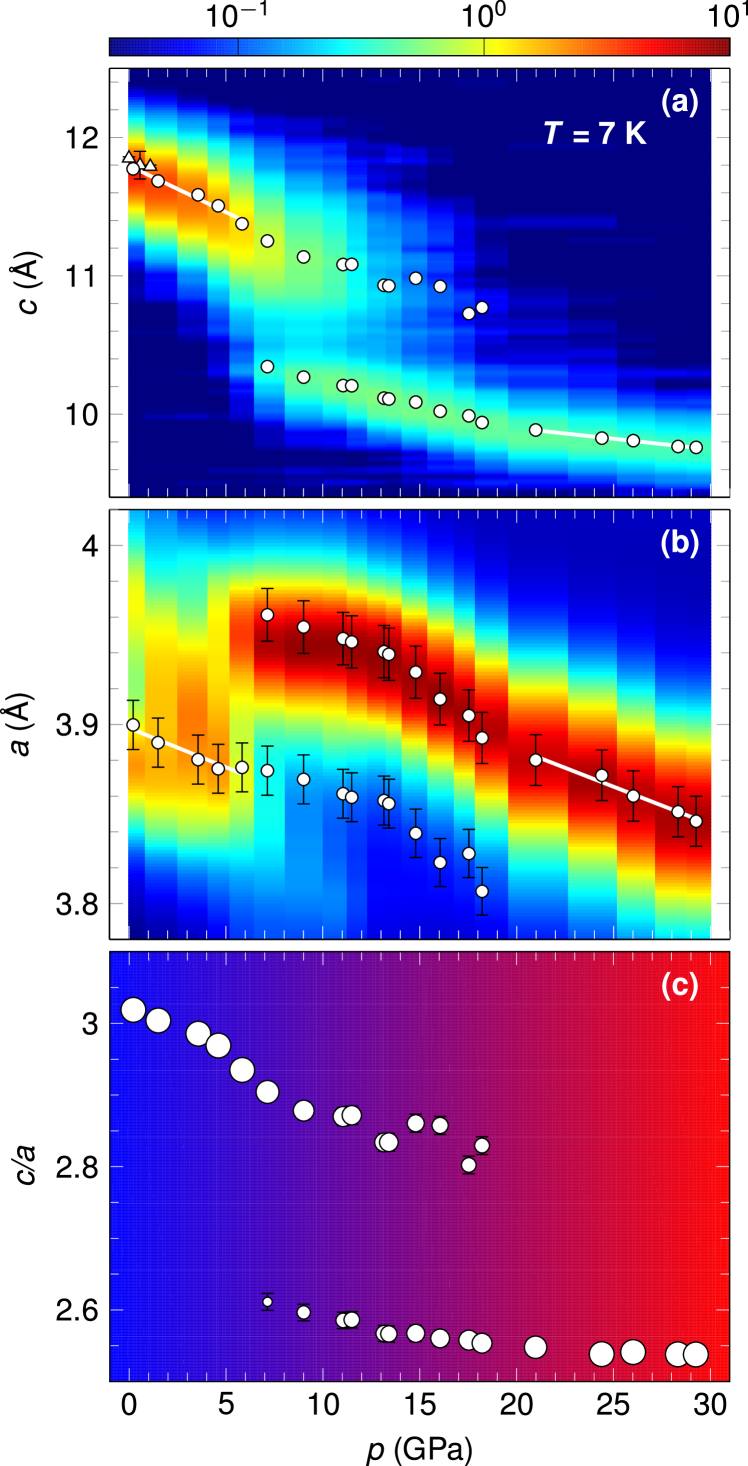
The pressure evolution of the tetragonal unit cell dimensions at = 7 K was derived from fits to the (0 0 2) and (1 1 2) Bragg peaks and is summarized in Fig. 2. At ambient pressure, the -lattice parameter of the T phase is 11.79(1) Å and decreases to 11.38(1) Å at = 5.8 GPa, where the first indication of the transition to the cT phase occurs. There is a region of coexistence between the T and cT phases up to approximately 18 GPa in which a 7.9(3)% reduction in the -lattice parameter, a 2.1(3)% increase in the -lattice parameter, a 3.7(5)% reduction in the unit cell volume, and a 9.9(5)% decrease in the ratio occurs between both phases.
The in-plane (a-axis), out-of-plane (c-axis) and volume compressibilities were calculated from linear fits to the T and cT lattice parameters, excluding the region of coexistence, as shown by the solid white lines in Figs. 2(a) and 2(b). The results are listed in Table 1. The compressibility along the a-axis is the same for the T and cT phases, whereas along the c-axis, the cT phase is significantly stiffer, which may be due to the formation of an As-As bond in the cT phase.Hoffmann_1985 ; Anand_2012
| Structure | - (GPa)-1 | - (GPa)-1 | - (GPa)-1 |
|---|---|---|---|
| T | 0.0011(3) | 0.0057(5) | 0.0078(10) |
| cT | 0.0011(3) | 0.0016(2) | 0.0037(7) |
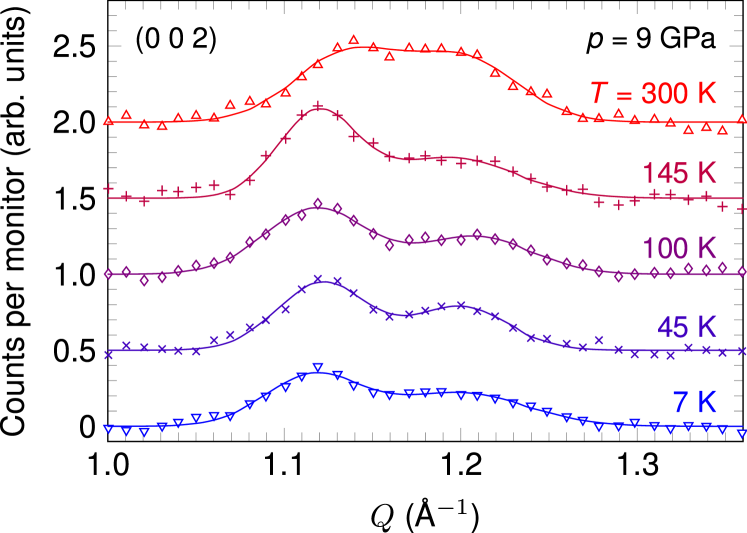
We now turn to the second set of x-ray measurements on SrCo2As2 which focussed on the temperature dependence of the structural T - cT transition. Figure 3 shows the evolution of the (0 0 2) Bragg peak taken at different temperatures on cooling. Measurements were made using the membrane-driven Cu-Be DAC with a 600 m diameter culet, a 50 m thick pre-indented rhenium gasket with a 200 m diameter hole, and helium gas as the pressure medium. Upon increasing the pressure at ambient temperature the cT phase appears at 6.8 GPa, signaled by the presence of the higher- peak above 1.2 Å-1. As shown in Fig. 3, at 9 GPa, both peaks remain in evidence and change only slightly as the temperature is lowered to our base temperature of 7 K, indicating that the T - cT transition - phase line is quite steep.
III.2 Neutron Diffraction Measurements Under Applied Pressure
To check for the possibility of A-type or stripe-type magnetic ordering under applied pressure up to = 1.1 GPa, neutron diffraction measurements were performed using a 136 mg single-crystal sample on the SNAP instrument at the Spallation Neutron Source as described in Section II. Fits to the (0 0 8) nuclear Bragg peak were used to determine the pressure dependence of the -lattice parameter that is in good agreement with our x-ray data over the limited range in pressure [see Fig. 2(a)]. No evidence of either A-type or stripe-type magnetic Bragg scattering in the T phase was found down to = 10 K and up to = 1.1 GPa. Based on the measured intensity of several nuclear Bragg peaks and the background measured in the region of the expected magnetic peaks, we can place an upper limit of 0.4 /Co on the ordered moment for either A-type or stripe-type magnetic order, close to the estimated value of the moment for A-type AFM order in CaCo1.86As2.Cheng_2012 ; Dante_2013 ; Vivek_2014
III.3 Electrical Resistance Measurements Under Applied Pressure
The temperature-dependent resistance was measured on two samples under applied pressures up to = 5.9 GPa as shown in Fig. 4. The residual resistivity ratios (RRR) of the two samples were 8.5 (sample 1) and 10.9 (sample 2), which are somewhat smaller than the values previously measured (15.3),Pandey_2013 and the behavior of the resistivity reported in Ref. Pandey_2013, was not observed for these samples [see the inset to Fig. 4(a)]. The origin of the difference between the behavior observed in previous resistivity measurements and the present data is not yet clear.
Unlike several other FeAs-based compounds, such as CaFe2As2Torikachvili2008PRL , SrFe2As2 and BaFe2As2Colombier2009PRB ; Kim2011PRB , and KFe2As2 (Ref. Taufour2014PRB, ) or another CoAs-based compound, BaCo2As2Ganguli2013 , we find that the room temperature resistivity of SrCo2As2 increases with increasing pressure. Between approximately = 2.0 GPa and 4.5 GPa we also observe a shallow upturn in the resistivity below = 5 K which prevents analysis of the pressure dependence of the temperature coefficient of the resistivity. Of importance here, however, is the absence of SC at all pressures measured for 1.8 K, and the presence of an anomaly in the resistivity below 100 K for 5.5 GPa. To examine this anomaly more closely, in Fig. 4(b) we plot the derivative of the resistivity as a function of temperature and the inset displays the peak position in d/d as a function of pressure. At ambient pressure, there is a broad, cross-over-like, peak at 77 K that moves down to 40 K with increasing pressure up to 4.7 GPa. Above 5.5 GPa, we find a distinct change in this feature that is likely related to the onset of the T to cT transition. A sharp peak appears in d/d and rapidly increases in temperature as pressure is increased.

III.4 Spin-polarized Total Energy Calculations
Using the results of our diffraction measurements, we performed spin-polarized calculations of the total energy to determine (1) if the cT phase is found as the stable structural phase at the experimentally determined volume reduction; and (2) how the preference for magnetic ordering is modified in the cT structure. We used the full potential linearized augmented plane wave (FPLAPW) methodBlaha_2001 with a generalized gradient approximation functional (GGA),Perdew_1996 and employed 2.3, 2.0, 2.0 atomic unit muffin-tin radii for Sr, Co and As, respectively, with = 8.0. Calculations were iterated, with 2400 k points for the entire Brillouin zone, to reach the total energy convergence criterion of 0.01 mRy/cell. The experimentally determined unit cell dimensions were used, and the As positional coordinate As = 0.3588 (Ref. Pandey_2013, ) was held constant for all calculations.
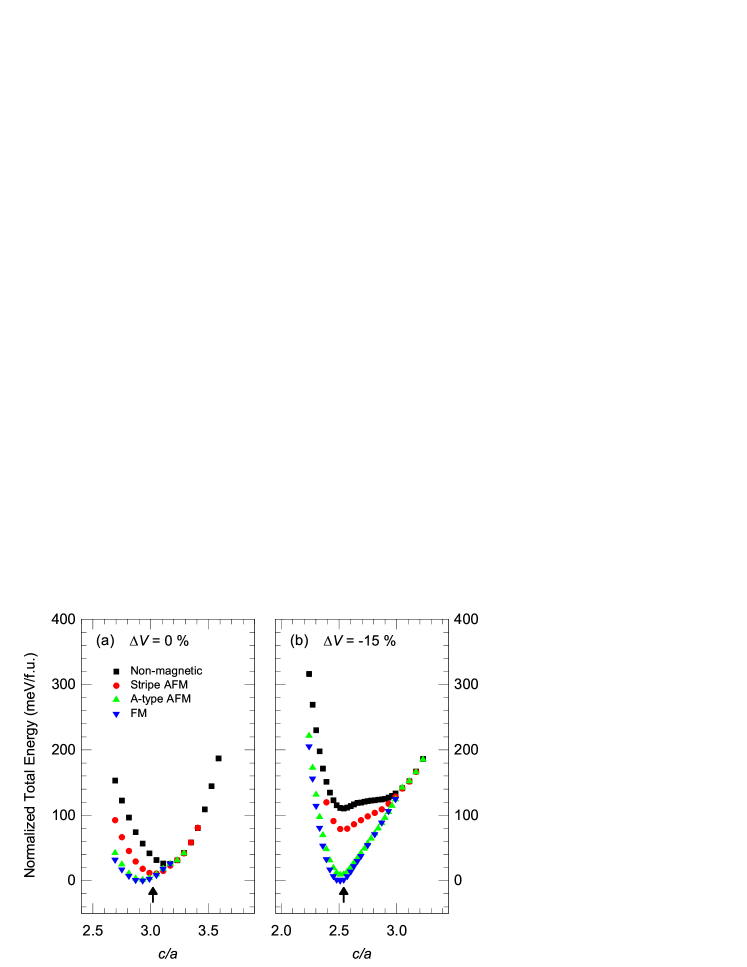
Figure 5 shows the results for two different unit cell volumes corresponding to volume changes of = 0% (T structure) and = % (cT structure for 20 GPa). The total energy calculations at ambient pressure are consistent with our previous calculations.Jayasekara_2013 The total-energy calculations for = % show that the cT phase is the minimum energy structure with a value of = 2.54, close to the experimentally observed value of 2.55 at = 21 GPa.
We also find that both the FM and A-type AFM order minimize the total energy and are nearly degenerate, whereas the total energy for stripe-type magnetic order lies somewhat above these values. We note that even in the T structure, magnetic order is predicted by these calculations for the observed value of indicated by the arrows in Fig. 5. We speculate that the near degeneracy in the magnetic ground state energies for the FM and A-type AFM order introduces some degree of frustration, suppressing long-range magnetic order at ambient pressure. Our calculations still evidence a near-degeneracy between FM and A-type AFM order in the cT phase although, now, the stripe-type magnetic order lies higher in energy than either of these alternatives. These results suggest that magnetic ordering in the cT phase should be either A-type AFM or FM, despite the presence of strong stripe-type magnetic fluctuations at ambient pressure.Jayasekara_2013
IV Summary
We have identified the onset of a pressure-induced cT phase for SrCo2As2 at 6 GPa for = 7 K. The transition between the T and cT phases appears to be first-order with an extended region of phase coexistence. Beyond 18 GPa, only the cT phase is observed. Our x-ray and resistivity data also indicate that the T - cT transition - phase line is quite steep. Down to 1.8 K, our electrical resistance measurements find no evidence of superconductivity up to our maximum pressure of 5.9 GPa but an anomalous change in d/d, likely associated with the T - cT transition, appears above = 5.5 GPa. The peak position of this feature rapidly increases in temperature with pressure. The compressibilities of the T and cT phases along the a-axis are the same, within error, but differ strongly along the c-axis, as the cT phase is more than a factor of three stiffer. Neutron diffraction measurements up to 1.1 GPa failed to identify A-type or stripe-type magnetic order for applied pressures GPa and temperatures K with an upper limit of 0.4 /Co. Our total-energy calculations confirm that the cT phase, with a ratio of 2.54, is the stable structural phase at high pressure and suggest that the magnetic ordering in the cT phase should be either A-type AFM or FM. Further magnetic neutron diffraction measurements on single crystal samples at higher pressures and x-ray magnetic circular dichroism measurements are planned to search for possible magnetic order in the cT phase.
Acknowledgements.
The authors gratefully acknowledge the assistance of D. Robinson, B. Lavina, S. Tkachev, C. Kenney-Benson and S. Sinogeiken with the HE-XRD measurements and useful discussions with D. Haskel and J. C. Lang. Work at the Ames Laboratory was supported by the Department of Energy, Basic Energy Sciences, Division of Materials Sciences & Engineering, under Contract No. DE-AC02-07CH11358. This research used resources of the Advanced Photon Source, a U.S. Department of Energy (DOE) Office of Science User Facility operated for the DOE Office of Science by Argonne National Laboratory under Contract No. DE-AC02-06CH11357. Research conducted at the ORNL Spallation Neutron Source was sponsored by the Scientific User Facilities Division, Office of Basic Energy Sciences, U.S. Department of Energy. Use of the COMPRES-GSECARS gas loading system was supported by COMPRES under NSF Cooperative Agreement EAR 11-57758 and by GSECARS through NSF Grant EAR-1128799 and DOE Grant DE-FG02-94ER14466. Portions of this work were performed at HPCAT (Sector 16), Advanced Photon Source (APS), Argonne National Laboratory. HPCAT operations are supported by DOE-NNSA under Award No. DE-NA0001974 and DOE-BES under Award No. DE-FG02-99ER45775, with partial instrumentation funding by NSF.References
- (1) D. C. Johnston, Adv. Phys. 59, 803 (2010).
- (2) J. Paglione and R. L. Greene, Nat. Phys. 6, 645 (2010).
- (3) P. C. Canfield and S. L. Bud’ko, Annu. Rev. Condens. Matter Phys. 1, 27 (2010).
- (4) G. R. Stewart, Rev. Mod. Phys. 83, 1589 (2011).
- (5) M. D. Lumsden and A. D. Christianson, J. Phys.: Condens. Matter 22, 203203 (2010).
- (6) P. Dai, J. Hu, and E. Dagotto, Nat. Phys. 8, 709 (2012).
- (7) P. Dai, Rev. Mod. Phys. 87, 855 (2015).
- (8) K. Matan, S. Ibuka, R. Morinaga, S. Chi, J. W. Lynn, A. D. Christianson, M. D. Lumsden, and T. J. Sato, Phys. Rev. B 82, 054515 (2010); T. J. Sato, K. Matan, S. Ibuka, R. Morinaga, S. Chi, J. W. Lynn, A. D. Christianson, and M. D. Lumsden, Phys. Rev. B 83, 059901(E) (2011).
- (9) N. Ni, M. E. Tillman, J.-Q. Yan, A. Kracher, S. T. Hannahs, S. L. Bud’ko, and P. C. Canfield, Phys. Rev. B 78, 214515 (2008).
- (10) B. Cheng, B. F. Hu, R. H. Yuan, T. Dong, A. F. Fang, Z. G. Chen, G. Xu, Y. G. Shi, P. Zheng, J. L. Luo, and N. L. Wang, Phys. Rev. B 85, 144426 (2012).
- (11) J. J. Ying, Y. J. Yan, A. F. Wang, Z. J. Xiang, P. Cheng, G. J. Ye, and X. H. Chen, Phys. Rev. B 85, 214414 (2012).
- (12) D. G. Quirinale, V. K. Anand, M. G. Kim, A. Pandey, A. Huq, P. W. Stephens, T. W. Heitmann, A. Kreyssig, R. J. McQueeney, D. C. Johnston, and A. I. Goldman, Phys. Rev. B. 88, 174420 (2013).
- (13) V. K. Anand, R. S. Dhaka, Y. Lee, B. N. Harmon, A. Kaminski, and D. C. Johnston, Phys. Rev. B 89, 214409 (2014).
- (14) M. S. Torikachvili, S. L. Bud ko, N. Ni, and P. C. Canfield, Phys. Rev. Lett. 101, 057006 (2008).
- (15) A. Kreyssig, M. A. Green, Y. Lee, G. D. Samolyuk, P. Zajdel, J. W. Lynn, S. L. Bud’ko, M. S. Torikachvili, N. Ni, S. Nandi, J. B. Leao, S. J. Poulton, D. N. Argyriou, B. N. Harmon, R. J. McQueeney, P. C. Canfield, and A. I. Goldman, Phys. Rev. B 78, 184517 (2008).
- (16) A. I. Goldman, A. Kreyssig, K. Prokeš , D. K. Pratt, D. N. Argyriou, J. W. Lynn, S. Nandi, S. A. J. Kimber, Y. Chen, Y. B. Lee, G. Samolyuk, J. B. Leão, S. J. Poulton, S. L. Bud’ko, N. Ni, P. C. Canfield, B. N. Harmon, and R. J. McQueeney, Phys. Rev. B 79, 024513 (2009).
- (17) P. C. Canfield, S. L .Bud’ko, N. Ni, A. Kreyssig, A. I. Goldman, R. J. McQueeney, M. S. Torikachvili, D. N. Argyriou, G. Luke and W. Yu, Physica C 469, 404 (2009).
- (18) D. K. Pratt, Y. Zhao, S. A. J. Kimber, A. Hiess, D. N. Argyriou, C. Broholm, A. Kreyssig, S. Nandi, S. L. Bud’ko, N. Ni, P. C. Canfield, R. J. McQueeney, and A. I. Goldman, Phys. Rev. B 79, 060510(R) (2009).
- (19) H. Gretarsson, S. R. Saha, T. Drye, J. Paglione, J. Kim, D. Casa, T. Gog, W. Wu, S. R. Julian, and Y.-J. Kim, Phys. Rev. Lett. 110, 047003 (2013).
- (20) J. H. Soh, G. S. Tucker, D. K. Pratt, D. L. Abernathy, M. B. Stone, S. Ran, S. L. Bud’ko, P. C. Canfield, A. Kreyssig, R. J. McQueeney, and A. I. Goldman, Phys. Rev. Lett. 110, 227002 (2013).
- (21) A. S. Sefat, D. J. Singh, R. Jin, M. A. McGuire, B. C. Sales, and D. Mandrus, Phys. Rev. B 79, 024512 (2009).
- (22) A. Pandey, D. G. Quirinale, W. Jayasekara, A. Sapkota, M. G. Kim, R. S. Dhaka, Y. Lee, T. W. Heitmann, P. W. Stephens, V. Ogloblichev, A. Kreyssig, R. J. McQueeney, A. I. Goldman, A. Kaminski, B. N. Harmon, Y. Furukawa, and D. C. Johnston, Phys. Rev. B 88, 014526 (2013).
- (23) W. Jayasekara, Y. Lee, A. Pandey, G. S. Tucker, A. Sapkota, J. Lamsal, S. Calder, D. L. Abernathy, J. L. Niedziela, B. N. Harmon, A. Kreyssig, D. Vaknin, D. C. Johnston, A. I. Goldman, and R. J. McQueeney, Phys. Rev. Lett. 111, 157001 (2013).
- (24) N. Xu, P. Richard, A. van Roekeghem, P. Zhang, H. Miao, W. L. Zhang, T. Qian, M. Ferrero, A. S. Sefat, S. Biermann, and H. Ding, Phys. Rev. X 3, 011006 (2013).
- (25) R. S. Dhaka, Y. Lee, V. K. Anand, D. C. Johnston, B. N. Harmon, and A. Kaminski, Phys. Rev. B 87, 214516 (2013).
- (26) Y. Feng, D. M. Silevitch, and T. F. Rosenbaum, Rev. Sci. Instrum. 85, 033901 (2014).
- (27) J. C. Chervin, B. Canny, M. Mancinelli, High Press. Res. 21, 305 (2001).
- (28) Y. Fei, A. Ricolleau, M. Frank, K. Mibe, G. Shen, and V. Prakapenka, Proc. Nat. Acad. Sci. 104, 9182 (2007).
- (29) R. Hoffmann and C. Zheng, J. Phys. Chem. 89, 4175 (1985).
- (30) V. K. Anand, P. K. Perera, Abhishek Pandey, R. J. Goetsch, A. Kreyssig, and D. C. Johnston, Phys. Rev. B 85, 214523 (2012).
- (31) E. Colombier and D. Braithwaite, Rev. Sci. Instrum. 78, 093903 (2007).
- (32) G. J. Piermarini, S. Block, and J. Barnett, J. Appl. Phys. 44, 5377 (1973).
- (33) S. K. Kim, M. S. Torikachvili, E. Colombier, A. Thaler, S. L. Bud’ko, and P. C. Canfield, Phys. Rev. B 84, 134525 (2011).
- (34) B. Bireckoven and J. Wittig, J. Phys. E 21, 841 (1988).
- (35) M. S. Torikachvili, S. L. Bud’ko, N. Ni, and P. C. Canfield, Phys. Rev. Lett. 101, 057006 (2008).
- (36) E. Colombier, S. L. Bud’ko, N. Ni, and P. C. Canfield, Phys. Rev. B 79, 224518 (2009).
- (37) V. Taufour, N. Foroozani, M. A. Tanatar, J. Lim, U. Kaluarachchi, S. K. Kim, Y. Liu, T. A. Lograsso, V. G. Kogan, R. Prozorov, S. L. Bud’ko, J. S. Schilling, and P. C. Canfield, Phys. Rev. B 89, 220509 (2014).
- (38) C. Ganguli, K. Matsubayashi, K. Ohgushi, Y. Uwatoko, M. Kanagaraj, and S. Arumugam, Mater. Res. Bull. 48, 4329 (2013).
- (39) P. Blaha, K. Schwarz, G. K. H. Madsen, D. Kvasnick, and J. Luitz, WIEN2k, An Augmented Plane Waves and Local Orbitals Program for Calculating Crystal Properties (Technical University of Wien, Vienna, Austria, 2001).
- (40) J. P. Perdew, K. Burke, and M. Ernzerhof, Phys. Rev. Lett. 77, 3865 (1996).