SF2A 2014
Galaxy Formation History Through Hod Model From Euclid Mock Catalogs
Abstract
Halo Occupation Distribution (HOD) is a model giving the average number of galaxies in a dark matter halo, function of its mass and other intrinsic properties, like distance from halo center, luminosity and redshift of its constituting galaxies. It is believed that these parameters could also be related to the galaxy history of formation. We want to investigate more this relation in order to test and better refine this model. To do that, we extract HOD indicators from EUCLID mock catalogs for different luminosity cuts and for redshifts ranges going from . We study and interpret the trends of indicators function of these variations and tried to retrace galaxy formation history following the idea that galaxy evolution is the combination rather than the conflict of the two main proposed ideas nowadays: the older hierarchical mass merger driven paradigm and the recent downsizing star formation driven approach.
keywords:
Halo Occupation Distribution, EUCLID, Mock catalogs, Galaxy Formation1 Introduction
Long time passed before advances in the theory of dark matter halo formation (DMH) by hierarchical mass merger driven process and its relation to galaxy formation (from the fact that inflow of gas into DMH potential well to a high cold gas density (White & Rees 1978) could trigger star formation) could be tested through N body simulations combined with semi analytic approach (Lacey & Cole 1993). Many advances in trying to model galaxy halo’s number or the Halo Occupation Distribution (HOD) will follow after but it was mainly Kauffmann et al. (1999) and Benson et al. (2000) who stated first that the average number of galaxies in a given DMH, which is directly related to the HOD, depends as a power law on its mass. This law has been later refined to explain why it breaks on small and very large scale by taking into account the role of other parameters, like distance of galaxies from halo center, thus dividing them into big massive luminous centrals and smaller satellites (Berlind & Weinberg 2002; Kravtsov et al. 2004), or luminosity of halo’s constituting galaxies (Zheng et al. 2005). Attempts also where made to include evolution of halo’s number of progenitors through redshift (Zheng et al. 2007).
Several groups (Zehavi et al. 2005; Zheng et al. 2007; Abbas et al. 2010; Coupon et al. 2012) have tried to investigate galaxy formation by studying HOD obtained from a fit to a correlation function extracted from different surveys. We aim at doing the same with the difference that we compute HOD directly from mock catalogs constructed by Merson et al. (2013) from simulations of future observations by EUCLID space mission. This will be a test of the upcoming EUCLID mission and an attempt to extent works cited before as none of them have used a sample of galaxies as large and deep at the same time as EUCLID, with redshift reaching and potential galaxy number observed, in the order of (Euclid Definition Study Report 2011).
Many concordant evidences and observations (see Silk & Mamon 2012, and references therein), have helped establish a hierarchical theory of galaxy formation as a continuation to the DMH bottom up scenario of large scale structures evolution. This theory (from White & Rees (1978); White & Frenk (1991)to Hopkins et al. (2006, 2008)) has been challenged by other observational data of galaxy mass downsizing from zone down to low redshifts (Cowie et al. 1996). This led Heavens et al. (2004) and De Lucia et al. (2006) to suggest that it is due to the fact that most early type massive galaxies stop forming stars first due to different quenching processes, while late type lower mass ones remains active and become quiescent later (Kauffmann et al. 2003).
In this study, we extract HOD’s mean galaxy number for different luminosity cuts and redshifts ranges. We then calculate for each extraction its specific indicators like (resp. ) mass of halo hosting one central (resp. satellite) galaxies, the index of the power law, the average halo mass weighted by galaxy number and galaxy satellites fraction . After that, we try to interpret the change in their trend, function of redshift and luminosity, in the light of the previously advanced ideas of galaxy formation.
2 Data selection
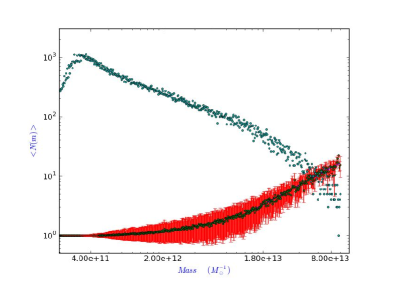
EUCLID is a space telescope developed by ESA to be launched in 2019. It will perform visible and near-infrared imaging up to apparent magnitude and NIR spectroscopy in system for wavelength range going from 460 to 2000 . This will allow him to scan galaxies in a large region of 15,000 with depth reaching (see Euclid Definition Study Report 2011). To test the benefit of such an unprecedented deep and large survey on galaxy history of formation through cosmic time, we used mock catalogs constructed by Merson et al. (2013). These mock catalogs were constructed by grafting a semi-analytic model of galaxy formation, GALFORM from Lagos et al. (2011) onto the N-body dark matter halo merger trees of the Millennium Simulation by Springel et al. (2005). From the different outputs of these constructions we use the EUCLID 100 Hband DEEP lightcone implemented using the Lagos12 GALFORM model. The lightcone covers the redshift range to and has a sky coverage of 100.21 , with an apparent magnitude cut and a cosmology of ; ; ; ; . We want to extract the HOD from our mock catalog to study how this distribution vary according to halo mass of course, but also redshift range and luminosity cut. We take redshift bin to be . This range will allow us first to spot changes in trends related to galaxy formation and evolution from local universe to redshift as well as when passing to zone and higher. We move next to the luminosity criteria and begin with an absolute band magnitude range between for all redshift limited samples. We stay on a stable number of galaxies within this magnitude variation which is also above the threshold brightness that insure completeness for all the samples in our redshift ranges. Taking these considerations into account, we varied this luminosity range by to get more samples and compare their plots of variation. We come at the end to the choice of the mass bin. The whole mass range up to will be divided to 500 bins. This is small enough to detect the HOD indicators mentioned before, which are in the order of and and large enough to insure the robustness of the bin as a sample of number of halos. We also limit ourselves to as upper limit as the number of halos above that value drops below 10 (Left Panel of Fig. 1) and the systematic statistical error becomes higher than 10%
3 Method and results
To model HOD, we use Berlind & Weinberg (2002) and Kravtsov et al. (2004) parametrization
for , the minimum halo mass for hosting one central galaxy and for
, being the mass above which the halo could host a satellite. After calculating mean galaxy number per halo mass for
samples chosen according to the previous section (see Left of Fig. 1 as example for one redshift range), we calculate Mmin, Mamp and , then extract
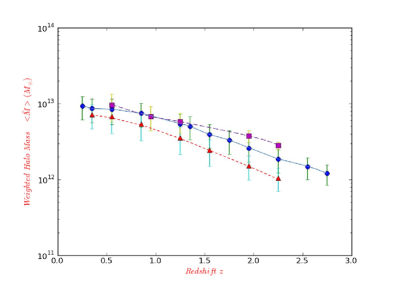
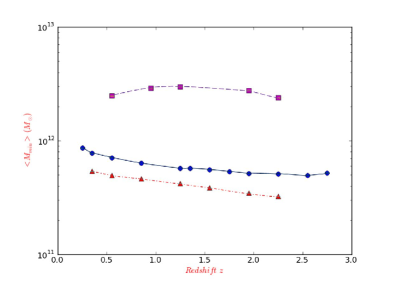
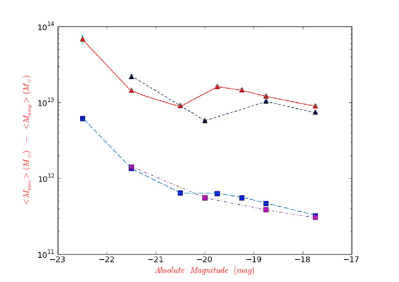
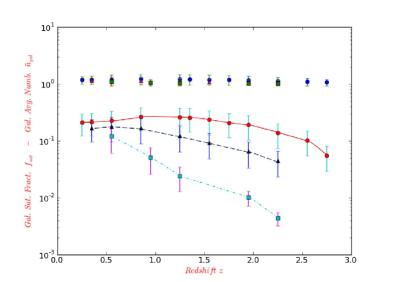
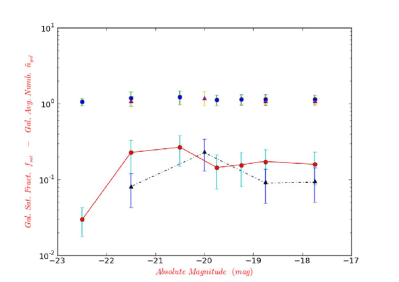
three more indicators : weighted average halo mass , galaxy average number per halo and galaxy satellite
fraction and represent their variation in function of (Left Panel of Fig. 2) or in function of luminosity
(Right Panel of Fig 2).
To summarize, we say that and decrease from high to touch a bottom at
before rising a little again after, with a linear correlation between and in accordance with
Zheng et al. (2005) simulations studies and Coupon et al. (2012) observations studies for lower values of redshift.
These trends are consistent with those found in both
the local (Zehavi et al. 2005, 2011) and distant Universe studies (Zheng et al. 2007; Abbas et al. 2010).
Also they concord in the general trends with results on observations
between and done by Coupon et al. (2012).
As a first general interpretation (more thorough analyzes in upcoming Sakr & Benoist paper) of these trends we say that combining the hierarchical and the downsizing theory could account for most of their behavior. We divide the redshift range in three parts, , in which galaxy increase formation rate and increase mass is fueled by high merger rate of early structure formed in high density peaks along with active star formation of the still young galaxies, , where this process culminate and stabilize with downsizing effect beginning to show and finally where big merger rate and new born galaxies drops and early galaxies type quench star formation while late type small are still active resulting in a downturn of the previous trend (not the absence of this behavior for high luminosity cuts leaving only massive early type galaxies that follow the hierarchical theory). This conciliates discrepancies mentioned previously and concords with the same trend observed for the three zone for star formation rate (Cucciati et al. 2012) or galaxy pair merger rate established by Conselice et al. (2008) with a pivot at . It accounts also for the decrease of the rate of big mergers noticed by de Ravel et al. (2009) along with an increase of minor mergers from López-Sanjuan et al. (2010). It is also consistent with the halo mass distribution function of redshift (Kravtsov et al. 2004) suggesting an increase with low in the number of small size DMH ’incubation’ containers resulting in low mass galaxies forming in a rate higher than for the massive ones.
4 Conclusions
The results obtained, showed that we can extend HOD model from only a manifestation of the hierarchical theory of galaxy formation to include other suggested ideas like, as we tried to do, the newly supported by many observational evidences, downsizing approach. However this couldn’t be done without calculating the variation of HOD’s related indicators over a large range of redshift and luminosity. This show the need of conducting large deep spectroscopic surveys like the future Euclid space mission where no restrictions coming from the need to maintain a specific criteria can filter the large population observed to insignificant statistical samples. Also these results could serve as a test for an eventual scientifically meaningful model that will parametrize HOD according to redshift, as such an operation could give more precise physical meaning to the trends we obtained and help clarify many issues related to galaxy formation.
References
- Abbas et al. (2010) Abbas, U., de la Torre, S., Le Fèvre, O., et al. 2010, MNRAS, 406, 1306
- Benson et al. (2000) Benson, A. J., Cole, S., Frenk, C. S., Baugh, C. M., & Lacey, C. G. 2000, MNRAS, 311, 793
- Berlind & Weinberg (2002) Berlind, A. A. & Weinberg, D. H. 2002, ApJ, 575, 587
- Conselice et al. (2008) Conselice, C. J., Rajgor, S., & Myers, R. 2008, MNRAS, 386, 909
- Coupon et al. (2012) Coupon, J., Kilbinger, M., McCracken, H. J., et al. 2012, A&A, 542, A5
- Cowie et al. (1996) Cowie, L. L., Songaila, A., Hu, E. M., & Cohen, J. G. 1996, AJ, 112, 839
- Cucciati et al. (2012) Cucciati, O., Tresse, L., Ilbert, O., et al. 2012, A&A, 539, A31
- De Lucia et al. (2006) De Lucia, G., Springel, V., White, S. D. M., Croton, D., & Kauffmann, G. 2006, MNRAS, 366, 499
- de Ravel et al. (2009) de Ravel, L., Le Fèvre, O., Tresse, L., et al. 2009, A&A, 498, 379
- Heavens et al. (2004) Heavens, A., Panter, B., Jimenez, R., & Dunlop, J. 2004, Nature, 428, 625
- Hopkins et al. (2008) Hopkins, P. F., Hernquist, L., Cox, T. J., & Kereš, D. 2008, ApJS, 175, 356
- Hopkins et al. (2006) Hopkins, P. F., Somerville, R. S., Hernquist, L., et al. 2006, ApJ, 652, 864
- Kauffmann et al. (1999) Kauffmann, G., Colberg, J. M., Diaferio, A., & White, S. D. M. 1999, MNRAS, 303, 188
- Kauffmann et al. (2003) Kauffmann, G., Heckman, T. M., White, S. D. M., et al. 2003, MNRAS, 341, 33
- Kravtsov et al. (2004) Kravtsov, A. V., Berlind, A. A., Wechsler, R. H., et al. 2004, ApJ, 609, 35
- Lacey & Cole (1993) Lacey, C. & Cole, S. 1993, MNRAS, 262, 627
- Lagos et al. (2011) Lagos, C. D. P., Baugh, C. M., Lacey, C. G., et al. 2011, MNRAS, 418, 1649
- Laureijs et al. (2011) Laureijs, R., Amiaux, J., Arduini, S., et al. 2011, ArXiv e-prints
- López-Sanjuan et al. (2010) López-Sanjuan, C., Balcells, M., Pérez-González, P. G., et al. 2010, ApJ, 710, 1170
- Merson et al. (2013) Merson, A. I., Baugh, C. M., Helly, J. C., et al. 2013, MNRAS, 429, 556
- Silk & Mamon (2012) Silk, J. & Mamon, G. A. 2012, Research in Astronomy and Astrophysics, 12, 917
- Springel et al. (2005) Springel, V., White, S. D. M., Jenkins, A., et al. 2005, Nature, 435, 629
- White & Frenk (1991) White, S. D. M. & Frenk, C. S. 1991, ApJ, 379, 52
- White & Rees (1978) White, S. D. M. & Rees, M. J. 1978, MNRAS, 183, 341
- Zehavi et al. (2011) Zehavi, I., Zheng, Z., Weinberg, D. H., et al. 2011, ApJ, 736, 59
- Zehavi et al. (2005) Zehavi, I., Zheng, Z., Weinberg, D. H., et al. 2005, ApJ, 630, 1
- Zheng et al. (2005) Zheng, Z., Berlind, A. A., Weinberg, D. H., et al. 2005, ApJ, 633, 791
- Zheng et al. (2007) Zheng, Z., Coil, A. L., & Zehavi, I. 2007, ApJ, 667, 760