11email: werner@astro.uni-tuebingen.de
Hubble Space Telescope ultraviolet spectroscopy of the hottest known helium-rich pre-white dwarf KPD 0005+5106
We present a model-atmosphere analysis of the ultraviolet echelle spectra of KPD 0005+5106 taken with the Space Telescope Imaging Spectrograph aboard the Hubble Space Telescope. The star is the hottest known pre-white dwarf ( = K, = (cm/s2). Its atmosphere is composed of helium with trace amounts of metals. It is of the so-called O(He) spectral type that comprises very hot helium-rich pre-white dwarfs whose origin is debated. From neon and silicon ionisation balances, we derive tighter constraints on the effective temperature ( K) and improve previous abundance determinations of these elements. We confirm the idea that KPD 0005+5106 is the descendant of an R Coronae Borealis (RCB) star, so is the outcome of a binary-white-dwarf merger. We discuss the relation of KPD 0005+5106 to other O(He) and RCB stars.
Key Words.:
stars: individual: KPD 0005+5106 – stars: abundances – stars: atmospheres – stars: evolution – stars: AGB and post-AGB – white dwarfs1 Introduction
KPD 0005+5106 is the hottest known pre-white dwarf star. It has a helium-dominated atmosphere with trace metals and no detectable hydrogen (H 2.5 % mass fraction; Wassermann et al. 2010). It was originally classified as a hot DO white dwarf (WD) with an effective temperature of = 120 000 K and a surface gravity of = 7 [cm/s2] (Werner et al. 1994), however, it was realized later that the star is much hotter and has a lower surface gravity ( = K, = ), i.e., higher luminosity, meaning that it actually is still helium-shell burning (Werner et al. 2007). Consequently, it must be classified as an O(He) star, a designation introduced by Mendez (1991) for helium-dominated pre-white dwarfs with spectra characterized by absorption lines from ionized helium.
The origin of the O(He) stars is unclear and currently debated (e.g., Reindl et al. 2014). The majority of the pre-white dwarfs are rich in hydrogen and compatible with canonical stellar evolution theory (e.g., Iben 1995). A large number are, however, hydrogen-deficient, and most of these objects are PG 1159 stars that are also helium-rich but, in contrast to the O(He) stars, also strongly enriched in carbon and oxygen. The PG 1159 surface chemistry is explained by a late helium-shell flash that consumes the hydrogen envelope and dredges up helium, enriched by He-burning ashes from the stellar core (Iben et al. 1983; Herwig et al. 1999; Werner & Herwig 2006). It has been argued that the O(He) stars represent a distinct post-AGB sequence, possibly initiated by binary WD mergers, and it was speculated that they are descendants of the R Coronae Borealis (RCB) stars. This evolutionary link was invoked particularly for KPD 0005+5106 because its trace element abundances are rather similar (Rauch et al. 2008; Wassermann et al. 2010).
RCB stars are hydrogen-deficient supergiants (Clayton 1996) with = 4000 – 8000 K and = 0.5 – 1.5. There is now general consensus that RCB stars have a binary WD merger origin (Webbink 1984), based on evidence from evolution timescales, pulsation masses, and surface element abundances (Saio & Jeffery 2002; Pandey et al. 2006; Clayton et al. 2007). Closely related are the Extreme Helium stars (EHe), which are hotter, early-type (A and B) supergiants with similar photospheric composition, and they are assumed descendants of the RCB stars (e.g., Jeffery et al. 2011).
The abundance pattern of KPD 0005+5106 was derived by the analysis of optical but mainly far-ultraviolet spectra taken with the Far-Ultraviolet Spectroscopic Explorer (FUSE), covering the wavelength range 912–1180 Å (Rauch et al. 2008; Wassermann et al. 2010). In this paper, we present new ultraviolet (UV) spectra taken with the Hubble Space Telescope (HST), stretching the observed spectral range up to the optical. Our observations were intended to independently check for the effective temperature determination and to improve the determination of trace element abundances to better constrain the relation of KPD 0005+5106 to the RCB stars and to shed more light on the evolutionary status of the O(He) stars.
We begin with a description of the observations (Sect. 2) and continue with a delineation of our model atmospheres and model atoms (Sect. 3) utilized for the spectral analysis. In Sect. 4 we present in detail the line identifications and line fitting procedure. Finally, the results are summarized and discussed in the context of RCB and O(He) stars in Sect. 5.
2 Observations
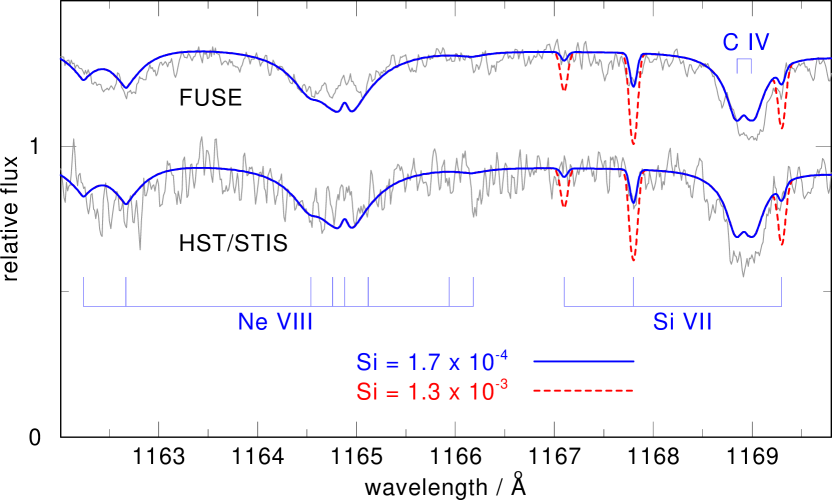
Short-slit (), medium-dispersion UV spectroscopy of KPD 0005+5106 in the STIS/FUV-MAMA and NUV-MAMA configurations was performed with HST during Cycle 19, covering the wavelength range 1150–3100 Å (Table ). The spectral resolving power as listed in Table corresponds to = 0.025–0.037 Å in the 1144–1710 Å range and = 0.054–0.102 Å in the 1616–3072 Å range. The signal-to-noise ratio (S/N) of the far-UV spectrum below 1190 Å is relatively poor such that the quality of the co-added archival FUSE spectra in that wavelength range is better (see Fig. 1 for a comparison). Identified and unidentified photospheric lines are listed in Table .
Previous UV observations in this spectral range were performed with the International Ultraviolet Explorer (IUE, Downes et al. 1987) but the high-resolution spectra have S/N that is too low to detect weak metal lines. HST data were recorded with the Faint Object Spectrograph (FOS) with a low resolution of 2–4 Å (Sion & Downes 1992; Werner et al. 1994), also preventing the detection of weak lines. The same holds for spectra of similar resolution taken with the Hopkins Ultraviolet Telescope (HUT, Kruk & Werner 1998). HST spectra with higher resolution were obtained with the Goddard High Resolution Spectrograph (GHRS); however, only a few selected, about 35 Å wide wavelength intervals were recorded (Werner et al. 1996).
| Dataset | Grating | R | /Å | texp/s |
|---|---|---|---|---|
| OBON1010 | E230M | 30 000 | 1616–2366 | 300 |
| OBON1020 | E230M | 30 000 | 2277–3072 | 450 |
| OBON1030 | E140M | 45 800 | 1144–1710 | 1215 |
| OBON1040 | E140M | 45 800 | 1144–1710 | 3193 |
| Wavelength/Å | Ion | Transition | |
|---|---|---|---|
| 1162.24, 1162.67 | Ne viii | 5d – 6f | |
| 1164.54, 1164.76 | Ne viii | 5f – 6g | |
| 1164.88 | Ne viii | 5g – 6h | |
| 1165.94:, 1166.15:, 1166.18: | Ne viii | 5f – 6d | |
| 1167.8, 1169.3 | Si vii | ||
| 1168.85, 1168.99 | C iv | 3d – 4f | |
| 1171.12:, 1172.00: | O vi | 4p – 5s | |
| 1198.55, 1198.59 | C iv | 3d – 4p | |
| 1207.68: | Si vi | ||
| 1230.04, 1230.52 | C iv | 3p – 4s | |
| 1236.0 | Si vii | ||
| 1238.82, 1242.80 | N v | 2s – 2p | |
| 1243.1 | ?c𝑐cc𝑐cAlso visible in H1504+65. | ||
| 1287.80 | ? | ||
| 1293.9: | Si vii | ||
| 1315.62:, 1315.85: | C iv | 4p – 7d | |
| 1316.3 | ? | ||
| 1317.7 | ?c𝑐cc𝑐cAlso visible in H1504+65. | ||
| 1319.78 | Ne vii | ||
| 1323.3 | ? | ||
| 1351.21, 1351.29 | C iv | 4d – 7f | |
| 1352.97 | C iv | 4f – 7g | |
| 1382.1 | ? | ||
| 1401.6 | ?c𝑐cc𝑐cAlso visible in H1504+65. | ||
| 1429.1 | ?b𝑏bb𝑏bAlso visible in archival HST spectra of the PG 1159 stars NGC 246 and H1504+65. | ||
| 1437.65 | ?c𝑐cc𝑐cAlso visible in H1504+65. | ||
| 1440.30, 1440.38 | C iv | 4s – 6p | |
| 1441.7 – 1442.7 | ? | ||
| 1450.0, 1450.55, 1451.7 | ?c𝑐cc𝑐cAlso visible in H1504+65. | ||
| 1456.8 | ?b𝑏bb𝑏bAlso visible in archival HST spectra of the PG 1159 stars NGC 246 and H1504+65. | ||
| 1457.85, 1458.25 | ?b𝑏bb𝑏bAlso visible in archival HST spectra of the PG 1159 stars NGC 246 and H1504+65. | ||
| 1461.5 | ? | ||
| 1480.2 | ?b𝑏bb𝑏bAlso visible in archival HST spectra of the PG 1159 stars NGC 246 and H1504+65. | ||
| 1484.9 | ?c𝑐cc𝑐cAlso visible in H1504+65. | ||
| 1548.20, 1550.77 | C iv | 2s – 2p | |
| 1548.67, 1549.34, 1549.45 | N v | 4p – 5d | |
| 1585.81, 1586.11, 1586.14 | C iv | 4p – 6d | |
| 1619.62, 1619.74 | N v | 4f – 5g | em |
| 1640.42 | He ii | 2 – 3 | |
| 1931.96, 1932.01, 1932.04 | Ne viii | 6h – 7i etc. | em |
| 1981.97, 1992.06, 1997.35 | Ne vii | ||
| 2070.92:, 2071.02:, 2071.06: | O vi | 5g – 6h etc. | em |
| 2161.2: | Ne vii | em | |
| 2253.39 | He ii | 3 – 10 | |
| 2306.90 | He ii | 3 – 9 | |
| 2386.13 | He ii | 3 – 8 | |
| 2405.17, 2405.83, 2405.93 | C iv | 4p – 5d | |
| 2511.96 | He ii | 3 – 7 | |
| 2525.02, 2525.27 | C iv | 4d – 5f | |
| 2530.74: | C iv | 4f – 5g | |
| 2698.52:, 2699.47: | C iv | 4p – 5s | |
| 2734.11 | He ii | 3 – 6 | |
| 2820.7, 2860.1 | Ne viii | 3s – 3p | |
| 2907.19 | C iv | 5g – 7h | |
| 2976.75 | Ne viii | 7i – 8k etc. | em |
| 2982.19 | N v | 5g – 6h etc. | em |
| IV | V | VI | VII | VIII | IX | X | |
|---|---|---|---|---|---|---|---|
| C | 54,295 | ||||||
| N | 27,99 | ||||||
| O | 12,16 | 54,291 | |||||
| Ne | 8,9 | 103,761 | 77,506 | ||||
| Mg | 15,18 | 27,60 | 46,147 | 50,269 | |||
| Si | 25,59 | 45,193 | 61,138 | 55,239 | |||
| S | 39,107 | 25,48 | 38,120 | 38,117 | |||
| Ca | 1,0 | 15,23 | 25,126 |
3 Model atoms and model atmospheres
For the spectral analysis we used our non-LTE code444http://astro.uni-tuebingen.de/~TMAP (Werner et al. 2012) to compute plane-parallel line-blanketed atmosphere models in radiative and hydrostatic equilibrium (Werner & Dreizler 1999; Werner et al. 2003). They include helium and the four most abundant trace elements (according to the results of Wassermann et al. 2010): C, N, O, and Ne. Four more species (Mg, Si, S, Ca) were investigated and treated one by one as trace elements, i.e., keeping the atmospheric structure fixed. In the same manner, an extended model atom for Ne was introduced, meaning that non-LTE population numbers were also computed for highly excited levels that were treated in LTE during the preceding model-atmosphere computations. Table summarizes the number of considered non-LTE levels and radiative transitions between them. All model atoms were built from the publicly available Tübingen Model Atom Database (TMAD555http://astro.uni-tuebingen.de/~TMAD), comprising data from different sources, namely Bashkin & Stoner (1975), the databases of the National Institute of Standards and Technology (NIST666http://www.nist.gov/pml/data/asd.cfm), the Opacity Project (OP777http://cdsweb.u-strasbg.fr/topbase/topbase.html, Seaton et al. 1994), CHIANTI888http://www.chiantidatabase.org (Dere et al. 1997; Landi et al. 2013), as well as the Kentucky Atomic Line List999http://www.pa.uky.edu/~peter/atomic.
4 Line identifications and spectral fitting
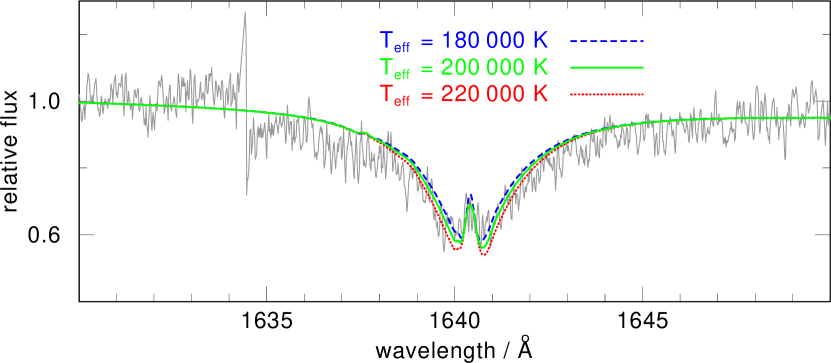
Our analysis builds on the results of Wassermann et al. (2010). We computed a basic model with their derived values for effective temperature ( = 200 000 K), gravity ( = 6.7), and element abundances. The model spectrum was compared to the new HST data, and adjustments of the model parameters were made to improve the spectral line fits. In particular, we checked whether we can constrain better than in the previous work ( K). We do not improve the gravity determination of Wassermann et al. (2010). It was based on a careful analysis of all He ii lines in the UV and optical bands, including Å. This line is also covered by the STIS spectra (Fig. 2); however, the line wings are distorted because of obvious problems with the pipeline data reduction that reveals artificial residuals near the limits of the echelle orders. Interestingly, however, the spectrum exhibits a weak central emission core in the line. Close inspection of the line depth on either side of that emission core reveals that the 200 000 K model fits well and the 180 000 K model fits marginally better. The 220 000 K model can be excluded because the line profile becomes too deep.
Generally, most spectral lines in our HST spectra are fit well by the basic model but, as in Wassermann et al. (2010), we encountered problems with particular lines that are better fit with models with slightly different parameters ( , abundances). In the following we discuss line identifications and model fits as far as they revealed new information compared to previous work.
4.1 Carbon, nitrogen, and oxygen
We see lines from C iv that are well known from PG 1159 stars, but they are significantly weaker in KPD 0005+5106 because of the lower carbon abundance. The abundance derived by Wassermann et al. (2010, C = 0.01)101010All abundances given in mass fractions unless otherwise noted. was a compromise because not all C iv lines in the optical and UV spectra could be fitted with the same value. We adopted that value for our models and kept it fixed. Two examples for lines that are too weak in the model are those at 1169 and 1230 Å presented in Figs. 1 and 3.
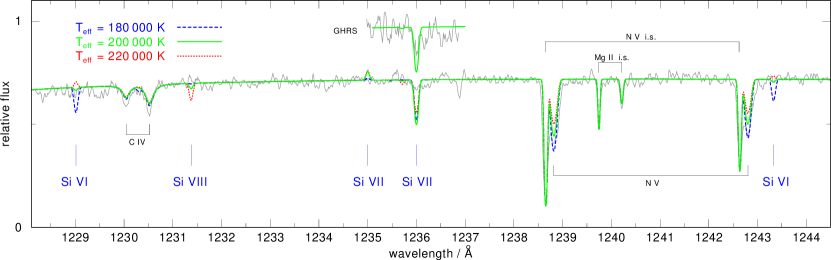
From nitrogen we see, as previously detected in HST spectra, the N v resonance doublet at 1239/1243 Å, blended by stronger blueshifted interstellar components, as well as the N v 5g–6h emission line at 2982.18 Å. We confirm the formerly determined abundance of N = .
Oxygen lines are not present. It is remarkable that the O v 1371 Å line is not detected because it confirms that is at least 180 000 K. At this temperature, the O vi 5g–7h line at 1291 Å would still be detectable, and only a model with 200 000 K or higher is compatible with the absence of this line in the observation. For our modeling, we chose the abundance derived by Wassermann et al. (2010): O = .
4.2 Neon
The presence of Ne viii lines in KPD 0005+5106 was noted by Werner et al. (2007). Assuming = 200 000 K and = 7, an abundance of Ne = 1 % was derived from a fit to the lines at 1162–1166 Å. Wassermann et al. (2010) arrived at a slightly lower abundance of Ne = 0.4 % after a detailed re-analysis that also gave a lower gravity, = 6.7. Figure 1 shows a fit to these lines with Ne = 0.39 % in the model.
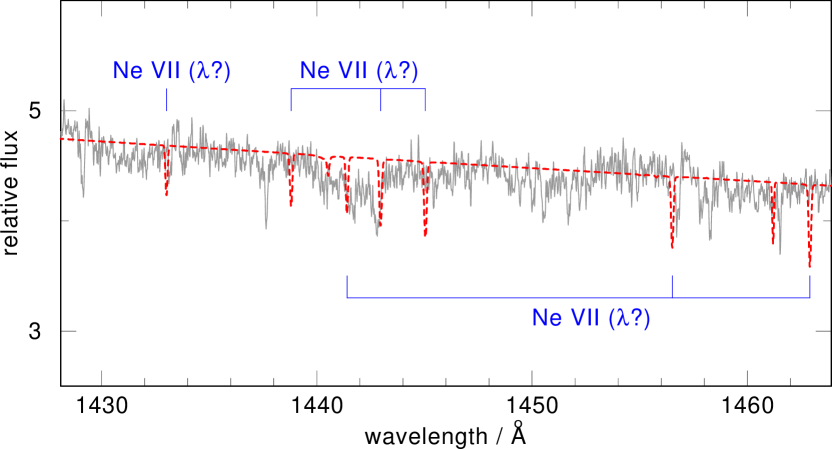

In the new HST spectra, additional neon lines can be assessed. From Ne vii, we identify the strongest component of an intercombination triplet at 1320 Å in absorption. Also, we see the triplet at 1982/1992/1997 Å in absorption. A weak emission feature near 2161 Å can be attributed to a Ne vii singlet. Some more Ne vii lines are covered by the STIS spectra, but their wavelength positions are not well known (see line list in Reader et al. 2015, and uncertainty estimates in the Kentucky database). Our synthetic spectra predict the presence of such lines at positions computed from energy levels. Because of uncertainties in the energies, the line positions are uncertain by several Å. Some of the unidentified lines, therefore, could well stem from Ne vii. In Fig. 4 we show a region where two Ne vii triplets and a singlet are located in the model and where several unidentified lines in the observations are seen. As to Ne viii, an emission feature near 1932 Å is detected, and it was previously identified in the HST/FOS spectrum as an unresolved triplet (Werner et al. 2007). A rather strong Ne viii doublet is present at 2821/2861 Å. The following conclusions can be drawn on and Ne abundance.
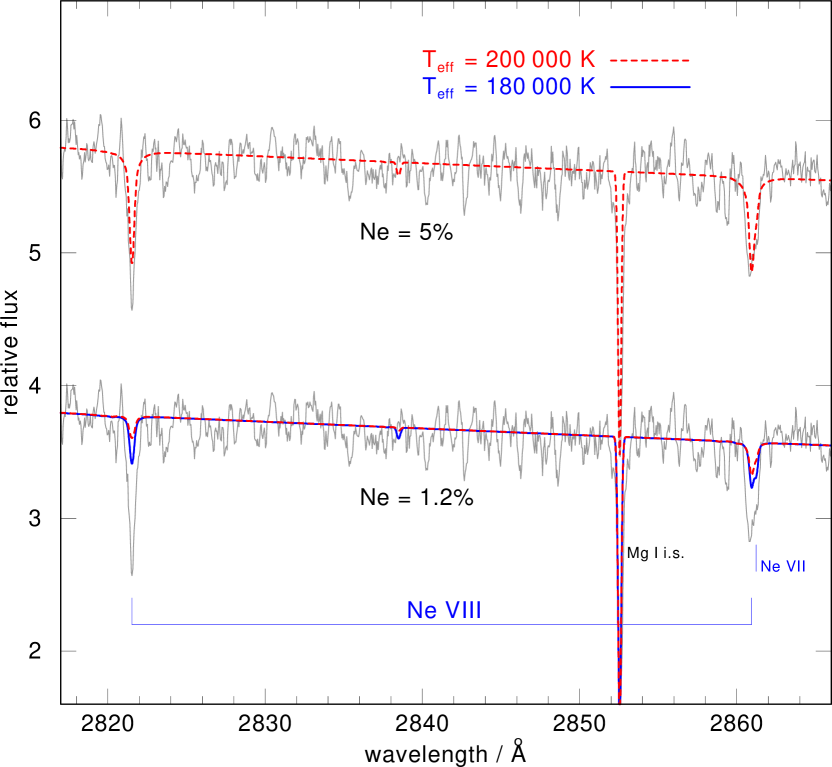
With models containing Ne = 1%, the Ne vii lines fit well at 180 000 K, while at 200 000 K, the 1320 Å line is too weak, and the 1982/1992/1997 Å triplet is in emission in contrast to weak absorption lines seen in the observation (Fig. 5). From the Ne viii lines, no clear preference for the lower or higher can be derived from the 1162–1166 Å features. The 2821/2861 Å doublet poses difficulties. The lines are not deep enough in the models. Figure 6 (bottom) shows that at Ne = 1%, neither a 180 000 K model nor a 200 000 K model fits. A 170 000 K model (not shown) has marginally stronger profiles. This low temperature is, however, excluded because numerous strong Ne vii lines appear in that model that are not observed. Also, it is at odds with the lower limit implied by the absence of O v 1371 Å. Figure 6 (top) shows that an increase in the Ne abundance to 5% would be able to fit the observation, but then again, strong Ne vii lines appear that are not observed. Another problem arises with the 1932 Å line, whose emission height is not at all achieved by any model. In conclusion, all the observed neon lines cannot be fit with a unique abundance value. We adopt Ne = 1% as a compromise.
4.3 Magnesium
We searched for Mg lines without success. According to our models, Mg vii has the strongest lines, but wavelength positions are not known better than about 1–2 Å. At a solar abundance level, UV lines of detectable strength are predicted, most prominently the components of a triplet at 1291–1350 Å. Some of the unidentified lines could therefore stem from this ion.
4.4 Silicon
The Si vii lines were identified in the FUSE spectrum of KPD 0005+5106, and Si = (twice solar) was derived (Wassermann et al. 2010). Lines from this ion are also detectable in the STIS spectrum, e.g., at 1167.8 and 1169.3 Å, the two strongest components of a triplet (Fig. 1). A singlet at 1236.0 Å (Kentucky database wavelength with uncertainty of 0.65 Å) is visible in the HST/GHRS data and was already assigned to Si vii (but not fit) by Wassermann et al. (2010). It is odd that the line profile observed in the STIS data is much broader and weaker than in the GHRS data (top inset in Fig. 3) and the computed profile. Si lines from adjacent ionization stages were not found in the FUSE spectrum, which was only compatible with a 200 000 K model. The same holds for the STIS data. The 180 000 K model shows prominent Si vi lines, while the 220 000 K model exhibits Si viii lines, while both ionization stages are not detectable in the observation (Fig. 3). With the quoted Si abundance, our model gives lines that are too strong: see the Si vii triplet displayed in Fig. 1. A good fit is obtained with Si = .
4.5 Sulfur
Lines of S vi and S vii were found in the FUSE spectrum (Wassermann et al. 2010). No sulfur lines can be identified in the STIS spectra, in accordance with our model predictions.
4.6 Calcium
Two Ca x emission lines of the 4p–4d doublet at 1136.5 and 1159.2 Å were discovered in the FUSE spectrum (Werner et al. 2008). The latter is covered by our STIS spectrum, but it cannot be identified because of the low S/N in this region. In that paper, two absorption lines at 1461.2 and 1503.6 Å in the IUE spectrum of the hot PG 1159 star NGC 246 were tentatively identified as the 4s–4p doublet. No features are seen in the STIS spectrum of KPD 0005+5106 at these wavelengths.
In the range of 170 000–220 000 K covered by our models, the Ca x 4s–4p lines become weaker with increasing temperature. At solar Ca abundance (Ca = ), the lines become undetectable at = 200 000 K, confirming the solar abundance value derived from the 4p–4d doublet by Werner et al. (2008), while models with the about four times higher value derived by Wassermann et al. (2010) predict lines strong enough to be detectable. The model with = 180 000 K and solar Ca abundance predicts detectable lines so that at this temperature only a one-third solar Ca abundance would explain the observation.
4.7 Iron
4.8 Unidentified lines
As mentioned, some of the unidentified lines probably stem from Ne vii and Mg vii. We checked the line lists cited above for other possible candidates but found no plausible identifications. For our search we looked for lines from light metals heavier than CNO in ionization stages vi–xi and wavelengths known with an accuracy of at least about 0.5 Å and – if available – high values.

5 Summary and discussion
The analysis of the metal lines in the new HST spectra of KPD 0005+5106 confirms the result of Wassermann et al. (2010), who found = K. Our investigation of the ionization balances of neon and silicon yields a compatible result with a slightly smaller error, namely = K. Therefore, the metal abundances determined by Wassermann et al. (2010) are confirmed with the exception of neon and silicon, which we improved, and an upper limit for Mg was determined. The element abundances are summarized in Table and displayed in Fig. 7, together with results for RCB and EHe stars (from Jeffery et al. 2011, and references therein)121212Numerical differences between abundances of RCB and EHe stars in our figure and the respective Fig. 1 in Jeffery et al. (2011) stem from our using different values for the solar element abundances, i.e., Asplund et al. (2009) instead of Anders & Grevesse (1989).. Typical errors are about 0.5 dex for KPD 0005+5106 and 0.3 dex for the RCB and EHe stars. It is obvious that the metal abundances in KPD 0005+5106 are very similar to RCB and EHe stars.
Currently, ten objects were assigned to the group of O(He) stars (Reindl et al. 2014; Werner et al. 2014; De Marco et al. 2015). They cover a parameter range of = 80 000 K – 195 000 K and = 5.0 – 6.7. (KPD 0005+5106 is the hottest member and, together with the central star of the planetary nebula Pa 5, has the highest gravity.) Reindl et al. (2014) noticed that they fall into three subgroups: C-rich, N-rich, and C+N-rich. It was argued that this can be explained by different scenarios within a He-WD + He-WD merger (so-called fast-merger, slow-merger, and composite merger) for which abundance predictions were made by evolution model calculations by Zhang & Jeffery (2012a, b) to show that RCB stars and helium-rich subdwarf O stars could be formed by a binary He-WD merger. Only two O(He) stars fall into the latter group: SDSS J172854.34361958.62 (henceforth SDSS J1728; Werner et al. 2014) and KPD 0005+5106, leading Reindl et al. (2014) to conclude that they are the result of a double He-WD composite merger that descended from an RCB star. With = 100 000 K and = 5.0, SDSS J1728 is located halfway between the RCB stars and KPD 0005+5106 in the Hertzsprung Russell Diagram.
However, based on arguments from binary population synthesis, only 1% of the RCB stars may form from double He-WDs, and the majority forms from a He-WD + CO-WD merger (see Zhang et al. 2014, and references therein). In the cited work, it is demonstrated that post-merger evolution calculations predict surface abundances that can partially explain the observations in RCB stars, in particular for the elements studied in KPD 0005+5106 in the present paper. A comparison of the results for KPD 0005+5106 confirms earlier suggestions (Rauch et al. 2008; Wassermann et al. 2010) that KPD 0005+5106 is indeed an evolved RCB star. The calculations of Zhang et al. (2014) show that the observed C abundance in RCB stars can only be produced by CO WDs in a very narrow mass range ( M⊙) merging with a He-WD with a mass in the range 0.3–0.45 M⊙. The total mass should therefore be in the range 0.85–1.1 , which is similar to observed masses of RCB stars, deduced from the luminosity and evolution calculations (0.8–1.0 M⊙). The masses of the two C+N-rich O(He) stars are M⊙ and M⊙ for KPD 0005+5106 and SDSS J1728, respectively. While the mass of SDSS J1728 is relatively high, that of KPD 0005+5106 appears too low, suggesting its origin is either one of the rare He+He WD mergers or a He+CO WD merger where the He-WD had a significantly lower mass than the lower 0.3 M⊙ limit postulated by Zhang et al. (2014). But we do note that the masses of the two stars were derived with VLTP post-AGB tracks, while post-merger tracks yield masses that are systematically higher by about 0.1–0.2 M⊙ (Reindl et al. 2014).
In the context of the O(He) stars it is also worth emphasizing the finding by Zhang et al. (2014) that CO+He WD mergers may also result in stars that are not carbon rich. Thus one could conceive that many more of the O(He) stars are the result of such mergers and not of He+He WD mergers, although their masses appear too low.
To conclude, we confirm the general picture of hot helium-dominated pre-white dwarfs as the result of binary WD mergers; however, the detailed nature of the original binary systems remains unclear.
Acknowledgements.
T. Rauch had been supported by the German Aerospace Center (DLR) under grant 05 OR 1301. This research made use of the SIMBAD database, operated at the CDS, Strasbourg, France, and of NASA’s Astrophysics Data System Bibliographic Services. Some of the data presented in this paper were obtained from the Mikulski Archive for Space Telescopes (MAST). This work used the profile fitting procedure Owens developed by M. Lemoine and the FUSE French Team.References
- Anders & Grevesse (1989) Anders, E. & Grevesse, N. 1989, Geochim. Cosmochim. Acta., 53, 197
- Asplund et al. (2009) Asplund, M., Grevesse, N., Sauval, A. J., & Scott, P. 2009, ARA&A, 47, 481
- Bashkin & Stoner (1975) Bashkin, S. & Stoner, J. O. 1975, Atomic energy levels and Grotrian Diagrams - Vol.1: Hydrogen I - Phosphorus XV; Vol.2: Sulfur I - Titanium XXII
- Clayton (1996) Clayton, G. C. 1996, PASP, 108, 225
- Clayton et al. (2007) Clayton, G. C., Geballe, T. R., Herwig, F., Fryer, C., & Asplund, M. 2007, ApJ, 662, 1220
- De Marco et al. (2015) De Marco, O., Long, J., Jacoby, G. H., et al. 2015, MNRAS, 448, 3587
- Dere et al. (1997) Dere, K. P., Landi, E., Mason, H. E., Monsignori Fossi, B. C., & Young, P. R. 1997, A&AS, 125, 149
- Downes et al. (1987) Downes, R. A., Sion, E. M., Liebert, J., & Holberg, J. B. 1987, ApJ, 321, 943
- Hébrard et al. (2002) Hébrard, G., Friedman, S. D., Kruk, J. W., et al. 2002, Planet. Space Sci., 50, 1169
- Hébrard & Moos (2003) Hébrard, G. & Moos, H. W. 2003, ApJ, 599, 297
- Herwig et al. (1999) Herwig, F., Blöcker, T., Langer, N., & Driebe, T. 1999, A&A, 349, L5
- Iben (1995) Iben, Jr., I. 1995, Phys. Rep, 250, 2
- Iben et al. (1983) Iben, Jr., I., Kaler, J. B., Truran, J. W., & Renzini, A. 1983, ApJ, 264, 605
- Jeffery et al. (2011) Jeffery, C. S., Karakas, A. I., & Saio, H. 2011, MNRAS, 414, 3599
- Kruk & Werner (1998) Kruk, J. W. & Werner, K. 1998, ApJ, 502, 858
- Landi et al. (2013) Landi, E., Young, P. R., Dere, K. P., Del Zanna, G., & Mason, H. E. 2013, ApJ, 763, 86
- Mendez (1991) Mendez, R. H. 1991, in IAU Symposium, Vol. 145, Evolution of Stars: the Photospheric Abundance Connection, ed. G. Michaud & A. V. Tutukov, 375
- Pandey et al. (2006) Pandey, G., Lambert, D. L., Jeffery, C. S., & Rao, N. K. 2006, ApJ, 638, 454
- Rauch et al. (2008) Rauch, T., Reiff, E., Werner, K., & Kruk, J. W. 2008, in Astronomical Society of the Pacific Conference Series, Vol. 391, Hydrogen-Deficient Stars, ed. A. Werner & T. Rauch, 135
- Reader et al. (2015) Reader, J., Kramida, A., Ralchenko, Y., Wiese, W., & Fuhr, J. 2015, Journal of Physics Conference Series, 576, 012007
- Reindl et al. (2014) Reindl, N., Rauch, T., Werner, K., Kruk, J. W., & Todt, H. 2014, A&A, 566, A116
- Saio & Jeffery (2002) Saio, H. & Jeffery, C. S. 2002, MNRAS, 333, 121
- Seaton et al. (1994) Seaton, M. J., Yan, Y., Mihalas, D., & Pradhan, A. K. 1994, MNRAS, 266, 805
- Sion & Downes (1992) Sion, E. M. & Downes, R. A. 1992, ApJ, 396, L79
- Wassermann et al. (2010) Wassermann, D., Werner, K., Rauch, T., & Kruk, J. W. 2010, A&A, 524, A9
- Webbink (1984) Webbink, R. F. 1984, ApJ, 277, 355
- Werner et al. (2003) Werner, K., Deetjen, J. L., Dreizler, S., et al. 2003, in Astronomical Society of the Pacific Conference Series, Vol. 288, Stellar Atmosphere Modeling, ed. I. Hubeny, D. Mihalas, & K. Werner, 31
- Werner & Dreizler (1999) Werner, K. & Dreizler, S. 1999, Journal of Computational and Applied Mathematics, 109, 65
- Werner et al. (1996) Werner, K., Dreizler, S., Heber, U., et al. 1996, A&A, 307, 860
- Werner et al. (2012) Werner, K., Dreizler, S., & Rauch, T. 2012, TMAP: Tübingen NLTE Model-Atmosphere Package, Astrophysics Source Code Library
- Werner et al. (1994) Werner, K., Heber, U., & Fleming, T. 1994, A&A, 284, 907
- Werner & Herwig (2006) Werner, K. & Herwig, F. 2006, PASP, 118, 183
- Werner et al. (2014) Werner, K., Rauch, T., & Kepler, S. O. 2014, A&A, 564, A53
- Werner et al. (2007) Werner, K., Rauch, T., & Kruk, J. W. 2007, A&A, 474, 591
- Werner et al. (2008) Werner, K., Rauch, T., & Kruk, J. W. 2008, A&A, 492, L43
- Werner et al. (2011) Werner, K., Rauch, T., Kruk, J. W., & Kurucz, R. L. 2011, A&A, 531, A146
- Zhang & Jeffery (2012a) Zhang, X. & Jeffery, C. S. 2012a, MNRAS, 426, L81
- Zhang & Jeffery (2012b) Zhang, X. & Jeffery, C. S. 2012b, MNRAS, 419, 452
- Zhang et al. (2014) Zhang, X., Jeffery, C. S., Chen, X., & Han, Z. 2014, MNRAS, 445, 660