AGN activity and IGM heating in fossil cluster RX J1416.4+2315
Abstract
We study Active Galactic Nucleus (AGN) activity in the fossil galaxy cluster, RX J1416.4+2315. Radio observations were carried out using Giant Metrewave Radio Telescope (GMRT) at two frequencies, 1420 MHz and 610 MHz. A weak radio lobe that extends from the central nucleus is detected in 610 MHz map. Assuming the radio lobe originated from the central AGN, we show the energy injection into the Inter Galactic Medium (IGM) is only sufficient to heat up the central 50 kpc within the cluster core, while the cooling radius is larger ( 130 kpc). In the hardness ratio map, three low energy cavities have been identified. No radio emission is detected for these regions. We evaluated the power required to inflate the cavities and showed that the total energy budget is sufficient to offset the radiative cooling. We showed that the initial conditions would change the results remarkably. Furthermore, efficiency of Bondi accretion to power the AGN has been estimated.
1 Introduction
The Inter Galactic Medium (IGM) heating is one of the challenging issues of observational cosmology. Many galaxy groups and clusters have been found to contain hot intergalactic gas, most of which have cooling timescales longer than the Hubble time. The cooling time in the core of many galaxy groups and clusters is however, much shorter than the Hubble time. While it was argued that this gas should cool dramatically into very low temperatures (Fabian et al., 1984; Sarazin, 1986; Fabian et al., 1991), challenges were posed by X-ray observations of the XMM-Newton and the Chandra when they found no evidence of a catastrophic cooling suggesting that one or more processes are stopping the gas from cooling below a certain () temperature. (see Peterson & Fabian 2006 and references therein).
Active Galactic Nucleus (AGN) is seen as a primary source of heating mainly because it appears to be present in most of cool core galaxy groups and clusters (Mittal et al., 2009). AGNs interact with the intergalactic gas by sending radio jets, bubbles, shocks and sound waves powered by supermassive black holes (SMBHs) and heat the IGM via different mechanisms (Gaspari et al., 2011). Amongst all the heating sources introduced up to now, bubble structures are the main supporting evidence for the AGN heating (Birzan et al., 2004; Dunn & Fabian, 2004; Dunn et al., 2005; Rafferty et al., 2006; Nulsen et al., 2007; Birzan et al., 2008; Sanders et al., 2009; Dunn et al., 2010; O’Sullivan et al., 2011; Cavagnolo et al., 2010). Radio bubbles release huge amount of energy into the IGM in the form of mechanical work. The energy required to inflate a bubble is roughly erg in low mass systems up to erg in rich clusters. Recent studies of X-ray cavities show that mechanical heating provides sufficient energy to quench cooling rate in most of the cooling flow groups and clusters up to z0.8 (Hlavacek-Larrondo et al., 2012, 2014).
The accretion flow onto the black hole prompt the relativistic jets and lobes into the IGM. There are two modes of accretion into the SMBH that are assumed to contribute to the AGN power. The accretion of cold optically thick gas occurring at high accretion rate and hot optically thin accretion of gas at the low accretion rate (Yuan & Narayan, 2014). The latter is believed to operate radio mode feedback in galaxy clusters and groups. Additionally, galaxy simulations show that merger or instability caused by galaxy interactions excite gas infall and fuel the black hole growth (Springel et al. 2005a, ; Springel et al. 2005b, ). Observational restrictions do not allow us to determine which type of accretion mode is induced by the galaxy mergers since the accretion mode is mainly determined by the boundary condition of the gas at the Bondi radius (Yuan & Narayan, 2014). When the black hole reaches a critical mass, the feedback blows out material from the central region and regulate the black hole growth. A study by Ellison et al. 2011 shows a clear increase in the AGN fraction in close pairs of galaxies. Therefore, merger of galaxies trigger AGN activity and consequently heat the IGM. Moreover, the energy released by a galactic merger ( erg) is enough to disturb cool cores (Markevitch et al., 1999; Gomez et al., 2002; Markevitch & Vikhlinin, 2007; McNamara & Nulsen, 2007). So the heating role of galaxy merger is important to account the heating and cooling balance inside the group.
Galaxy clusters and groups are evolving systems and galactic merger is a built-in process in these systems. However, there is a class of galaxy groups in which major mergers are thought to have taken place in time scales much larger than the return period of the AGN activities. Such galaxy groups are known as fossil groups which are dominated optically by a single luminous elliptical galaxy at the centre of an extended luminous X-ray emission similar to those seen in bright X-ray groups. The X-ray emission in fossils is usually regular and symmetric, indicating the absence of recent group scale merging. Apart from the observational indications pointing at the early formation of fossil galaxy groups (Khosroshahi et al., 2006, 2006, 2007), cosmological simulations also show that fossil groups halos are formed relatively earlier (Dariush et al., 2007, 2010) than the general population of the groups and clusters with a similar halo mass.
Two main advantages of studying AGN feedback in fossil groups are the following. a) The central giant elliptical galaxy have not experienced a recent galactic merger and, given the absence of any bright nearby galaxies, is not subject to any major instability due to interactions with massive surrounding galaxies. b) The cluster itself has not experienced any large scale merger which can disturb the formation of the cool core. Fossils are thus thought to be relatively simple laboratories to study AGN feedback. This study is focused on the radio properties of one of the most massive fossil groups known in the local Universe, RX J1416.4+2315 (hereafter J1416) at . This group contains one of the most massive giant ellipticals known and has been studied as part of a volume limited sample of spatially extended X-ray sources compiled during the WARPS project (Wide Angle ROSAT Pointed Survey; Scharf et al. 1997; Jones et al. 1998; Perlman et al. 2002). It is the most X-ray luminous source in the sample of 5 fossil groups studied by Jones et al. 2003, with a ROSAT estimated X-ray bolometric luminosity of erg s-1. In a deep optical image it would be classified as a galaxy group or poor cluster centred on an extremely dominant, luminous giant elliptical galaxy (Khosroshahi et al., 2006).
In Section 2 we describe the radio observation and
Morphology. X-ray Morphology is presented in Section 3. Estimation of the heat
budget is described in
Section 4. The Synchrotron aging and Black hole accretion are presented in Section 5 and 6 respectively. Summary and discussion
are given in Section 7. Throughout this paper a
cosmology with
, and km
s-1 Mpc-1 where
h=0.71 is assumed.
2 Radio Observation and Morphology
The cluster was imaged in two frequencies, 1420 MHz and 610 MHz, with the Giant Metrewave Radio Telescope (GMRT) to study a possible correlation of the spatial features of the IGM in radio and X-ray. The system temperature, gain (K/Jy) and full width at half maximum of the primary beam of the instrument in 1420 MHz are 76K, 0.22 and 24 ′respectively. The same for 610 MHz are 92K, 0.32 and 54 ′respectively. The source was observed on 4th and 5th July, 2005 for 10 hours in 1420 MHz and on 11th and 12th July for 10 hours in 610 MHz.
The data were reduced using AIPS (Astronomical Image Processing System). Bad data e.g. dead antennas, antennas with significantly lower gain, bad time, were removed and the data was calibrated for flux and phase using 3C286 as a primary calibrator in both frequencies and 1407+284 and 3C287 as secondary calibrators in 1420 MHz and 610 MHz respectively. Imaging was performed using the AIPS task ’IMAGR’. Polyhedron imaging was performed to take care of the well known problem of wide field imaging in low frequencies. Map rms 130 J and 180 J were reached in 1420 MHz and in 610 MHz respectively.
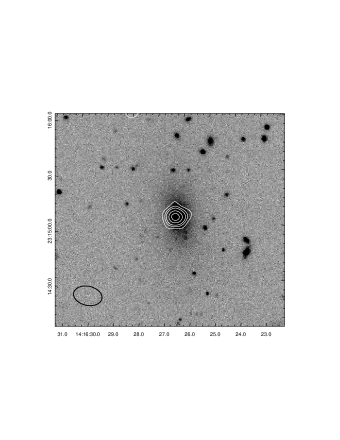
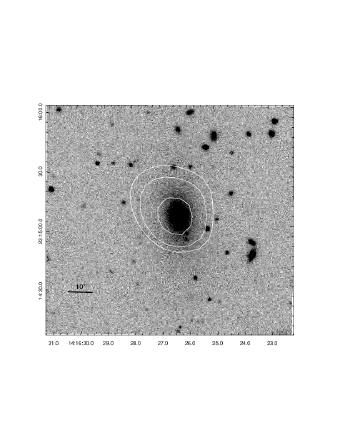
In 1420 MHz, a source was detected at the position of RA: 14h 16m 27.47s and Dec: +230 15 22.40". Peak flux of this source is 2.60 0.13 mJy/beam. This is in agreement with the source from the FIRST catalog detected at the position of RA:14h 16m 27.39s and Dec: +230 15 23.00", with a peak flux of 2.36 0.145 mJy/beam and with the source from the NVSS catalog at the position of RA:14h 16m 29s and Dec: +23015 28", with a peak flux of 3.1 0.5 mJy/beam. High and low resolution images of this source at 1420 MHz have been presented in figures 1 and 3. Details of the maps are given in table 1.
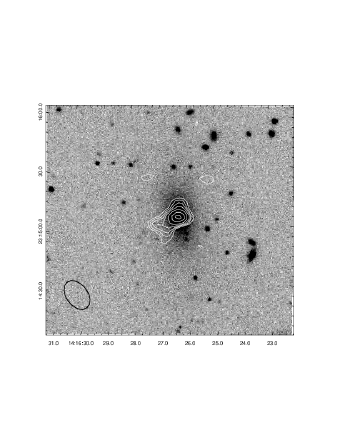
In 610 MHz, two sources were detected in the high resolution image; a peak at the position of RA: 14 16 27.35 Dec: +23 15 22.00 (hereafter central source) and a second peak at RA: 14 16 27.64 Dec: +23 15 18.00 (hereafter the radio counterpart). Peak flux for the central source is 4.29 0.13 mJy/beam and for the radio counterpart is 2.00 0.2 mJy/beam. High and low resolution images of this source at 610 MHz are shown in figures 2 and 4. The nature of the radio counterpart is unclear. There is no point source in the X-ray map associated with this structure. Given the alignment (along minor axis of the central giant elliptical), it can be a remnant from the previous outburst. No counterparts are apparent either on the SDSS image (magnitude limit 17.7 ) or on 2MASS image (point-source limiting magnitude Ks 14.3). Thus in this study, we assume that this source is a radio lobe inflated by the central AGN. Given the 1420 MHz flux, the spectral index () calculated for the central source is 0.83. If the same spectral index is assumed for the radio lobe, the source is expected to have a 3 detection in 1420 MHz image, given that the map rms is 130 Jansky.
The presence of diffused extended emission was checked by subtracting the high resolution integrated flux density of the source from the low resolution image. At 1420 MHz, no residual flux was found, indicating that the emission is dominated by a central compact source. Subtracting FIRST flux density from NVSS flux density also confirms it (Table 2). At 610 MHz, there is 3 mJy residual that indicates the presence of diffused emission.
3 X-ray Morphology
X-ray data analysis of J1416 has been reported in Khosroshahi et al. 2006. We used the results of Chandra and XMM-Newton observations in this study. Throughout the paper, X-ray luminosities have been estimated by integrating over the surface brightness profile. A two-dimensional -model fit to the Chandra data has been used for this aim. In order to obtain the electron density , the deprojected luminosity of 3D shells with the fixed radius was combined with the model emissivity at the shell temperature (and in the same energy band, 0.32.5 keV) and the shell volume V, via
| (1) |
For the hydrogen number density we assumed . The deprojected temperature profile is reported in Khosroshahi et al. 2006. We estimated the pressure using the equation, for the perfect gas, with k being the Boltzmann constant, the mean molecular weight, and the atomic mass constant. For the gas density, we assumed according to Reiprich et al. 2001.
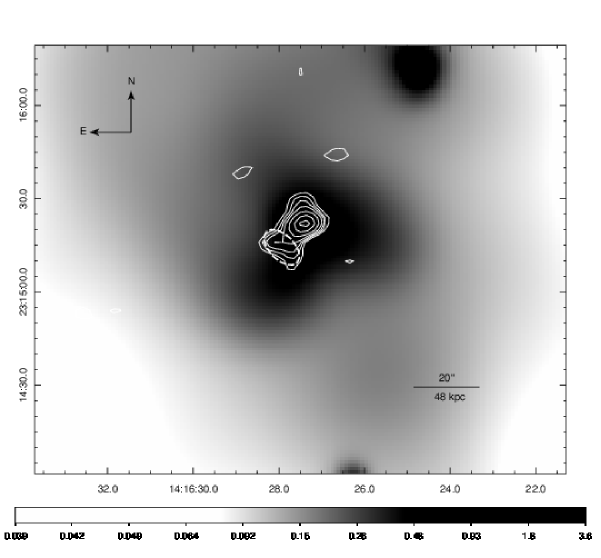
X-ray soft (0.52 keV) diffuse emission from XMM-Newton with 610 MHz radio contours is shown in Fig. 5. The diffuse emission image was produced by adaptively smoothing an exposure-corrected image of the emission detected by the three XMM-Newton EPIC cameras. There is a SW tail in the same direction of the radio lobe. Compared to the X-ray emission at the same radius, the tail is 40 percent brighter with 6 significance level.
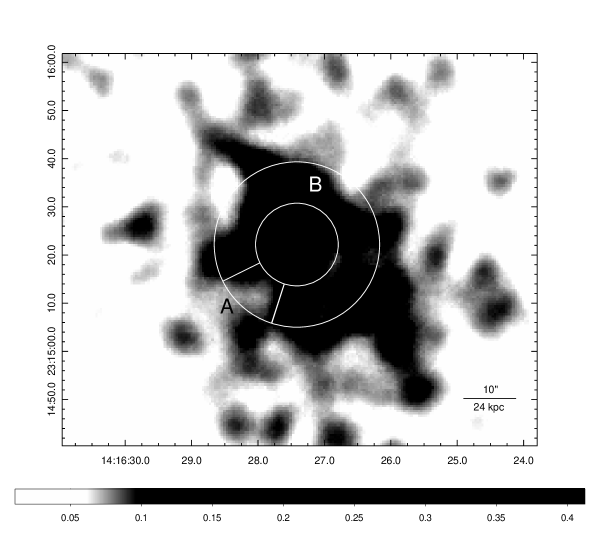
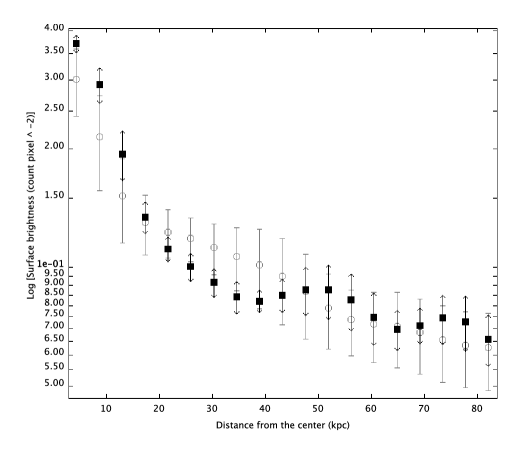
Soft diffuse Chandra image (0.3-2.0 keV) is shown in Fig. 6. The point sources are removed and the emission has been smoothed with a two-dimensional Gaussian function, pixels ( 5 kernel radius). The image shows a depression in surface brightness map in the direction of the radio lobe. To assess the significance of this cavity, we averaged count per pixel over the cavity surface (marked as A) and the regions of the same radius from the center (marked as B). The mean value for the cavity is 0.0850.009 (counts per pixel) comparing to 0.1120.022 (counts per pixel) for the region B. The surface brightness depression is weaker than the noise level in X-ray map. Thus the reliablity of the depresstion can not be investigated with the current X-ray data. Fig.7 shows the surface brightness profile of the entire cluster (open circle) and through the direction of radio lobe (filled square). The bin size has been adjusted to the resolution of the X-ray image. Y axis represents the mean of surface brightness in each bin with the standard deviation of each bin for the error bar. A small depression around 30 kpc is again uncertain due to the huge error bars.
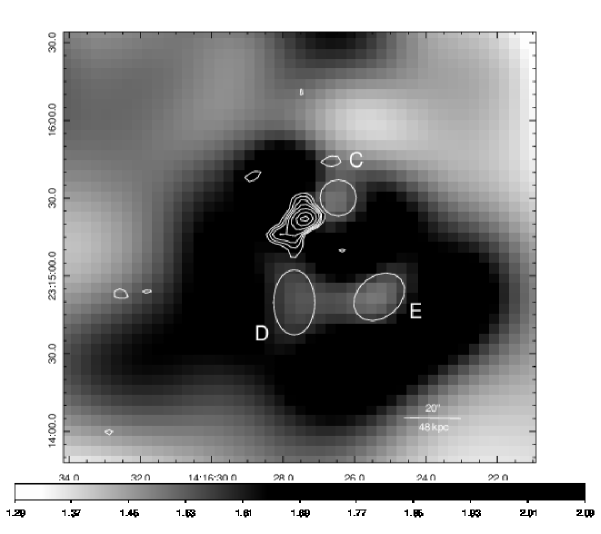
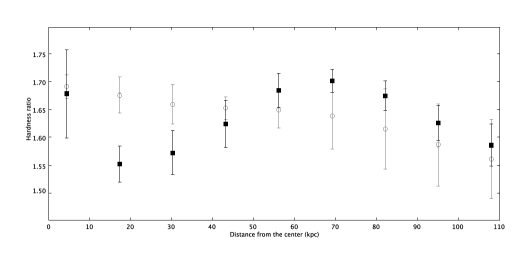
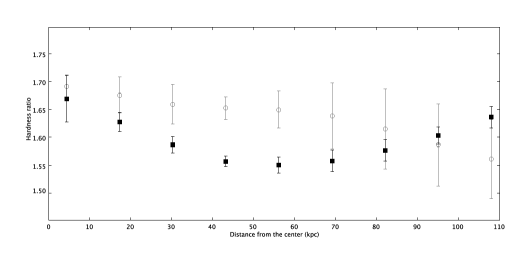
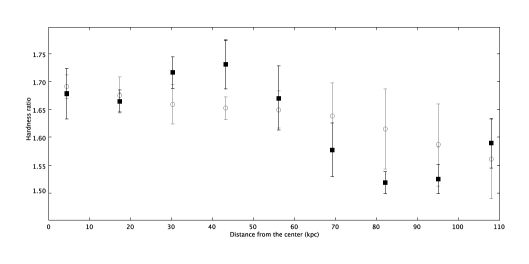
The hardness ratio map is shown in Fig. 8. The soft image contains photons with energies from 400 eV to 900 e V. The hard image consists of photons with energy ranging from 900 eV to 2 keV. Before deriving the hardness ratio map, we replaced the point sources by their surrounding counts and applied smoothing on the hard and soft band with the scale of 8 8 binned image using the csmooth task in CIAO. The corresponding backgrounds were subtracted from the soft and hard images. The bubble like low energy cavities are seen in the south (marked as D and E) and north west (marked as C). In order to explore the reliably of these cavities, we compared the hardness ratio inside these regions with their surroundings by averaging count per pixel in each cavity and an annulus around it (not shown in Fig. 8 to prevent confusion). The level of deficiency of the cavities are presented in table 3 and show that surface brightness depressions are real in all cases. Figs 9-11 show hardness ratio profile of the entire cluster (open circle) and through the direction of the cavities C, D and E, showing clear depressions around 20 kpc, 50 kpc and 80 kpc respectively. The bin size and the error bars are the same as Fig. 7. The cavities are possibly due to multiple cycle of AGN outflows. However, no radio emission is detected in any of these regions.
4 AGN Heating
X-ray observations of clusters and groups of galaxies reveal that most of the cooling flow clusters and groups have cavities defined by depression in their X-ray surface brightness. These cavities are filled with radio bubbles, consist of relativistic particles and magnetic fields, when they observed at low frequencies. Such observations are consistent with the current scenario in which AGN activity at the centre of clusters and groups inflates the bubbles into the IGM, fed by powerful radio jets. A large number of studies suggest that AGN as a prominent source of heating can quench cooling rates through various processes (Fabian et al., 2006; Heinz et al., 2006; McNamara & Nulsen, 2007; Blanton et al., 2010). P dV work by the inflated bubbles on the surrendering can be a lower limit in the heat supply (Churazov et al., 2002; Nusser et al., 2006; Begelman, 2001). Other mechanisms will boost the heating and possibly explain the lack of cool gas in the clusters core.
From the cavity enthalpy we have
| (2) |
In which we assumed the perfect gas relation for the internal energy of the cavity:
| (3) |
Here, is the adiabatic index for the relativistic particles. In this study, we assume that the radio bubble is formed near the centre of the group with over pressure factor of (where is the initial pressure of the bubble and is the ambient pressure and also the bubble final pressure, assuming the bubble pressure reaches the ambient pressure in the last stage of expansion) and then moves to the observed position with the pressure and the volume P and V. The enthalpy change of the bubble during this process is given by
| (4) |
This is based on adiabatic assumption PVγ=const and is consistent with rapid expansion of the bubble.
Observation of J1416 in 610 MHz detected a radio source at the south-east of the cluster center but no such emission was detected at this position in 1420 MHz. The distance between the position of the peak flux density of the central source and the radio lobe is approximately 28 kpc. Absence of detection any radio lobe in 1420 MHz shows that this source has steep spectrum up to , comparing to the central radio emission (). Steepening of about 0.5 is expected at high frequency as a result of synchrotron ageing (Feretti & Giovannini, 2008). Further discussion is presented in Section 5.
The spatial resolution of the XMM-Newton is barely sufficient for detecting any X-ray cavity at this distance from the central X-ray point source. Chandra X-ray telescope which has a much better spatial resolution shows a weak deficiency in the X-ray surface brightness associated with the radio lobe (Figs 6 and 7). The binning and smoothing is minimal to enable us to see small scale surface brightness variations in this map. As we discussed in Section 3, the depression is not reliable due to the huge error bars. Thus, we used radio data to evaluate bubble dimensions.
Here, we estimate the energy required to inflate the radio lobe (bubble heating) using the equation 4 and discuss the heating and cooling balance at the center of this cluster. The bubble has approximately an elliptical shape with semi-major axis of 16 kpc and semi-minor axis of 9 kpc (shown in Fig. 5). The extent of the source is calculated by fitting a Gaussian function to the image using the AIPS task JMFIT. We assume a mean radius of r= for the bubble where and are semi-minor and semi-major axis of the ellipse respectively. The ambient pressure is dyn cm-2 at the 28 kpc radius from the center (the current position of the radio bubble). The enthalpy change is assuming the overpressure factor of 2 and for the overpressure factor of 10. Dividing the enthalpy changes by the time of releasing this energy we reach the bubble luminosity. Using three estimates for the time introduced by Bîrzan et al. 2004, we evaluated heating luminosities listed in table 4. The sound crossing time, is the time for the bubble to move to the current place with the sound speed in the group core. The buoyant rise time, is the time which bubble moves out buoyantly and the refill time, that is the time taken to refill the volume displaced by the bubble during the movement. Here, R is the distance between galaxy center and radio lobe. V and S are the volume and cross section of the bubble respectively. C is the drag coefficient. We assumed C=0.75 (Churazov et al. 2001). g is gravitational acceleration that is approximated by the relation where is the velocity dispersion of the galaxy group ( 694 km s-1). r is the mean radius of the bubble which we discussed earlier.
The X-ray study of J1416 (Khosroshahi et al., 2006) shows that the gas within 130 kpc have cooling time shorter than the Hubble time while there is only a small temperature drop in the core of galaxy group (r 50 kpc) where the cooling time is 5 Gyr. The energy loss by X-ray emission is erg s-1 within 50 kpc and erg s-1 within 130 kpc. The mechanical luminosity of the radio lobe is , assuming overpressure factor of 2 and for the overpressure factors of 10 ( Table 4). Thus, the estimated mechanical heating appears to be only sufficient to heat up the cool core of the group and at higher radius, other sources of heating are also required. The fact that AGN feedback can only touch the inner radius preserves self-similarity in galaxy groups and clusters. A recent study by Gaspari et al. 2014 shows that breaking the self-similar scaling relations destroys cool core in galaxy groups and clusters and changes all systems into non-cool-core objects that is not consistent with X-ray observations.
We note that the highest angular resolution achieved in 610 MHz map is approximately equal to the size of the radio bubble. Since we use the radio bubble size to calculate the volume (equation 3), the estimated mechanical work will be an upper limit for that. For the Bîrzan et al. 2004 sample, the cavities dimensions vary from tens of kpc in massive clusters to few kpc in low mass systems. Thus, our estimate for the bubble size (12 kpc) is consistent with a typical expected size.
The properties of the core can be seen better in the hardness ratio map (Fig. 7) which shows asymmetric distribution of soft and hard regions. The bubble like low energy cavities are marked in the map. There is no detected radio counterpart for these structures possibly due to the synchrotron aging. Future low frequency ( 610 MHz) radio observation of this object with the high sensitivity will discover the nature of these cavities. All the cavities are within 130 kpc (cooling radius) from the cluster center. Assuming they emerge from multiple cycle of AGN outburst, we estimated the mechanical power for each cavity listed in table 3. The sound crossing time, the cluster pressure at the position of the cavity and over pressure factor of 10 (the maximum mechanical work) have been used to estimate the power. The total energy content of the cavities (A, C, D and E) is erg corresponds to the total mechanical luminosity of . Therefore, the heating power is completely sufficient to quench cooling rate within 130 kpc in the cluster core. By changing the initial conditions of inflated bubble and applying overpressure factor of 2 (the minimum mechanical work), the heating power is hardly sufficient to stop the gas from cooling, . We will discuss it in section 7.
In addition to the mechanical heating of the radio lobe, dissipation of shock waves and sound waves produced by AGN outbursts is another source of heating (McNamara & Nulsen, 2007). This is illustrated by cavities, weak shocks and filamentary structures produced by series of AGN outbursts in X-ray image of M87 Galaxy (Forman et al., 2007). For J1416, both Chandra and XMM-Newton in soft band (0.5-2.0 kev) show relatively smooth emission except at the core where an X-ray extension appears in the south-east and the same direction of the radio bubble in the XMM-Newton map (Fig. 5). It is probable that this structure is related to the AGN outburst or the result of low resolution and high smoothing of XMM-Newton map. Any firm conclusion about the existence of weak shock will require a higher quality of X-ray data.
Observations of a large sample of clusters and groups have helped to deduce a correlation between the radio luminosity and the jet power. Bîrzan et al. 2004 studied a sample of galaxy clusters and groups with clear X-ray cavities and derived a relation between cavity power and total radio luminosity, showing that the is approximately proportional to the but radio luminosity is on average, smaller by a factor of 100.
We use radio flux density of the central source at the frequency to evaluate the total radio luminosity with the assumption of power low spectrum between and and the spectral index of . Using the relation
| (5) |
we approximate the total radio luminosity to be erg s-1. The corresponding mechanical luminosity according to Bîrzan et al. 2004 relation is erg s-1, consistent with our results in Table 4.
5 Synchrotron ages and the magnetic field
Assuming that the radio lobe is in pressure balance with the environment, the gas pressure estimated from the X-ray observation should be equal to the lobe internal pressure. The radio lobe pressure is the sum of particles and magnetic field pressure and is evaluated using the bolometric radio luminosity of the lobe.
| (6) |
Here, is the gas thermal pressure. is the coefficient that relates the energy of positive particles to the energy of electrons. is the filling factor of magnetic field. is a function of emitting first and last frequencies and spectral index, introduced by Pacholczyk 1970. We assume the radio lobe consists of relativistic electrons and positrons , with a filling factor of . The applied minimum and maximum cut off for frequencies are and . Following this method, we found two solutions for the magnetic field of the lobe, and . seems to be too small according to the magnetic field strength in radio lobes (Stawartz et al., 2006). Thus, we adopted that shows magnetic pressure is dominated inside the radio lobe.
Unlike the radio emission at 610 MHz, there is no radio lobe in 1420 MHz map. Assuming the same spectral index for the central source and the radio lobe, the emission of the radio lobe at 1420 MHz would be larger than 3 of the map. Thus, there are two possibilities for explaining the lack of radio lobe detection at high frequency. Firstly, difference in electron energy distribution of the lobe and the central source causes a steeper spectral index for the radio lobe. secondly, the steepening emerges from synchrotron ageing. The former is not probable, since both of the radio emissions have been originated from the central AGN while the latter is a common phonamonon observed in radio lobes. The energy of the synchrotron electrons in the plasma decreases with time because of their emission. This phenomenon defines a critical time () in which particles lose most of their energies, and produces a break at the synchrotron spectrum for the frequencies beyond the critical frequencies (). The break frequency () is related to the synchrotron age via the relation
| (7) |
Here, B is in . is in GHz and is the equivalent Cosmic Microwave Background magnetic field. The electron energy also losses due to the inverse Compton scattering of CMB photons (see Feretti & Giovannini 2008 for details). The absence of any radio lobe at 1420 MHz indicates a spectrum break below this frequency, resulting . This is consistent with the three estimated age for the bubble in Section 4.
6 Accretion and blackhole growth
In addition to the energetic considerations around heating and cooling balance at the core of galaxy groups and clusters, the energetic balance of AGN feeding and feedback is required to complete the cycle of galaxy formation and growth. The SMBH accretion by the hot or cold gas are widely discussed in the literature (Pizzolato & Soker, 2005; McNamara et al., 2011; Gaspari et al., 2013; Yuan & Narayan, 2014). The rotational energy of a rapidly spinning black hole can also power AGN activity (McNamara et al., 2009). In this section, we approximate Bondi accretion (Bondi, 1952), a spherical symmetric accretion of hot gas into the central black hole, as a fueling way to know whether or not it is sufficient to feed the central black hole. The correlation of Bondi accretion and jet power has been shown in the previous studies (Rafferty et al., 2006; Allen et al., 2006).
The accretion rate is related to the temperature, density and the central black hole mass via the relation:
| (8) |
we evaluate black hole mass using the correlation between the black hole mass and luminosity (Marconi & Hunt, 2003):
| (9) |
The estimated black hole mass is . Using the core density cm-3 and temperature keV, we found the accretion rate of M , corresponding to the Bondi accretion of erg s-1. In this estimation, we assumed an efficiency factor of for the accretion. The calculated Bondi accretion power is an order of magnitude lower than the jet power (section 4). Note that the accretion happens within Bondi radius. For a black hole mass and accreting gas temperature T, Bondi radius is:
| (10) |
In J1416 galaxy cluster, this radius is 0.02 kpc. Spatial resolution of X-ray data do not allow us to resolve this region. Therefore, the true Bondi power must be higher than this value. Rafferty et al. 2006 discussed this correction and showed that having a bigger gap between Bondi radius and the radius which Bondi power have been estimated within, we observe higher cavity-Bondi power ratio. In order to correct this effect, they assumed a power law density profile and predict the Bondi accretion rate. Applying this correction for J1416 shows that cavity power is consistent with Bondi power.
7 Summary and discussion
We carried out radio observations of RX J1416.4+2315, a massive fossil galaxy group, to study AGN activity and IGM heating in this object. Fossil groups are thought to be ideal environment to study IGM heating since they show no sign of group scale mergers or major mergers of the dominant galaxy. The radio observations were performed using GMRT radio array at 610 MHz and 1420 MHz.
The radio emission of the central BCG is detected at both frequencies, showing spectral index of 0.83. In 610 MHz, a radio lobe is detected in the SE of the central source. We evaluate mechanical work that is done by the radio bubble on the IGM. If the bubble blows with small overpressure (=2), the heating power will be erg s-1 which is sufficient to quench the cooling within 50 kpc radius. The temperature profile of J1416 shows a slight drop in this region. Assuming that the bubble initial pressure is so high (=10), the heat supply will be erg s-1. The total heating power that is required to completely stop cooling within the cooling radius (130 kpc) is erg s-1. Thus, the PV work is not sufficient for the entire cooling flow region. In addition to that, x-ray hardness ratio map show three clear cavities within the cooling radius. They might be the results of previous AGN outbursts. By taking into account all sources, the heating power will be , that is quite sufficient to offset cooling flow.
We estimate Bondi accretion rate of erg s-1 for this system. The accretion power is significantly smaller than the jet power but such a difference emerges from the poor X-ray resolution. Applying the correction for the Bondi radius, we showed that Bondi accretion and jet power are consistent.
We note that there are uncertainties in estimating the mechanical heating for the various reasons.
- The energetic content of the radio lobe is a function of adiabatic index (Eq. 3), depends on whether the bubble is filled with relativistic or non-relativistic plasma.
- Large uncertainty in evaluating the heating power is clear due to the method we used. Total enthalpy and enthalpy changes are used for this aim. Nusser et al. 2006 calculated the heating rate by introducing three phases of injected bubble, buoyant bubble, and destroyed bubble. They derived precise relations while applying the observable parameters into the deduced relations is not possible because of the low resolution of the X-ray data. Moreover, assumptions for the initial conditions e.g bubble overpressure factor change the results by an order of magnitude.
- Uncertainty in the definition of cooling radius based on the cooling time, temperature drop or significant classical mass deposition rate for estimating the X-ray loss results huge difference in the estimated cooling power.
References
- Allen et al. (2006) Allen S. W., Dunn R. J. H.,Fabian A. C., Taylor G. B., ReynoldsC. S., 2006, MNRAS, 372, 21
- Birzan et al. (2008) Bîrzan L., McNamara B. R., Nulsen P. E. J., Carilli C. L., Wise M. W., 2008, ApJ, 686, 859
- Birzan et al. (2004) Bîrzan L., Rafferty D. A., McNamara B. R., Wise M. W., Nulsen P. E. J., 2004, ApJ, 607, 800
- Baldi et al. (2009) Baldi A., Forman W., Jones C., Nulsen P., David L., Kraft R., Simionescu A., 2009, ApJ, 694, 479
- Begelman (2001) Begelman M. C., in Astronomical Society of the Pacific Conference Series, Vol. 240, Gas and Galaxy Evolution, ed. J. E. Hibbard, M. Rupen, J. H. van Gorkom, 363
- Blanton et al. (2010) Blanton E. L., Clarke T. E., Sarazin C. L., Randall S. W., McNamara B. R., 2010, Publ. of the Natl. Acad. of Sci., 107, 7174
- Blanton et al. (2009) Blanton E. L., Randall S. W., Douglass E. M., Sarazin C. L., Clarke T. E., McNamara B. R., 2009, ApJ, 697, 95
- Bondi (1952) Bondi H., 1952, MNRAS, 112, 195
- Bregman & David (1988) Bregman J. N., David L. P., 1988, ApJ, 326, 639
- Cavagnolo et al. (2010) Cavagnolo K. W., McNamara B. R., Nulsen P. E. J., Carilli C. L.,Jones C., Bîrzan L., ApJ, 720, 1066
- Churazov et al. (2002) Churazov E., Sunyaev R., Forman W., Böhringer H., 2002, MNRAS, 332, 729
- Clarke et al. (2009) Clarke T. E., Blanton E. L., Sarazin C. L., Anderson L. D., Gopal-Krishna, Douglass E. M., Kassim N. E., 2009, ApJ, 697, 1481
- Dariush et al. (2007) Dariush A. A., Khosroshahi H. G., Ponman T. J., Pearce F., Raychaudhury S., Hartly W., 2007, MNRAS, 382, 433
- Dariush et al. (2010) Dariush A. A., Raychaudhury S., Ponman T. J., Khosroshahi H. G.,Benson A. J., Bower R. G., Pearce F., 2010, MNRAS, 405, 1873
- Dunn et al. (2010) Dunn R. J. H., Allen S. W., Taylor G. B., Shurkin K. F., GentileG., Fabian A. C., Reynolds C. S.,MNRAS, 404, 180
- Dunn & Fabian (2004) Dunn R. J. H., Fabian A. C., 2004, MNRAS, 355, 862
- Dunn et al. (2005) Dunn R. J. H., Fabian A. C., Taylor G. B., 2005, MNRAS, 364, 1343
- Eilek & Weatherall (1999) Eilek J., Weatherall J. C., 1999, in Diffuse thermal and relativistic plasma in galaxy clusters, ed. H. Böhringer, L. Feretti, P. Schuecker., ( Garching: MPE Rept. 271 ), 249
- Ellison et al. (2011) Ellison S. L., Patton D. R., Mendel J. T., Scudder J. M., 2011, MNRAS, 418, 2043
- Ettori & Fabian (2000) Ettori S., Fabian A. C., 2000, MNRASLetters, 317, 57
- Fabian et al. (1984) Fabian A. C., Nulsen P. E. J., Canizares C. R., 1984, Nature , 310, 733
- Fabian et al. (1991) Fabian A. C., Nulsen P. E. J., Canizares C. R., 1991, Astronomy and Astrophysics Review , 2, 191
- Fabian et al. (2006) Fabian A. C., Sanders J. S., Taylor G. B., Allen S. W., CrawfordC. S., Johnstone R. M., Iwasawa K., MNRAS, 366, 417
- Feretti & Giovannini (2008) Feretti L., Giovannini G., 2008 in A Pan-Chromatic View of Clusters of Galaxies and the Large-Scale Structure, ed. M. Plionis, O. López-Cruz, D. Hughes, Lect. Notes Phys., 740, 143 (Springer)
- Forman et al. (2007) Forman W., Jones C., Churazov E., Markevitch M., Nulsen P., Vikhlinin A., Begelman M., Böhringer H., Eilek J., Heinz S., Kraft R., Owen, F., Pahre M., 2007, ApJ, 665, 1057
- Gaspari et al. (2014) Gaspari M., Brighenti F., Temi P., Ettori S., 2014, ApJL, 783, L10
- Gaspari et al. (2013) Gaspari M., Ruszkowski M., Oh S. P., 2013, MNRAS, 432, 3401
- Gaspari et al. (2012) Gaspari M., Brighenti F., Temi P., 2012, MNRAS, 424, 190
- Gaspari et al. (2011) Gaspari M., Brighenti F., D’Ercole A., Melioli C., 2011, MNRAS, 415, 1549
- Gomez et al. (2002) Gómez P. L., Loken C., Roettiger K., Burns J. O, 2002, ApJ, 569, 122
- Heinz et al. (2006) Heinz S., Brüggen M., Young A., Levesque E., 2006, MNRASLetters, 373, 65
- Hlavacek-Larrondo et al. (2012) Hlavacek-Larrondo J., Fabian A. C., Edge A. C., Ebeling H., Sanders J. S., Hogan M. T., Taylor G. B., 2012, MNRAS, 421, 1360
- Hlavacek-Larrondo et al. (2014) Hlavacek-Larrondo J., McDonald M., Benson B. A., Forman W. R., Allen S. W., Bleem L. E., Ashby M. L. N., Bocquet S., Brodwin M., Dietrich J. P., Jones C., Liu J., Saliwanchik B. R., Saro A., Schrabback T., Song J., Stalder B., Vikhlinin A., Zenteno A., 2014, Submitted for publication in ApJ
- Jones et al. (2003) Jones L. R., Ponman T. J., Horton A., Babul A., Ebeling H., Burke D. J., 2003, MNRAS, 343, 627
- Jones et al. (1998) Jones L. R., Scharf C., Ebeling H., Perlman E., Wegner G., Malkan M., Horner D., 1998, ApJ, 495, 100
- Khosroshahi et al. (2006) Khosroshahi H. G., Maughan B., Ponman T. J., and Jones L. R., 2006, MNRAS, 369, 1211
- Khosroshahi et al. (2006) Khosroshahi H. G., Ponman T. J., and Jones L. R., 2006, MNRASLetters, 372, 68
- Khosroshahi et al. (2007) Khosroshahi H. G., Ponman T. J., and Jones L. R., 2007, MNRAS, 377, 595
- Kim & Narayan (2003) Kim W.-T., Narayan R., 2003, ApJ, 596, 889
- Marconi & Hunt (2003) Marconi A., Hunt L. K., 2003, ApJ, 589, 21
- Markevitch et al. (1999) Markevitch M., Sarazin C. L., Vikhlinin A., 1999, ApJ, 521, 526
- Markevitch & Vikhlinin (2007) Markevitch M., Vikhlinin A., 2007, PhR, 443, 1
- McNamara & Nulsen (2007) McNamara B. R., Nulsen P. E. J., 2007, ARA&A, 45, 117
- McNamara et al. (2009) McNamara B. R., Kazemzadeh F., Rafferty D. A., Bîrzan L., Nulsen P. E. J., Kirkpatrick C. C., Wise M. W., 2009, ApJ, 698, 594
- McNamara et al. (2011) McNamara B. R., Rohanizadegan M., Nulsen P. E. J., 2011, ApJ, 727, 39
- Million et al. (2010) Million E. T., Werner N., Simionescu A., Allen S. W., Nulsen P. E. J., Fabian A. C., Böhringer H., Sanders J. S., 2010, MNRAS, 407, 2046
- Mittal et al. (2009) Mittal R., Hudson D. S., Reiprich T. H., Clarke T., 2009, A&A, 501, 835
- Narayan & Medvedev (2001) Narayan R., Medvedev M. V., 2001, ApJ, 562, 129
- Nulsen et al. (2007) Nulsen P. E. J., Jones C., Forman W. R., David L. P., McNamara B. R., Rafferty D. A., Bîrzan L., Wise M. W., 2007, in Heating versus Cooling in Galaxies and Clusters of Galaxies, 210
- Nusser et al. (2006) Nusser A., Silk J., Babul A., 2006, MNRAS, 373, 739
- O’Sullivan et al. (2011) O’Sullivan E., Giacintucci S., David L. P., Gitti M., Vrtilek J.M., Raychaudhury S., Ponman T. J., ApJ, 735, 11
- Pacholczyk (1970) Pacholczyk A. G., 1970, Radio astrophysics. Nonthermal processes in galactic and extragalactic sources
- Perlman et al. (2002) Perlman E. S., Horner D. J., Jones L. R., Scharf C. A., Ebeling H., Wegner G., Malkan M., 2002, ApJS, 140, 265
- Peterson & Fabian (2006) Peterson J. R., Fabian A. C., 2006, PhR, 427, 1
- Pizzolato & Soker (2005) Pizzolato F., Soker N., 2005, ApJ, 632, 821
- Rafferty et al. (2006) Rafferty D. A., McNamara B. R., Nulsen P. E. J., Wise M. W., 2006, ApJ, 652, 216
- Randall et al. (2009) Randall S. W., Jones C., Markevitch M., Blanton E. L., Nulsen P.E. J., Forman W. R., 2009, ApJ, 700, 1404
- Reiprich et al. (2001) Reiprich, T. H. 2001, Ph.D. Dissertation, Cosmological Implications and Physical Properties of an X-Ray Flux Limited Sample of Galaxy Clusters, Ludwig-Maximilians Universit¨at M¨unchen
- Ruszkowski & Begelman (2002) Ruszkowski M., Begelman M. C., 2002, ApJ, 581, 223
- Ruszkowski & Oh (2011) Ruszkowski M., Oh S. P., 2011, MNRAS, 414, 1493
- Sanders et al. (2009) Sanders J. S., Fabian A. C., Taylor G. B., 2009, MNRAS, 393, 71
- Sarazin (1986) Sarazin C. L., 1986, Reviews of Modern Physics, 58, 1
- Scharf et al. (1997) Scharf C. A., Jones L. R., Ebeling H., Perlman E., Malkan M., Wegner G., 1997, ApJ, 477, 79
- Spitzer (1962) Spitzer L., 1962, Physics of Fully Ionized Gases. Wiley Interscience, New York, NY
- (65) Springel V., Di Matteo T., Hernquist L., 2005, MNRAS, 361, 776
- (66) Springel V., Di Matteo T., Hernquist L., 2005, ApJL, 620, 79
- Stawartz et al. (2006) Stawartz L., Kneiske T. M., Kataoka J., 2006, ApJ, 637, 693
- Vikhlinin et al. (2007) Vikhlinin A., Burenin R., Forman W. R., Jones C., Hornstrup A., Murray S. S., Quintana H., 2007, in Heating versus Cooling in Galaxies and Clusters of Galaxies, 48
- Voit (2011) Voit G. M., 2011, ApJ, 740, 28
- Yuan & Narayan (2014) Yuan F., Narayan R., 2014, ARA&A, 52, 529
- Zakamska & Narayan (2003) Zakamska N. L., Narayan R., 2003, ApJ, 582, 162

| Frequency | Position | Peak Flux | Integrated Flux | Map rms | Resolution |
|---|---|---|---|---|---|
| (MHz) | J2000 | (mJy) | (mJy) | (mJy) | (arcsec) |
| 610 | 14h 16m 27.357s | 4.29 0.13 | 7.10 0.33 | 0.18 | 8.03 5.36 |
| +230 15 22.00" | |||||
| 610 | 14h 16m 27.647s | 2.00 0.20 | 2.08 0.20 | 0.18 | 8.03 5.36 |
| +230 15 18.00" | |||||
| 610 | 14h 16m 27.502s | 7.60 0.65 | 12.41 1.60 | 0.98 | 40.39 34.28 |
| +230 15 24.00" | |||||
| 1420 | 14h 16m 27.473s | 2.60 0.13 | 3.55 0.27 | 0.13 | 8.306.96 |
| +230 15 22.40" | |||||
| 1420 | 14h 16m 27.502s | 3.40 0.43 | 3.48 0.76 | 0.36 | 32.9829.78 |
| +230 15 22.00" |
| Catalog | Peak Flux | Integrated Flux | Map rms |
|---|---|---|---|
| (mJy) | (mJy) | (mJy) | |
| GMRT | 2.60 | 3.55 | 0.13 |
| FIRST | 2.36 | 3.39 | 0.145 |
| NVSS | 3.1 | 3.6 | 0.5 |
| Cavity | Cavity hardness ratio | Anullus hardness ratio | ||
|---|---|---|---|---|
| C | 1.519 0.015 | 1.607 0.060 | 3.9 | 4.3 |
| D | 1.551 0.015 | 1.662 0.073 | 8.6 | 4.3 |
| E | 1.548 0.036 | 1.698 0.053 | 11.1 | 3.6 |
| aaOver pressure factor of injected lobe | |||||||||
|---|---|---|---|---|---|---|---|---|---|
| 2 | 3.7 | 3.0 | 2.7 | 2.6 | 2.3 | 2.7 | 3.1 | 2.8 | 2.5 |
| 10 | 3.7 | 3.0 | 2.7 | 10.6 | 9.2 | 11.2 | 12.5 | 2.8 | 2.5 |