Estimates of the thermal conductivity and the thermoelectric properties of PbTiO3 from first principles
Abstract
The lattice thermal conductivity () of PbTiO3 (PTO) is estimated using a combination of ab initio calculations and semiclassical Boltzmann transport equation. The computed is remarkably low, nearly comparable with the of good thermoelectric materials such as PbTe. In addition, a semiclassical analysis of the electronic transport quantities is presented, which suggests excellent thermoelectric properties, with a figure of merit well over 1 for a wide range of temperature. For thermoelectric applications, the could be further reduced by utilizing different morphologies and compositions.
pacs:
72.20.Pa, 77.84.-s, 63.20.kg, 71.15.MbPbTiO3 (PTO) is a well studied perovskite ferroelectric, and is used extensively in the technologically important ferroelectric/piezoelectric ceramic PbZrxTi(1-x)O3 (PZT). PTO transitions from the cubic paraelectric (PE) phase to the tetragonal ferroelectric (FE) phase at temperature 763 K. Recent computational work predicted PTO to be a promising -type transparent conducting compound based on its electronic structure.Hautier et al. (2013) Following doping to increase electrical conductivity, we can speculate about its thermoelectric behavior. The thermoelectric figure of merit at temperature is given by , where is the electrical conductivity, is the Seebeck coefficient, and and are the lattice contribution and the electronic contribution to thermal conductivity. As a first approximation, the of semiconductors is related to as . The Lorenz number is a near-constant for many materials, which leaves little room for controlling independent of . On the other hand, researchers have been pursuing many methods to reduce to increase .Snyder and Toberer (2008); Gaultois and Sparks (2014)
PTO has a relatively small unit cell which may not favor low . However, it has been observed that anharmonicity, such as that seen in thermoelectrics like PbTe, can decrease despite small lattice constants. PTO is used in superlattices and alloys – morphologies that could enhance phonon scattering and thus reduce further. Despite this promise, only limited amount of experimental results are available on the topic of room-temperature and high-temperature behavior of in ferroelectrics including PTO.Mante and Volger (1967); Strukov and Belov (1994); Tachibana et al. (2008) Computational estimate of could illuminate some of these points. With this in mind, a semiclassical analysis of , as well as the electronic transport parameters of PTO are reported in this paper. The calculations are based on Boltzmann transport equations (BTE), which rely on ab initio results as the input. This study indicates a very low and high thermoelectric potential for PTO.
Here DFT-based lattice dynamics methods are applied to generate the second-order interatomic force constants (IFC2), which are then used in the BTE solver (for phonons) to determine . The lattice dynamics methods assume harmonic forces on the atoms. If the forces have large anharmonic components, the resulting IFC2 will be less accurate, which in turn will make less precise. Thus, IFC2 from extreme anharmonic cases, or that from dynamically unstable structures cannot be used to determine the corresponding . For example, the cubic PTO structure for which DFT calculations predict imaginary phonon frequencies is outside the scope of the present study. However, tetragonal PTO (t-PbTiO3) shows less anharmonicity under the same calculation methods, and hence provides an alternate route to study from first principles.
To understand if the degree of anharmonicity in t-PbTiO3 is within a reasonable limit, I checked available experiments on PTO and other materials. The example of PbTe, an incipient ferroelectric and a leading thermoelectric, is particularly relevant in this context. Strong anharmonic interaction between longitudinal acoustic (LA) and transverse optic (TO) modes has been determined as the cause of the exceptionally low of PbTe.An et al. (2008); Delaire et al. (2011) DFT-based methods successfully estimated in PbTe despite such strong anharmonic interaction.Tian et al. (2012); Skelton et al. (2014) Anharmonicity in the phonon dispersion results of PTO has been studied experimentally.Shirane et al. (1970); Burns and Scott (1973); Foster et al. (1993) By performing least-square analysis of the phonon frequencies near , Freire and Katiyar concluded that anharmonicity in t-PbTiO3 is small.Freire and Katiyar (1988) Taken together, the observations on PbTe and PTO validate the use of the DFT-based methods to determine for t-PbTiO3. Additionally, in this work the phonon dispersion and are computed for different tetragonal structures of t-PbTiO3 to study how structural changes affect . This approach is similar to the recent work on PbTe and other Pb-chalcogenides by Skelton and co-workers.Skelton et al. (2014) Different t-PbTiO3 structures show modest variation in , according to the calculations presented here; and the range of closely follows the experimental . This conclusion for PTO, and similar conclusions for PbTe and the related systems Skelton et al. (2014) suggest that the DFT-based determination of could be a robust method, applicable to other ferroelectric/antiferroelectric materials.
The DFT calculations presented in this work were performed with Vienna Abinitio Simulation Package (VASP).Kresse and Furthmüller (1996); Kresse and Joubert (1999) Local density approximation (LDA)-based projector-augmented wave (PAW) pseudopotentials,Blöchl (1994) which included the semicore electrons of Ti, were used for these calculations. The self-consistent calculations (SCF) and ionic relaxations with fixed lattice parameters had a plane-wave cutoff of 400 eV, whereas a higher cutoff of 520 eV was applied when optimizing cell parameters. A Monkhorst-Pack -point mesh was used for the Brillouin zone integration. Forces on ions were converged to less than 0.001 eV/Å. Scalar relativistic effects were included in these calculations, but the spin-orbit effect was left out. According to these calculations, relaxed cell parameter for cubic PTO is Å. The optimized t-PbTiO3 (referred to as the S2 structure from now on) has Å, and . The cell parameters and the internal coordinates of atomic positions agree well with the previously reported values obtained from DFT-LDA calculations.García and Vanderbilt (1996); Marton and Hlinka (2013) Electronic density of states (eDOS) of the optimized cubic and tetragonal structures were determined via non self-consistent calculations with a -point grid of . The top valence bands of PTO (both in tetragonal and cubic structures) show strong dispersive character and are formed by the hybridization between Pb 6- and O 2-like orbitals, whereas the bottom of the conduction bands are relatively flat and have large contribution from Ti 3-like orbitals. The eDOS calculated in this work agree with previous reports.Piskunov et al. (2004); Hautier et al. (2013)
Besides S2, the phonon dispersion and were determined for three other tetragonal structures, all with relaxed ionic positions. Two of these structures have Å with (S1) and 1.03 (S3), whereas the third structure has Å, and 1.03 (S4). The systematic shift in phonon frequencies was studied using these tetragonal structures, by varying the lattice parameter while the tetragonality ratio was kept fixed, and vice versa. Phonon dispersion plots were computed under stringent convergence criteria, using the Phonopy code,Togo and Tanaka (2015) with VASP as the DFT calculator. A set of finite displacement calculations on the supercells of t-PbTiO3 (containing 320 atoms) produced the IFC2 used in this work.
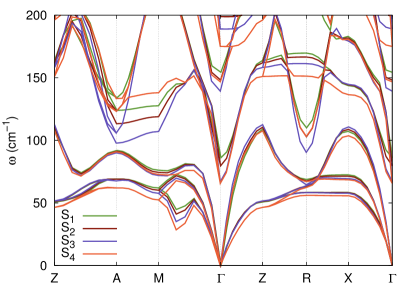
Fig. 1 shows the phonon dispersion for the structures S1–S4. In this figure we zoom into the region with phonon frequencies up to 200 cm-1 to inspect the thermal-current-carrying, low-lying phonon branches in greater detail. The acoustic modes of S4 have smaller frequencies ("softer") than the rest, and those belonging to S1–S3 nearly overlap except in the – region, where the structures with smaller have lower frequencies, i.e., (S1) (S2) (S3). Phonon frequencies of the lowest optic modes along the –– path follow the same pattern for S1–S3, whereas the optic modes related to S4 appear to have higher frequencies than S1–S3. The lowest optic mode at , known as (TO1),111conventional terminology, based on the decomposition of vibrational representation at . See Ref. García and Vanderbilt, 1996 for details. stiffens for structures that are more tetragonal. This effect of tetragonality on the zone-center (TO1) has been observed in previous calculations.Marton and Hlinka (2013) Experimental confirmation Burns and Scott (1973) of this trend of (TO1) is available via the temperature behavior of t-PbTiO3: a rise in that reduces the tetragonality in t-PbTiO3 is found to lower the associated (TO1) frequency. Thus the experiments and the calculations agree qualitatively.222In real life, strong anharmonic forces associated with the ferroelectric transition renormalize the phonon frequencies to real values, as PTO transitions to cubic structure.
In general, a more quantitative connection between structure and can be determined in some cases using the quasiharmonic approximation (QHA), which includes the phonon contribution to Helmholtz free energy as a function of volume ( and . Here we make a digression to look at the QHA analysis of t-PbTiO3 before moving on to discuss calculations. QHA assumes harmonic forces on atoms at a specific volume, but allows for phonon frequencies to change with structure. Theoretical background and the implementation details of QHA are available in Refs. Baroni et al., 2001; Skelton et al., 2014. Tetragonal symmetry in t-PbTiO3 implies that the coefficient of thermal expansion (CTE), a second-rank tensor, has only two independent components, given by ) and (following the Voigt notation). The components and are related to the principal components of strain as , and .Nye (1985) The volume CTE is . PTO shows negative thermal expansion (NTE) between 300 K–.Shirane et al. (1950); Shirane and Hoshino (1951); Chen et al. (2005) As rises towards , the of t-PbTiO3 decreases (as alluded to briefly in the last paragraph) while increases slightly, with an overall reduction in volume. Past attempts at applying QHA to determine the thermal expansion in PTO have run into difficulties. In one case, came out to be positive,Wang et al. (2014) whereas another study reported a vastly overestimated magnitude of .Wang et al. (2013) In general, the lattice parameters of t-PbTiO3 change in complex ways as functions of pressure,Tinte et al. (2003); Frantti et al. (2007); Ganesh and Cohen (2009); Zhu et al. (2014) which may be partly responsible for the difficulty in matching the QHA results for t-PbTiO3 with the experimental CTE.
In this work, the directly comparable components of CTE would be those determined under epitaxial constraints, because the phonon dispersion of different tetragonal structures (S1–S4) were compared by changing either the in-plane (x and y) or the out-of-plane (z) lattice direction(s), while holding the other fixed. The resulting CTE components can be termed clamped coefficients, and , which are not the same as and . The Phonopy-QHA codeTogo and Tanaka (2015) was used to compute and . To determine , a total of 12 structures were studied which spanned a variation in by around the optimized of t-PbTiO3 (while the optimized was held fixed). Similarly, was obtained using 11 structures by varying in a range of to around the optimized , while remained fixed. In Fig. 2 we see that in the 300 K–600 K, is ∘C-1 and is ∘C-1. The phonon dispersion results for S1–S4 structures along with the computed values of and firmly establish that the structures with smaller ratio correspond to higher in these calculations.

Having explored how the S1–S4 structures relate to , we now proceed to the results of the calculations. The ShengBTE codeLi et al. (2014) used in this work iteratively solves BTE for phonons to determine . The IFC2 required in this code were obtained using the Phonopy code as described earlier, generated with supercells via finite difference approach. The anharmonic IFC3 were obtained using the code thirdorder.pyLi et al. (2012) (supplied with ShengBTE), following the same finite difference methods on t-PbTiO3 supercells. Interaction up to the third nearest neighbors was included in these calculations, and VASP was used as the DFT engine. The linearized BTE was solved on a -centered, -point grid, which sufficiently converged . The supercells considered above to generate the set of IFC2 and IFC3 adequately converged . To test the convergence of on supercell size, additional sets of IFC2 and IFC3 were generated for the S2 structure, on supercells of dimensions and , respectively. Including the original choice ( supercells for IFC2, and supercells for IFC3), four combinations of IFC2 and IFC3 were tested. For S2, calculated with these four combinations lie within 0.2 Wm-1K-1, accurate enough for the purpose of this work.
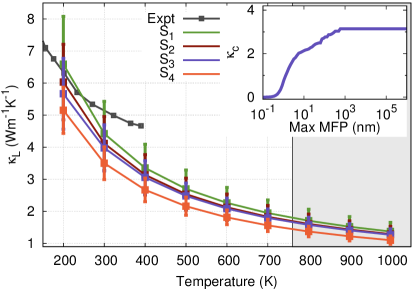
Fig. 3 shows the values for the structures S1–S4, with the shaded region corresponding to extrapolated values of for . First, we note that in PTO is low, especially at high temperature, and the structures with smaller show a lower . This effect is most pronounced for S4, whereas the curves corresponding to S1–S3 show significant overlap. The structural dependence of in t-PbTiO3 indicates that anharmonicity strongly affects . The experimental thermal conductivity results on perovskite ferroelectric samples Tachibana et al. (2008); Mante and Volger (1967) suggest that structural phase transitions do not significantly change the overall dependence of , except for a discontinuity close to . This observation was used to calculate beyond using IFC2 and IFC3 corresponding to tetragonal structures. The top and the bottom end of the bars in Fig. 3 correspond to the values along the in-plane and the out-of-plane axes respectively, while the solid line represents the one-third the trace of the tensor. The inset of Fig. 3 shows the cumulative as a function of the maximum phonon mean free path for the optimized t-PbTiO3 structure (S2) at 400 K. According to these calculations, a nanoparticle of 10 nm diameter will have of about 2 Wm-1K-1 – two thirds of its saturation value. Thus nanostructuring PTO may provide another route to reduce on top of its already low .
A comparison with the available experimental data for PTO shows overall agreement,Tachibana et al. (2008) although the computed appears underestimated in the 250 K–400 K. Experimental results include , partly explaining the difference. Another contribution to this mismatch may be due to ignoring the spin-orbit effect in the calculations, reported to be important in certain cases.Tian et al. (2012) A third source of the difference could be a result of using harmonic approximation to calculate the phonon dispersion, which predicted (spuriously) smaller frequencies for the low-lying TO modes. This may have assigned a larger fraction of the thermal current to the TO modes in the present calculations. The optic modes in general have slower group velocity. Thus, a bigger fraction of the heat current carried by optic modes would lower overall.Toberer et al. (2012) A conclusive insight would require observations from more experiments, and calculations that consider anharmonicity explicitly.
Low predicted for t-PbTiO3 would make it a promising thermoelectric candidate if its electronic transport properties are good enough. To this end, semiclassical Boltzmann theory-based BoltzTraPMadsen and Singh (2006) code was used to estimate , , and , within the constant scattering time approximation (CSTA). In CSTA, and are determined within a factor of the scattering time , considered a parameter, whereas has no such dependence on . Experimental results on , mobility and carrier concentration can be used to approximate . However, such experimental results are lacking for conductive samples of PTO. As a substitute, a broad range of , from 1 fs (=10-15 s) to 25 fs, was used in these calculations.
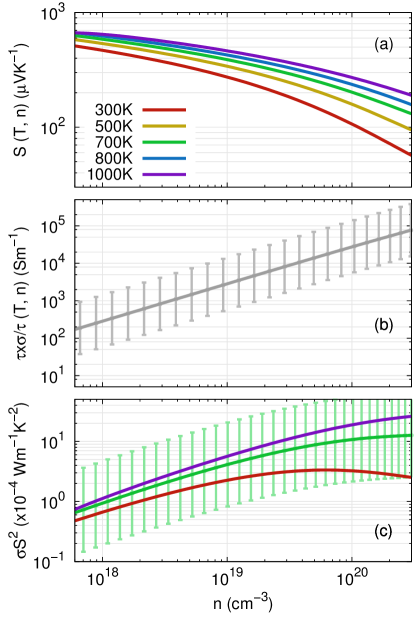
Fig. 4(a)-(c) show the calculated values of , , and the power factor , all presented as functions of the carrier density . In these calculations was found to be small (0.5 Wm-1K-1 with 5 fs) compared to , and hence ignored in further discussions. The DFT-derived eDOS were obtained from the cubic or the tetragonal structure, for and , respectively; and were interpolated by a factor of 100 for the transport calculations. For the t-PbTiO3 structure, one-third the trace of the and the tensors are presented. As is widely observed for semiconductor thermoelectrics, increases with (for the same ), and drops with increasing (calculated at the same ). The curve has no dependence, and in panel (b) we see a representative curve, with the bars spanning a region bound by 25 fs as the upper limit, to 1 fs as the lower limit. The solid line is drawn with 5 fs. Fig. 4(c) shows the estimated values of the power factor, which carries over the uncertainty in (the range of shown only for the 700 K case, the rest drawn for fs only). This plot indicates that is often greater than 0.002 Wm-1K-2 for a wide range of values of and . For reference, a power factor of 0.002 Wm-1K-2 at 1000 K, accompanied by the estimated value of 1.15 Wm-1K-1, indicates a of 1.7 – highly promising as an initial estimate.
To summarize this work, the calculations presented here predict very low for PTO, influenced by the anharmonicity. The results largely agree with experiments. The low and the accompanying favorable electronic transport values indicate great promise of PTO as a thermoelectric material, provided the electrical conductivity is raised by doping. PTO and related perovskite functional materials have been synthesized and characterized in a variety of morphologies and compositions. Thus, processes such as alloying or increasing the complexity of the unit cell, among other measures, could be utilized to further reduce . Synthesizing PTO in disordered structure may provide another route to reduce while maintaining high . The top of the valence band of PTO is formed by the hybridization between the Pb and the O orbitals. The expansive, anisotropic Pb orbitals may allow band-like hole conduction even in the absence of crystalline order, an idea originally suggested in the context of -type amorphous transparent conducting oxides.Hosono (2006) This idea has recently been proposed as a means to reduce in ZnO-based -type thermoelectrics.Roy et al. The present work demonstrates that can be computed for the low-symmetry, dynamically stable phases of ferroelectric/antiferroelectric materials, which can then be extended by reasonable approximation to high- regime. Comparison with experiments show that this approach can be a practical way to estimate on dynamically unstable systems which are otherwise intractable.
The calculations related to this work will be available for download after the peer-review process.
Acknowledgements.
The author is grateful to Michael L. Falk for the discussions and the support, to Jesús Carrete for the discussions regarding the implementation of ShengBTE, and to Olivia Alley for the suggestions on the manuscript. The work was supported by NSF grant DUE-1237992. This project used the computational resources of Extreme Science and Engineering Discovery Environment (XSEDE), which is supported by NSF grant number ACI-1053575; and The Maryland Advanced Research Computing Center (MARCC) supported by the State of Maryland.References
- Hautier et al. (2013) G. Hautier, A. Miglio, G. Ceder, G.-M. Rignanese, and X. Gonze, Nat. Commun. 4, 2292 (2013).
- Snyder and Toberer (2008) G. J. Snyder and E. S. Toberer, Nat. Mater. 7, 105 (2008).
- Gaultois and Sparks (2014) M. W. Gaultois and T. D. Sparks, Appl. Phys. Lett. 104, 113906 (2014).
- Mante and Volger (1967) A. J. H. Mante and J. Volger, Phys. Lett. A 24, 139 (1967).
- Strukov and Belov (1994) B. A. Strukov and A. A. Belov, Phase Transitions 51, 175 (1994).
- Tachibana et al. (2008) M. Tachibana, T. Kolodiazhnyi, and E. Takayama-Muromachi, Appl. Phys. Lett. 93, 092902 (2008).
- An et al. (2008) J. An, A. Subedi, and D. Singh, Solid State Commun. 148, 417 (2008).
- Delaire et al. (2011) O. Delaire, J. Ma, K. Marty, A. F. May, M. A. McGuire, M.-H. Du, D. J. Singh, A. Podlesnyak, G. Ehlers, M. D. Lumsden, and B. C. Sales, Nat. Mater. 10, 614 (2011).
- Tian et al. (2012) Z. Tian, J. Garg, K. Esfarjani, T. Shiga, J. Shiomi, and G. Chen, Phys. Rev. B 85, 184303 (2012).
- Skelton et al. (2014) J. M. Skelton, S. C. Parker, A. Togo, I. Tanaka, and A. Walsh, Phys. Rev. B 89, 205203 (2014).
- Shirane et al. (1970) G. Shirane, J. D. Axe, J. Harada, and J. P. Remeika, Phys. Rev. B 2, 155 (1970).
- Burns and Scott (1973) G. Burns and B. A. Scott, Phys. Rev. B 7, 3088 (1973).
- Foster et al. (1993) C. M. Foster, Z. Li, M. Grimsditch, S.-K. Chan, and D. J. Lam, Phys. Rev. B 48, 10160 (1993).
- Freire and Katiyar (1988) J. D. Freire and R. S. Katiyar, Phys. Rev. B 37, 2074 (1988).
- Kresse and Furthmüller (1996) G. Kresse and J. Furthmüller, Phys. Rev. B 54, 11169 (1996).
- Kresse and Joubert (1999) G. Kresse and D. Joubert, Phys. Rev. B 59, 1758 (1999).
- Blöchl (1994) P. E. Blöchl, Phys. Rev. B 50, 17953 (1994).
- García and Vanderbilt (1996) A. García and D. Vanderbilt, Phys. Rev. B 54, 3817 (1996).
- Marton and Hlinka (2013) P. Marton and J. Hlinka, Phase Transitions 86, 200 (2013).
- Piskunov et al. (2004) S. Piskunov, E. Heifets, R. Eglitis, and G. Borstel, Comput. Mater. Sci. 29, 165 (2004).
- Togo and Tanaka (2015) A. Togo and I. Tanaka, Scr. Mater. 108, 1 (2015).
- Note (1) Conventional terminology, based on the decomposition of vibrational representation at . See Ref. \rev@citealpnumgarcia_1996 for details.
- Note (2) In real life, strong anharmonic forces associated with the ferroelectric transition renormalize the phonon frequencies to real values, as PTO transitions to cubic structure.
- Baroni et al. (2001) S. Baroni, S. De Gironcoli, A. Dal Corso, and P. Giannozzi, Rev. Mod. Phys. 73, 515 (2001).
- Nye (1985) J. F. Nye, Physical properties of crystals: their representation by tensors and matrices (Oxford university press, 1985).
- Shirane et al. (1950) G. Shirane, S. Hoshino, and K. Suzuki, Phys. Rev. 80, 1105 (1950).
- Shirane and Hoshino (1951) G. Shirane and S. Hoshino, J. Phys. Soc. Jpn. 6, 265 (1951).
- Chen et al. (2005) J. Chen, X. Xing, R. Yu, and G. Liu, J. Am. Ceram. Soc. 88, 1356 (2005).
- Wang et al. (2014) L. Wang, P. Yuan, F. Wang, E. Liang, Q. Sun, Z. Guo, and Y. Jia, Mater. Res. Bull. 49, 509 (2014).
- Wang et al. (2013) F. Wang, Y. Xie, J. Chen, H. Fu, and X. Xing, Appl. Phys. Lett. 103, 221901 (2013).
- Tinte et al. (2003) S. Tinte, K. M. Rabe, and D. Vanderbilt, Phys. Rev. B 68, 144105 (2003).
- Frantti et al. (2007) J. Frantti, Y. Fujioka, and R. M. Nieminen, J. Phys. Chem. B 111, 4287 (2007).
- Ganesh and Cohen (2009) P. Ganesh and R. E. Cohen, J. Phys. Condens. Matter 21, 064225 (2009).
- Zhu et al. (2014) J. Zhu, J. Zhang, H. Xu, S. C. Vogel, C. Jin, J. Frantti, and Y. Zhao, Sci. Rep. 4 (2014).
- Li et al. (2014) W. Li, J. Carrete, N. A. Katcho, and N. Mingo, Comp. Phys. Commun. 185, 1747 (2014).
- Li et al. (2012) W. Li, L. Lindsay, D. A. Broido, D. A. Stewart, and N. Mingo, Phys. Rev. B 86, 174307 (2012).
- Toberer et al. (2012) E. S. Toberer, L. L. Baranowski, and C. Dames, Annu. Rev. Mater. Res. 42, 179 (2012).
- Madsen and Singh (2006) G. K. H. Madsen and D. J. Singh, Comput. Phys. Commun. 175, 67 (2006).
- Hosono (2006) H. Hosono, J. Non-Cryst. Solids 352, 851 (2006).
- (40) A. Roy, Y.-T. Cheng, and M. L. Falk, Unpublished .