PHENIX Collaboration
Azimuthally anisotropic emission of low-momentum direct photons in AuAu collisions at GeV
Abstract
The PHENIX experiment at the Relativistic Heavy Ion Collider has measured 2nd and 3rd order Fourier coefficients of the azimuthal distributions of direct photons emitted at midrapidity in AuAu collisions at GeV for various collision centralities. Combining two different analysis techniques, results were obtained in the transverse momentum range of GeV/. At low the second-order coefficients, , are similar to the ones observed in hadrons. Third order coefficients, , are nonzero and almost independent of centrality. These new results on and , combined with previously published results on yields, are compared to model calculations that provide yields and asymmetries in the same framework. Those models are challenged to explain simultaneously the observed large yield and large azimuthal anisotropies.
pacs:
25.75.DwI Introduction
Direct photons emerging from relativistic heavy ion collisions have long been considered an important probe of the entire evolution of the colliding system Shuryak (1978). At almost all known or conjectured stages of the collision there are processes producing photons. Unlike hadronic observables that mostly encode the state of the medium at freeze-out, photons are emitted at all times throughout the rapid evolution of the heavy ion collision and leave the interaction region unmodified. Thus by measuring direct photons one has access to information about the properties and dynamics of the medium integrated over space and time. The measurement of direct photons is challenging due to a large background of photons from the vacuum decay of final state hadrons (, , , etc.).
The PHENIX experiment at the Relativistic Heavy Ion Collider reported large direct photon yields Adare et al. (2010) with strong centrality dependence Adare et al. (2015) and significant azimuthal anisotropy or “elliptic flow” Adare et al. (2012a). Particularly surprising is the discovery of large azimuthal anisotropy for direct photons Adare et al. (2012a), which is comparable to that observed for hadrons Adare et al. (2011). Preliminary results from the Large Hadron Collider Wilde (2013); Lohner (2013) indicate similar direct photon yields and anisotropies. The observation of large azimuthal anisotropy combined with observations published earlier that the direct photon yields themselves are large Adare et al. (2010, 2015) contradicts several existing interpretations where the large yields are provided at the very early production stage, when the temperature of the system is highest but the collective flow including azimuthal asymmetry is negligible. Conversely, the observed large anisotropy suggests that photon production occurs at very late stages of the collision when the collective flow of the system is fully developed, while the temperature and the corresponding thermal photon emission rates are already lower. Indeed, theoretical models have great difficulty to simultaneously describe the observed yields and anisotropy. This failure, colloquially called “the direct photon puzzle”, triggered a large amount of theoretical work, new models and insights Turbide et al. (2006); Chatterjee et al. (2006); Chatterjee and Srivastava (2009); Dusling (2010); van Hees et al. (2011); Linnyk et al. (2014); Gale et al. (2015); Muller et al. (2014); Shen et al. (2014, 2015a); van Hees et al. (2015); Monnai (2014); Chatterjee et al. (2013); Dion et al. (2011); Liu and Liu (2014); Vujanovic et al. (2014); McLerran and Schenke (2014); Tuchin (2013); McLerran and Schenke (2016); Basar et al. (2012); Gelis et al. (2004); Biro et al. (2014); Hidaka et al. ; Campbell (2015).
In this paper we present new, more precise results on the azimuthal anisotropy of direct photon emission from 200 GeV AuAu collisions recorded in 2007 and 2010 by the PHENIX experiment. Results include second and third order Fourier components of azimuthal distributions ( and , respectively) measured over a transverse momentum range extended down to 0.4 GeV/. The new data, together with published results on yields, are compared to some of the more recent model calculations.
The paper is organized as follows. In Sec. II we describe the experiment, the data set, the way events are selected and categorized, and the two methods by which photons are measured. In Sec. III the steps needed to determine the direct photon , , and their uncertainties are described, and the final results are presented. In Sec. IV the results are compared to a few models treating yields and azimuthal asymmetries in a consistent framework. Sec. V summarizes our findings.
II Experimental setup and photon measurements
In PHENIX photons are detected by two substantially different techniques. The first technique uses external conversion of photons as described in detail in Ref. Adare et al. (2015). This method provides a high purity photon sample with good momentum resolution, but requires large statistics due to the few percent conversion probability and reduced acceptance. Therefore the range is limited. The second technique is a traditional calorimetric measurement of photons similar to Ref. Adare et al. (2012a), but with higher statistics. For photons identified by either technique, the azimuthal anisotropy is extracted with the event plane (EP) method. Here we give a brief summary of the PHENIX detector systems and a short description of the two analyses.
II.1 Event selection and centrality determination
Data from 200 GeV AuAu collisions were recorded with a minimum bias (MB) trigger based on the signal in the beam-beam counters (BBC) Allen et al. (2003), which are located around the beampipe at and cover the full azimuth. The minimum bias trigger requires at least two hits in each of the two BBCs (north and south) as well as a reconstructed vertex from the time-of-flight difference between the two sides. The efficiency of the MB trigger is %.
Collision centrality is calculated as percentiles of the total charge distribution in the north and south BBC. The centrality determination is based on percentiles of the total charge seen in the north and south BBC and takes into account small shifts in coverage due to variations of the collision -vertex.
II.2 Inclusive photons via external conversion
External conversion photons are reconstructed from MB = 200 GeV AuAu events recorded during the 2010 data taking period. The event vertex in this dataset was cm to ensure that the magnetic field is sufficiently uniform. The same sample was previously used in Ref. Adare et al. (2015) to determine direct photon yield and its centrality dependence, where details of this analysis can be found. In the rest of this paper this sample is referred to as “conversion photons”.
Photons convert to pairs in the readout plane of the Hadron Blind Detector (HBD) Anderson et al. (2011), which is located at 60 cm radial distance from the collision vertex and corresponds to 3% , where is the radiation length. The electron and positron from the photon conversion are tracked through the PHENIX central tracking detectors Adcox et al. (2003). The azimuthal direction and the momentum are reconstructed from the drift-chamber information, while the polar angle of each track is determined by a point measurement in the innermost pad-chamber (PC1) and the collision vertex. High efficiency electron identification cuts are used to reduce the hadron contamination in the sample. Light above a minimum threshold in the ring-imaging Čerenkov detector Aizawa et al. (2003) and a matching cluster of energy in the electromagnetic calorimeter (EMCal) Aphecetche et al. (2003) such that GeV and , where is the momentum, are required. The EMCal comprises two calorimeter types: 6 sectors of lead scintillator sampling calorimeter (PbSc) and 2 sectors of lead glass Čerenkov calorimeter (PbGl). The typical energy resolution of the PbSc is , and that of the PbGl is . The energy resolution, just as the photon identification efficiency, depends on centrality and its (small) effect is corrected for using simulated photon showers embedded into real events.
All remaining tracks with GeV/, are combined to pairs. Conversion photons are identified by analyzing the invariant mass of the pairs. The default tracking in PHENIX assumes that each track originates at the collision vertex. Thus, if the pair comes from a conversion of a real photon in the HBD readout plane, the momenta will be mis-measured and a finite mass, in this case about 12 MeV/, is reconstructed. Conversely, if the momenta are re-calculated assuming the HBD readout plane as origin, the invariant mass is close to zero. Through a simultaneous cut on both mass calculations a sample of photon conversions with a purity of 99% is obtained down to = 0.4 GeV/ Adare et al. (2015). The remaining 1% of pairs are mostly from the Dalitz decays. The effect on the inclusive photon is estimated to be smaller than 1%.
II.3 Inclusive photons and s via the calorimeter
The PHENIX EMCal is the principal detector in the calorimetric analysis, which is performed in a similar way as in Ref. Adare et al. (2012a). The and are measured simultaneously for inclusive photons and s. A total of MB AuAu events from the 2007 data taking period are analyzed. The event vertex in this sample was cm.
Photon candidates in the EMCal are clusters above a threshold energy of 0.2 GeV that pass a shower shape cut as well as a charged particle veto cut by the pad chamber PC3 immediately in front of the EMCal. However, photon candidates with less than 1 GeV energy are only used to reconstruct , but are not included in the inclusive photon sample of the calorimeter. As described in Ref. Afanasiev et al. (2012), the remaining hadron contamination was estimated by comparing geant simulations, verified with actual data. The is measured via the 2 decay channel, with a cut on the energy asymmetry of the two photons 0.8. For each bin the number of reconstructed s is taken as the integral of the two-photon invariant mass distribution, with the combinatorial background subtracted by the mixed event method Adare et al. (2008). The signal to background ratio at GeV/ is 0.1, rapidly improving with increasing .
For the inclusive photon measurement it is important to restrict the measurement to a region where the residual contamination from misidentified hadrons is small. Therefore, in the inclusive photon sample only clusters with GeV are considered. On the other hand the inclusive (and direct) photon results presented here have an upper range of 4 GeV/, which is far from the threshold where two decay photons from a can merge in the calorimeter. Within this range a purity of larger than 95% is achieved. The largest contamination of the photon sample results from antineutrons, which are not removed by the charge particle veto but deposit significant energy through annihilation. The systematic uncertainty from particle identification (PID) of photons is estimated by varying both the shower shape cut (five different settings) and, independently, applying or omitting the charged particle veto cut. Results from all cut variations are then fully corrected. The deviation between results is 3-4%, which is quoted as systematic uncertainty on the inclusive photon yield.
II.4 Event plane determination
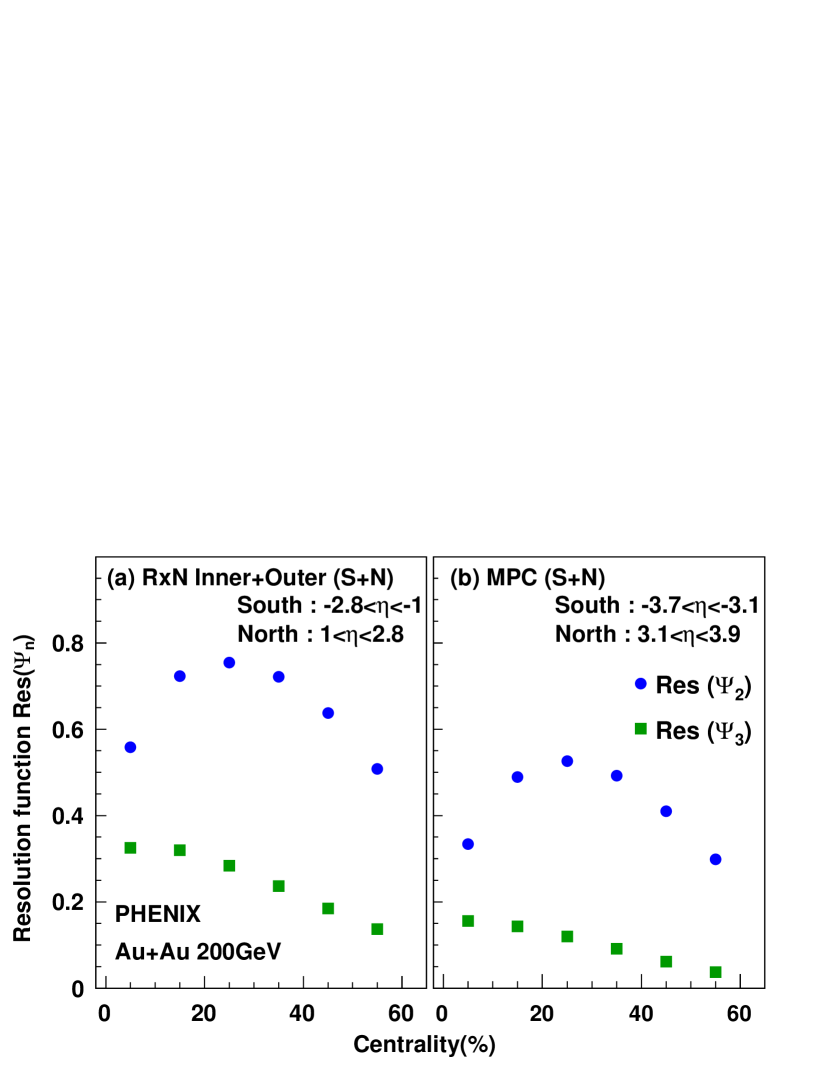
PHENIX has different detector systems to establish the EP, which cover different pseudorapidity () ranges: the outer and inner reaction plane detector (RxNO, 11.5, RxNI, 1.52.8), the muon piston calorimeters (MPCS, -3.7-3.1, MPCN, 3.13.9), and the BBC (3.13.9). All these detectors cover the full azimuth and are sufficiently separated in such that we do not expect auto correlations between the event plane determination and the photon production asymmetry measured. The RxNI and RXNO are scintillation counter systems with a 2 cm Pb converter that makes them sensitive to photons in addition to charged particles. While these photons contribute to the determination of the event plane, note that they are separated at least =0.7 from the central region, which is where the photon and are measured.
The results in this paper are obtained using the event planes measured by the combination of the RxNI and RxNO Richardson et al. (2011). Due to the large rapidity coverage this combination has the best resolution. The resolution is measured with the 2-subevent method Poskanzer and Voloshin (1998). The resolution for RxN and MPC is shown in Figure 1. The final results are cross-checked by using the other detectors for the event plane determination. Despite the significant difference in resolution the measured direct photon anisotropies are consistent, within the systematic uncertainties.
III Direct photon and
The photon anisotropy is measured via the coefficients of a Fourier decomposition of the azimuthal distributions of photons with respect to the event plane Poskanzer and Voloshin (1998)
| (1) |
where is the azimuthal angle of the photon, is the orientation of the event plane for a given event, and are the coefficients with respect to the event plane. In our analysis we made and explicitly tested the assumption that the 2nd and 3rd order event planes are uncorrelated, which allows us to ignore the terms and to introduce the notation and for the case , i.e. in the rest of the paper we use and .
The determination of the direct photon and proceeds in three steps: (i) and are determined for the conversion photon sample (Section II.2) and for the calorimeter photon sample (Section II.3) with respect to the event plane (Section II.4). We refer to these coefficients as inclusive photon and . In the second step (ii), the decay photon and are estimated, i.e. the anisotropy resulting from the decays of hadrons to photons. It is calculated based on , , and yields measured for charged and neutral pions; contributions from heavier mesons are taken into account using proper scaling (see Sec. III.2). As a final step (iii) the direct photon and are calculated statistically through a subtraction of the results from step (i) and (ii) weighted by the ratio , the ratio of the yields of direct photons to the yield of photons from hadron decays (see Eq. 7).
III.1 Inclusive photon and
The inclusive photon and are measured with respect to the event plane. We employ two methods to determine these coefficients. For each photon the azimuthal angular difference , with , is calculated. In the first method the coefficients are determined as the event ensemble average for individual bins in photon and centrality:
| (2) |
Here is the resolution function that accounts for the finite event plane resolution (see Figure 1).
In the second method the azimuthal distribution of photons in a given and centrality bin is fitted as:
| (3) |
| (4) |
This is Eq. 1 for the case and neglecting all terms. The measured values of and () need to be corrected for the event plane resolution.
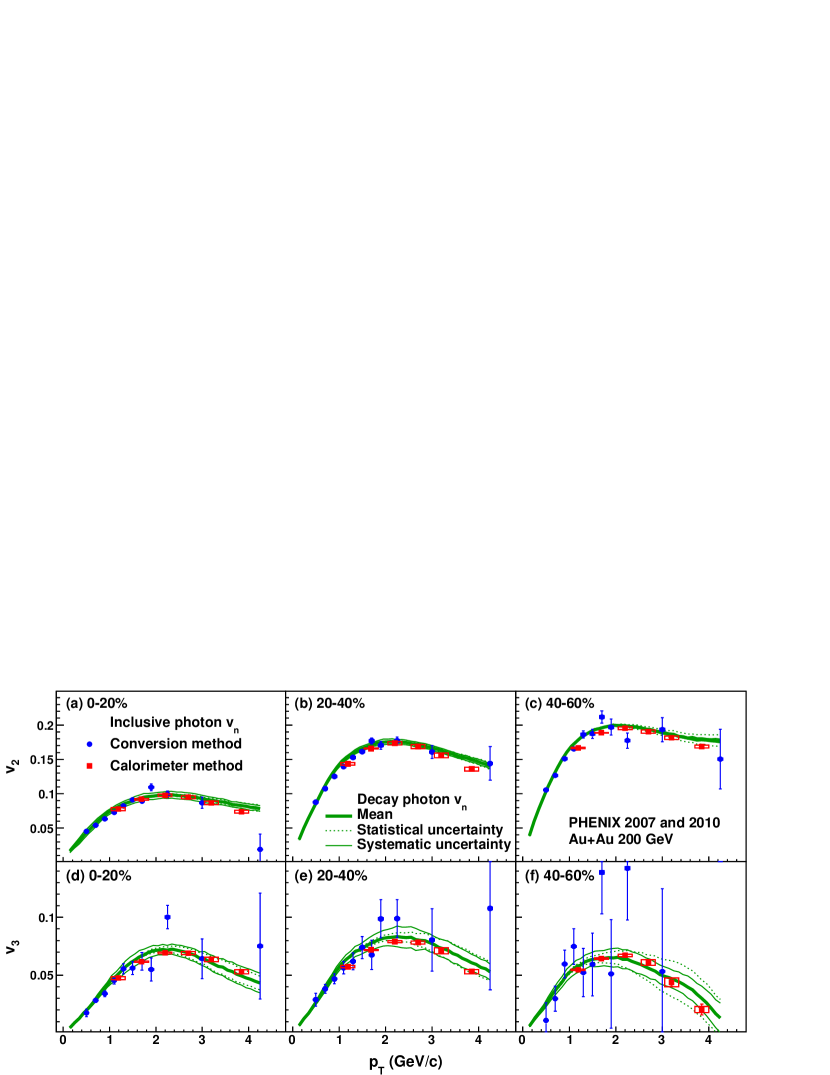
In the conversion photon method the quoted values come from the average cosine method, while in the calorimeter analysis the quoted values are the average of the results obtained with the two methods. The difference between the two methods is less than 1%. The results for the inclusive photon and are shown in Figure 2. Both measurements agree in the region where they overlap.
III.2 Decay photon and
About 80%–90% of the inclusive photons come from decays of neutral mesons and exhibit an anisotropy with respect to the event plane that results from the anisotropy of the parent mesons Adare et al. (2012a). To estimate this contribution we use measured yields and anisotropy for charged and neutral pions; for heavier mesons is obtained by scaling as described below. The yields of mesons used here are the same as are used for the measurement of in Ref. Adare et al. (2015).
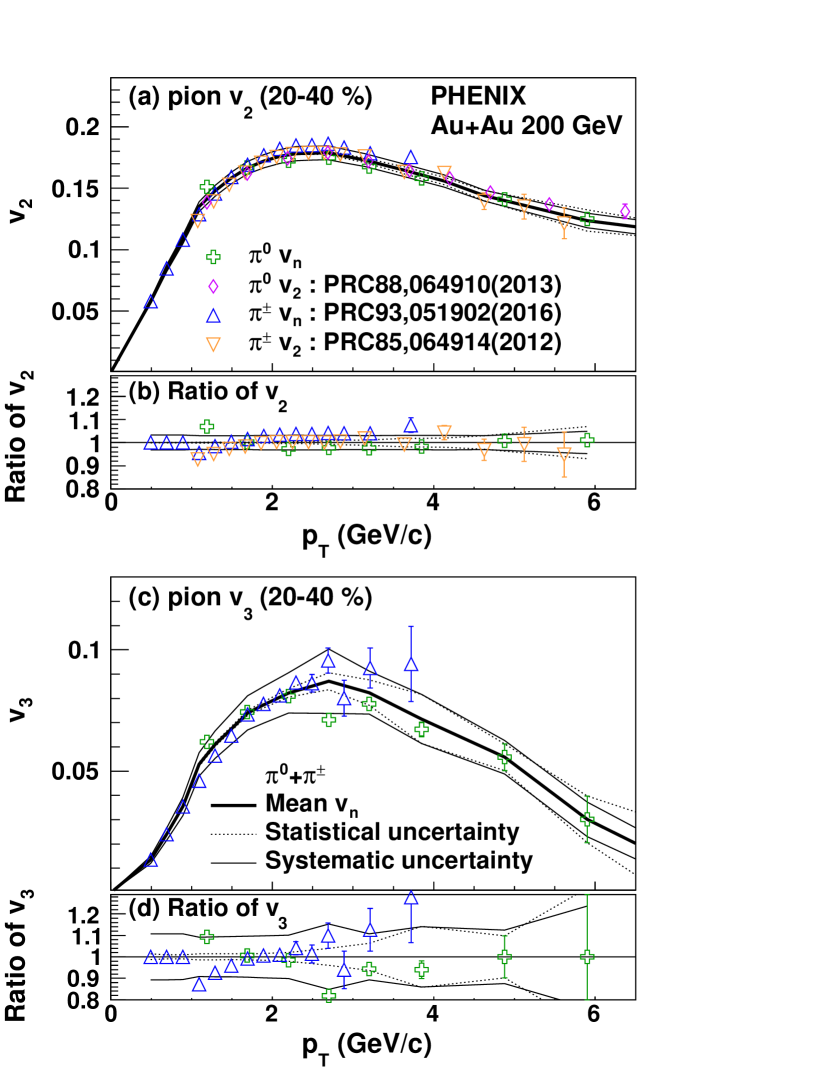
The and for pions are determined by combining data from different measurements of charged and neutral pion and . The has been published in Ref. Adare et al. (2013) but the measurement has been repeated in this analysis to check the consistency of the results. The method to count the number of s in any bin is briefly described in Sec. II.3. To obtain () for each the number of reconstructed s is extracted in six 15 (10) degree wide bins of the azimuthal angle where is the azimuth of the and is the second (third) order event plane (see Sec. II.4). These distributions of the raw counts vs. are then fitted as described in Sec. III.1 to obtain and for . Note that because the individual s are not identified, the average cosine method Poskanzer and Voloshin (1998) is not applicable.
These data are combined with data in the range 0.5 to 4 GeV/ Adare et al. (2016). For we also use data from Ref. Adare et al. (2012b). For the centrality class 20%–40% these data are compiled in Figure 3. We interpolate the data, weighted by their statistical and systematic uncertainties, to obtain an average value for pions as a function of . The result of this averaging procedure, including our estimate of the systematic uncertainties, is also shown in Figure 3.
For the heavier mesons, , the is derived from the of the pions by scaling with the kinetic energy Adare et al. (2007, 2016).
| (5) |
where
| (6) |
where is the mass of the corresponding meson.
The yields of the heavier mesons are determined from the yields at = 5 GeV/ using the following ratios: , , and . Below = 2 GeV/ -scaling is only an extrapolation for the yields. Therefore, we also applied a blast-wave fit, and the difference is included in the systematic uncertainties. Note that the blast-wave fit results in lower yield at small , increasing the direct photon yield and its ,. The meson yields, momentum spectra and are used to simulate mesons that are then decayed to all decay chains including photons. From the simulation we calculate the decay photon using Eq. 2 with , because the event plane is known in the simulation. The only source of systematic uncertainty on is the uncertainty of the measured and , and the resulting decay photon and , derived from it. The resulting is compared to the inclusive photon in Figure 2. We find that the decay photon and inclusive photon are similar. This was already observed for in Ref. Adare et al. (2012a), but is now also found for . Given that a finite direct photon yield has already been established Adare et al. (2010, 2015), the similarity of and implies a large direct photon , as will be shown in the next section.
III.3 Direct photon and
The and for direct photons are extracted from the measured inclusive photon , the decay photon , discussed in the previous sections, and the ratio of the inclusive to decay photon yield measured in Ref. Adare et al. (2015). The procedure was introduced in Ref. Adare et al. (2012a):
| (7) |
We reproduce from Ref. Adare et al. (2015) with statistical and systematic uncertainties in Figure 4.

All systematic uncertainties on the individual contributions on are summarized in Table 1. Uncertainties that are uncorrelated between data points are called Type A, those that are correlated are Type B and uncertainties that change all points by a common multiplicative factor are called Type C. Uncertainties on are common for and and for the conversion and calorimeter method. For photon and pion measurements with PHENIX the orientation of the event planes, i.e. , is determined with the same detectors using the same algorithms. Thus the systematic uncertainty on the event plane determination is common for all () measurements. The uncertainties on the decay photon are common to the conversion and calorimeter method. The systematic uncertainty on is independent for the two methods and mostly reflects the different purity of 95% compared to 99% for the calorimeter and conversion method, respectively.
| centralities | |||||
|---|---|---|---|---|---|
| Input | Source | 0%–20% | 20%–40% | 40%–60% | Type |
| 5.5% | 5.5% | 5.5% | B | ||
| conversion method | 1% | 1% | 1% | B | |
| calorimeter method | 4% | 3% | 4% | B | |
| meson (stat) | 1% | 1% | 1% | A | |
| (sys) | 5% | 3% | 2% | B | |
| (sys) | 1% | 1% | 1% | B | |
| Event plane | 3% | 3% | 3% | C | |
| conversion method | 1% | 1% | 1% | B | |
| calorimeter method | 5% | 7% | 10% | B | |
| meson (stat) | 1% | 2% | 4% | A | |
| (sys) | 11% | 11% | 11% | B | |
| (sys) | 1% | 1% | 1% | B | |
| Event plane | 6% | 7% | 18% | C | |
Using Gaussian error propagation, the statistical and systematic uncertainties would be calculated as:
| (8) | |||||
Except for the case , there is a nonlinear dependence on that, combined with uncertainties of 20%–30% on , results in asymmetric uncertainties, which are not described by Eq. 8. In particular, for the case the uncertainties on and are amplified if is small.
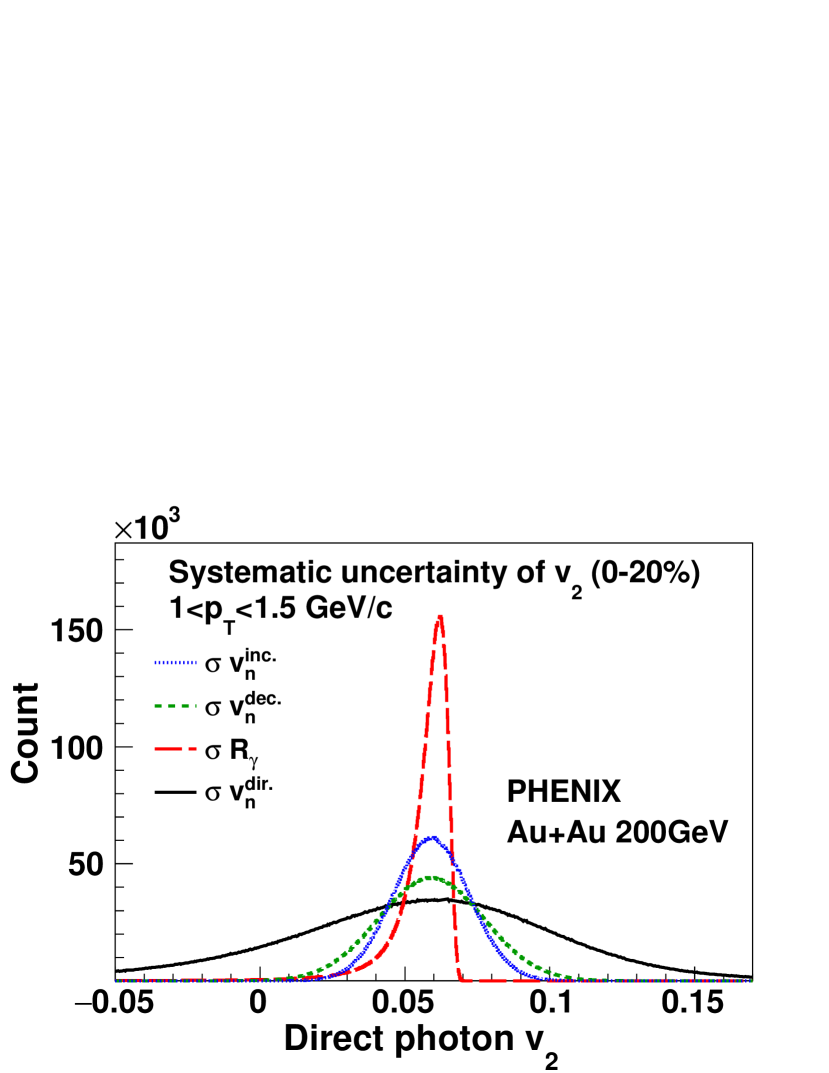
We estimate these asymmetric uncertainties by modeling a probability distribution for possible values of using the statistical and systematic uncertainties on , and the event plane resolution. We assume that the individual statistical and systematic uncertainties follow Gaussian probability distributions. The probability distribution for is then determined by generating many combinations of , , and . Figure 5 shows one example of a probability distribution based on the systematic uncertainties on the calorimeter measurement for 0%–20% centrality and GeV/. In Figure 5 the effect of the uncertainty of only or , are plotted separately. The asymmetry due to the uncertainty of is clearly visible.
Probability distributions based on statistical (including type A systematics) and systematic uncertainties are determined for each data point in and centrality and for both analyses. The central value for each data point was calculated using Eq. 7. We note that the peak or median of the probability distributions used to determine the statistical and systematic uncertainties agrees with the calculated central value to better than the symbol size. From each distribution we calculate the lower and upper bound on the uncertainty by integrating from to a for which the integrated probability reaches 15.9%. These values bracket a 68% probability range for and are quoted as upper and lower statistical and systematic uncertainties on the final result.
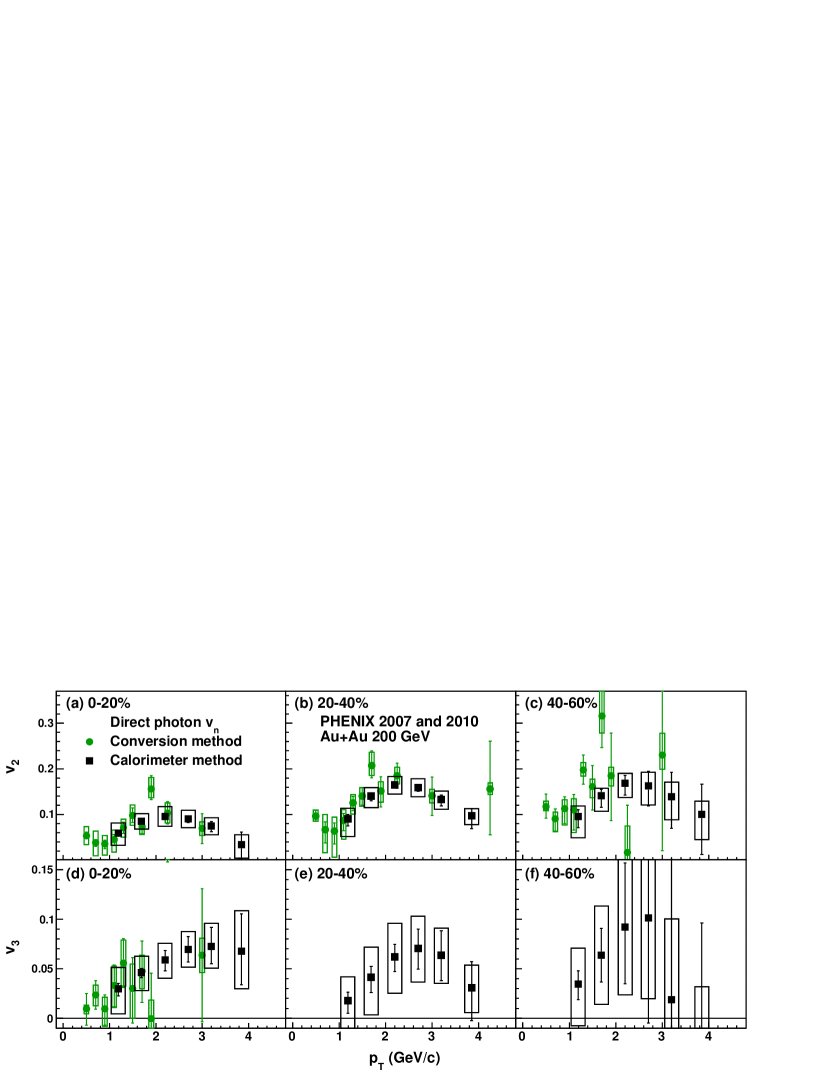
The final results for the direct photon and , including statistical and systematic uncertainties as outlined above, are shown in Figure 6 for three centralities and separately for the two analysis methods. For the conversion method is shown only for the highest centrality bin; the statistical fluctuations preclude any meaningful measurement in the more peripheral bins. The data and their uncertainties are shown in Tables 2 and 3.
| Centrality | Method | [GeV/ ] | Statistical uncert. | Systematic uncert. | |
|---|---|---|---|---|---|
| 0%–20% | conversion photon | 0.50 | 0.0531 | +0.0084, -0.0076 | +0.0200, -0.0187 |
| 0.70 | 0.0387 | +0.0070, -0.0087 | +0.0252, -0.0291 | ||
| 0.90 | 0.0357 | +0.0080, -0.0104 | +0.0185, -0.0246 | ||
| 1.10 | 0.0456 | +0.0105, -0.0135 | +0.0208, -0.0277 | ||
| 1.30 | 0.0713 | +0.0116, -0.0128 | +0.0185, -0.0207 | ||
| 1.50 | 0.0979 | +0.0162, -0.0153 | +0.0227, -0.0214 | ||
| 1.70 | 0.0735 | +0.0148, -0.0160 | +0.0157, -0.0173 | ||
| 1.90 | 0.1560 | +0.0291, -0.0229 | +0.0254, -0.0192 | ||
| 2.25 | 0.1034 | +0.0247, -0.0243 | +0.0223, -0.0215 | ||
| 3.00 | 0.0699 | +0.0316, -0.0338 | +0.0140, -0.0155 | ||
| 4.25 | -0.3534 | +0.8077, -0.1197 | +0.1149, -0.1831 | ||
| calorimeter | 1.19 | 0.0591 | +0.0038, -0.0058 | +0.0225, -0.0266 | |
| 1.69 | 0.0852 | +0.0029, -0.0035 | +0.0163, -0.0170 | ||
| 2.20 | 0.0957 | +0.0046, -0.0050 | +0.0214, -0.0218 | ||
| 2.70 | 0.0903 | +0.0074, -0.0078 | +0.0186, -0.0190 | ||
| 3.20 | 0.0747 | +0.0098, -0.0122 | +0.0177, -0.0189 | ||
| 3.85 | 0.0339 | +0.0282, -0.0430 | +0.0218, -0.0298 | ||
| 20%–40% | conversion photon | 0.50 | 0.0964 | +0.0125, -0.0113 | +0.0133, -0.0113 |
| 0.70 | 0.0668 | +0.0173, -0.0289 | +0.0336, -0.0485 | ||
| 0.90 | 0.0640 | +0.0178, -0.0281 | +0.0308, -0.0555 | ||
| 1.10 | 0.0866 | +0.0155, -0.0217 | +0.0240, -0.0403 | ||
| 1.30 | 0.1251 | +0.0146, -0.0170 | +0.0178, -0.0240 | ||
| 1.50 | 0.1405 | +0.0182, -0.0202 | +0.0185, -0.0227 | ||
| 1.70 | 0.2074 | +0.0316, -0.0269 | +0.0291, -0.0212 | ||
| 1.90 | 0.1511 | +0.0314, -0.0342 | +0.0207, -0.0245 | ||
| 2.25 | 0.1846 | +0.0279, -0.0273 | +0.0186, -0.0174 | ||
| 3.00 | 0.1412 | +0.0407, -0.0431 | +0.0137, -0.0160 | ||
| 4.25 | 0.1561 | +0.1048, -0.0992 | +0.0133, -0.0121 | ||
| calorimeter | 1.19 | 0.0902 | +0.0097, -0.0151 | +0.0236, -0.0377 | |
| 1.69 | 0.1403 | +0.0066, -0.0104 | +0.0185, -0.0248 | ||
| 2.20 | 0.1649 | +0.0046, -0.0056 | +0.0188, -0.0202 | ||
| 2.70 | 0.1592 | +0.0071, -0.0083 | +0.0189, -0.0200 | ||
| 3.20 | 0.1327 | +0.0098, -0.0136 | +0.0190, -0.0216 | ||
| 3.85 | 0.0972 | +0.0155, -0.0277 | +0.0153, -0.0192 | ||
| 40%–60% | conversion photon | 0.50 | 0.1173 | +0.0272, -0.0252 | +0.0117, -0.0086 |
| 0.70 | 0.0905 | +0.0214, -0.0266 | +0.0149, -0.0280 | ||
| 0.90 | 0.1128 | +0.0261, -0.0327 | +0.0192, -0.0349 | ||
| 1.10 | 0.1101 | +0.0338, -0.0444 | +0.0243, -0.0473 | ||
| 1.30 | 0.1978 | +0.0325, -0.0313 | +0.0163, -0.0138 | ||
| 1.50 | 0.1608 | +0.0465, -0.0508 | +0.0168, -0.0244 | ||
| 1.70 | 0.3154 | +0.0943, -0.0687 | +0.0771, -0.0366 | ||
| 1.90 | 0.1848 | +0.0943, -0.0969 | +0.0184, -0.0224 | ||
| 2.25 | 0.0173 | +0.1036, -0.1478 | +0.0584, -0.1188 | ||
| 3.00 | 0.2305 | +0.2262, -0.1954 | +0.0473, -0.0310 | ||
| 4.25 | -0.0043 | +0.4198, -0.2826 | +0.0466, -0.0920 | ||
| calorimeter | 1.19 | 0.0960 | +0.0147, -0.0247 | +0.0226, -0.0462 | |
| 1.69 | 0.1412 | +0.0139, -0.0255 | +0.0162, -0.0334 | ||
| 2.20 | 0.1687 | +0.0172, -0.0258 | +0.0212, -0.0313 | ||
| 2.70 | 0.1624 | +0.0323, -0.0427 | +0.0302, -0.0405 | ||
| 3.20 | 0.1388 | +0.0539, -0.0657 | +0.0319, -0.0487 | ||
| 3.85 | 0.0999 | +0.0670, -0.0788 | +0.0290, -0.0533 |
| Centrality | Method | [GeV/ ] | Statistical uncert. | Systematic uncert. | |
|---|---|---|---|---|---|
| 0%–20% | conversion photon | 0.50 | 0.0094 | +0.0155, -0.0163 | +0.0039, -0.0052 |
| 0.70 | 0.0237 | +0.0142, -0.0146 | +0.0099, -0.0111 | ||
| 0.90 | 0.0094 | +0.0143, -0.0163 | +0.0119, -0.0173 | ||
| 1.10 | 0.0333 | +0.0204, -0.0218 | +0.0193, -0.0223 | ||
| 1.30 | 0.0558 | +0.0247, -0.0247 | +0.0233, -0.0233 | ||
| 1.50 | 0.0299 | +0.0314, -0.0346 | +0.0246, -0.0301 | ||
| 1.70 | 0.0476 | +0.0305, -0.0317 | +0.0161, -0.0177 | ||
| 1.90 | -0.0006 | +0.0461, -0.0535 | +0.0189, -0.0265 | ||
| 2.25 | 0.2094 | +0.0657, -0.0516 | +0.0461, -0.0299 | ||
| 3.00 | 0.0637 | +0.0672, -0.0672 | +0.0172, -0.0174 | ||
| 4.25 | 0.2753 | +0.4140, -0.4118 | +0.1492, -0.0765 | ||
| calorimeter | 1.19 | 0.0298 | +0.0055, -0.0073 | +0.0214, -0.0256 | |
| 1.69 | 0.0461 | +0.0040, -0.0053 | +0.0166, -0.0182 | ||
| 2.20 | 0.0587 | +0.0096, -0.0110 | +0.0170, -0.0185 | ||
| 2.70 | 0.0696 | +0.0129, -0.0129 | +0.0180, -0.0180 | ||
| 3.20 | 0.0726 | +0.0191, -0.0175 | +0.0231, -0.0221 | ||
| 3.85 | 0.0677 | +0.0380, -0.0332 | +0.0408, -0.0378 | ||
| 20%–40% | calorimeter | 1.19 | 0.0178 | +0.0085, -0.0127 | +0.0240, -0.0343 |
| 1.69 | 0.0415 | +0.0108, -0.0154 | +0.0304, -0.0381 | ||
| 2.20 | 0.0619 | +0.0128, -0.0146 | +0.0339, -0.0365 | ||
| 2.70 | 0.0703 | +0.0198, -0.0206 | +0.0326, -0.0336 | ||
| 3.20 | 0.0637 | +0.0244, -0.0256 | +0.0274, -0.0284 | ||
| 3.85 | 0.0308 | +0.0265, -0.0331 | +0.0228, -0.0250 | ||
| 40%–60% | calorimeter | 1.19 | 0.0346 | +0.0131, -0.0157 | +0.0362, -0.0422 |
| 1.69 | 0.0638 | +0.0271, -0.0273 | +0.0497, -0.0494 | ||
| 2.20 | 0.0920 | +0.0651, -0.0567 | +0.0780, -0.0676 | ||
| 2.70 | 0.1011 | +0.1224, -0.1028 | +0.0973, -0.0793 | ||
| 3.20 | 0.0187 | +0.1580, -0.1476 | +0.0823, -0.0877 | ||
| 3.85 | -0.0430 | +0.1421, -0.1289 | +0.0751, -0.0938 |
The two analysis techniques are very different but the results agree well in the overlap region, and they are also consistent with the results published earlier Adare et al. (2012a). The direct photon centrality dependence, both in trend and magnitude, is quite similar to the observed pion . The third order coefficients are consistent with no centrality dependence.
IV Comparisons to models
As already mentioned, the essence of the “direct photon puzzle” is that current theoretical scenarios have difficulties explaining the large direct photon yield and azimuthal asymmetries at the same time. This is illustrated by a recent state-of-the-art calculation of viscous hydrodynamic calculation of photon emission with fluctuating initial density profiles and standard thermal rates Shen et al. (2015a), which falls significantly short in describing yield and . Over the past few years many new ideas have been proposed to resolve this puzzle, including non equilibrium effects Monnai (2014); Gelis et al. (2004); McLerran and Schenke (2016, 2014), enhanced early emission due to large magnetic fields Muller et al. (2014); Basar et al. (2012); Tuchin (2013), enhanced emission at hadronization Campbell (2015), as well as modifications of the formation time and initial conditions Chatterjee et al. (2013); Liu and Liu (2014); Vujanovic et al. (2014).
In this subsection we compare our results to a subset of the models which (i) consider thermal radiation from the QGP and HG (hadron gas) plus additional proposed sources, (ii) have a complete model for the space-time evolution, and (iii) calculate absolute yields and . For the comparison we use the data for the 20%–40% centrality class, and note that the comparison leads to similar conclusions for the other centrality bins. While none of the models describes all aspects of the available data, they are representative of how different theories are trying to cope with the challenge.
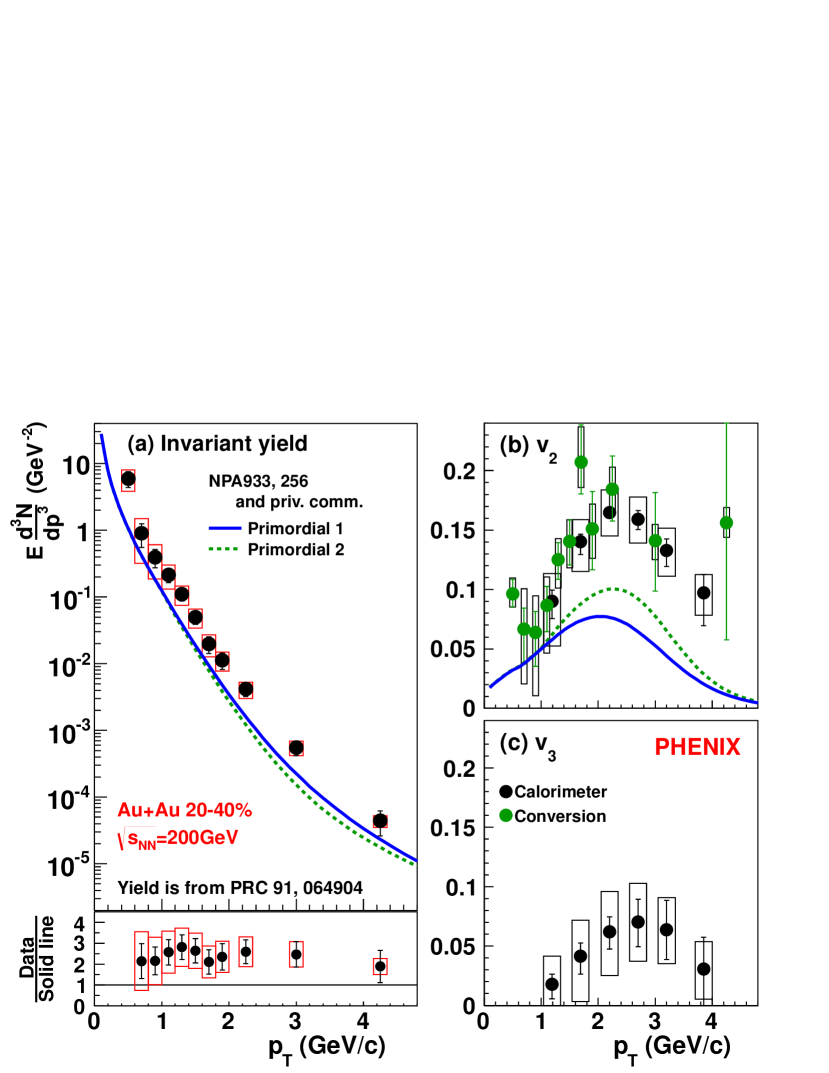
First, we compare the data to the “fireball” scenario originally calculated in Ref. van Hees et al. (2011). The model includes pQCD, QGP and HG contributions, with the instantaneous rates convoluted with a fireball expansion profile. The basic parameter is the initial transverse acceleration of the fireball, . The prompt photon component is estimated in two ways. The first variant is a parametrization of the photon yields measured in by the PHENIX experiment Adler et al. (2007) (labeled as “primordial 1”), the second is an -scaling motivated parametrization (labeled as “primordial 2”), modified with an empirical factor to match the measured data at high (above 4 GeV/). The yield calculation includes thermal yields from the QGP with MeV and from the hadronic phase. Different from an earlier version of the model, chemical equilibrium prior to kinetic freeze-out is no longer assumed. This results in a large enhancement in photon production in the later hadronic stages via processes like meson annihilation (for instance ). With an initial transverse acceleration /fm and fm/ fireball lifetime, 100 MeV freeze-out temperature and surface velocity, the observed low photon yields are recovered within systematic uncertainties, but underpredict the data van Hees et al. (2011). In Figure 7 the data are compared to the most recent updated “fireball” scenario shown in Ref. van Hees et al. (2015), which includes a calculation with ideal hydrodynamics with finite initial flow at thermalization and enhanced yields around chemical freeze-out temperature that improves the description of the data. The direct photon has its maximum at about the same in both theory and data. The calculated in the original fireball scenario van Hees et al. (2011) under predicts the measured one. The radial boost hardens the photons from the hadronic gas (HG) and in this way increases as well, but the calculation still falls short of the measurement. is currently not calculated in this model.
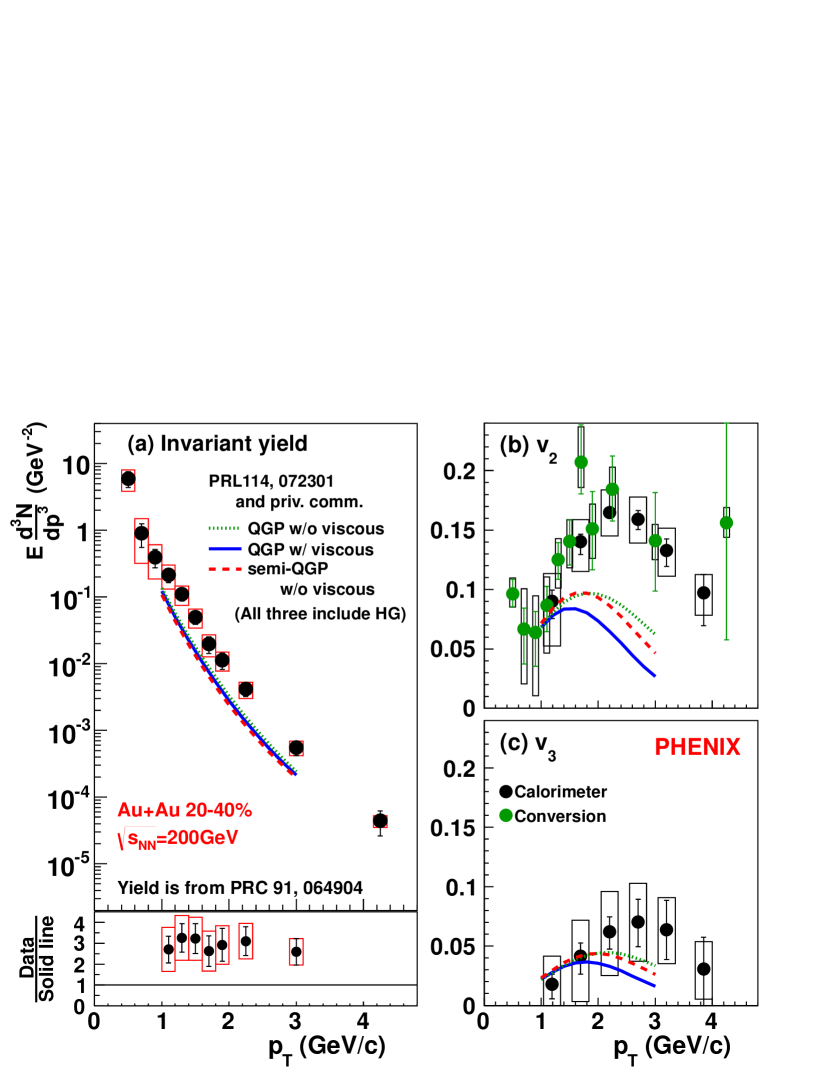
Second, in Figure 8 the data are compared to three calculations evaluated with the hydrodynamical background as described in Ref. Ryu et al. (2015); Paquet et al. (2016). The first calculation, labeled ”QGP w/ viscous”, was evaluated using the AMY photon emission rate in the high-temperature (QGP) region, and included viscous corrections to the photon emission rates Shen et al. (2015b); Dion et al. (2011) due to both bulk and shear viscosities. The same calculation without the viscous corrections corresponds to the curve labeled ”QGP, w/o viscous”. Once viscous corrections are included, drops by more than 50% at 3 GeV/, while the yield decreases just by 10%. The third curve, labelled ”semi-QGP, w/o viscous”, shows the consequence of including the effect of confinement on the photon emission rate, as computed in the semi-QGP approach Gale et al. (2015). The utilization of the semi-QGP photon rates at high temperatures suppresses the spectrum, but does not change the significantly. This is a consequence of the small contribution of QGP photons to the thermal photon , which is dominantly produced at temperatures around and smaller than the confinement temperature. The prompt photon contributions in all three calculations are evaluated within the perturbative QCD framework.
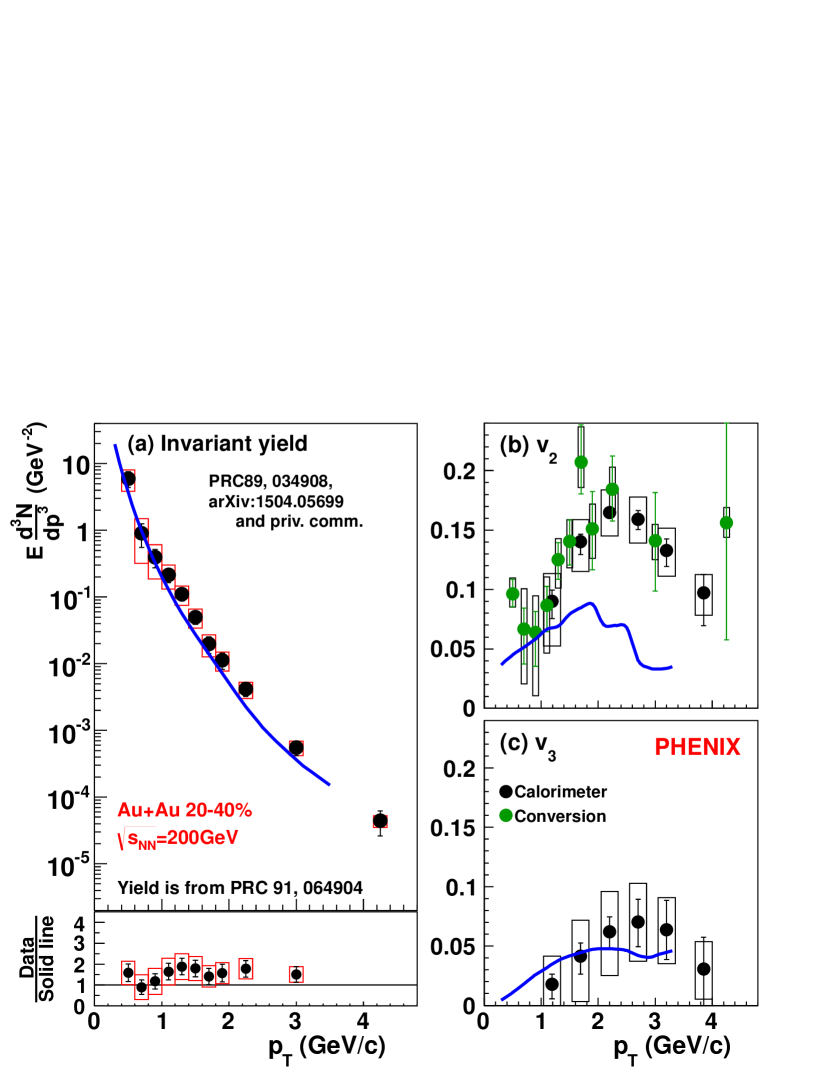
Third, we compare the data with PHSD (parton-hadron-string dynamics), a microscopic transport model Linnyk et al. (2014). In addition to the traditional QGP and HG sources (resonance decays) this model includes late stage meson-meson and meson-baryon Bremsstrahlung, which enhances the yield at the lowest substantially and increases by almost 50% in the GeV/ region (see Figure 2 in Ref. Linnyk et al. (2014)). Contributions from photonic decays of and are also included, because these are not subtracted in the measurement. After all other sources are added, the direct photon spectrum is very well reproduced below 3 GeV/, but under predicts the measured values. Also, the where reaches its maximum is under predicted. In Figure 9 the data are compared to the latest PHSD model calculation Linnyk et al. (2015) that included additional photon production channels in the hadronic phase and improved the Bremsstrahlung calculation. The model also provides . It is positive and consistent with the data within uncertainties.
Explaining the large yield and strong flow simultaneously requires significant improvements in quantifying the contributions from the late stage QGP and hadron-gas interactions. Even deeper insight on both the photon sources and the time profile of the system may be necessary to further improve the models. Future measurements of more differential quantities will help to distinguish and quantify the individual photon sources.
V Summary and conclusions
The PHENIX experiment at the Relativistic Heavy Ion Collider measured 2nd and 3rd order Fourier coefficients of the azimuthal distributions of direct photons emitted at midrapidity in = 200 GeV AuAu collisions, for various collision centralities. Two different and independent analyses are used to determine the inclusive photon yield. The external conversion photon measurement allows one to extend the range down to 0.4 GeV/ compared to 1.0 GeV/ for the calorimetric measurement. In the overlap region the two results are consistent. The measurements are also consistent with earlier published results, while is published for the first time.
Both the direct photon and are found to be large. The exhibits a clear centrality-dependence, while is consistent with no centrality dependence. At all centralities, the direct photon is similar in magnitude to the hadron for 3 GeV/, The direct photon is consistent with that for hadrons over the entire range.
We compare the data to several recent calculations, which treat the direct photon yields and the azimuthal asymmetries in a consistent production and evolution framework. None of them describe the full systematics of the data adequately, but there has been progress in the last few years. The general trend of the models appears to be including sources from the earliest (pre-equilibrium, see for instance Ref. Muller et al. (2014)) or very late times in the evolution of the system, while giving less emphasis to photon production at intermediate times, when most of the expansion occurs. PHSD includes new sources from the hadron gas and photon production even after the hadrons are decoupled from each other, which improves description of the yields but still under predicts . The model that best approximates the measured , including the region where reaches its maximum value, starts the evolution with a large initial boost even before thermalization van Hees et al. (2011). It is also worth noting that the microscopic transport model Linnyk et al. (2014) is able to describe the anisotropies as well as the full-scale viscous hydrodynamics Gale et al. (2015).
While the data are getting more differential and more accurate, and model calculations improve, the “direct photon puzzle” remains unresolved. High quality data of yields and and for different collision systems, including very asymmetric ones, and energies would help to further improve our understanding of direct photon production because robust models must be able to describe the data over a wide range of experimental conditions.
ACKNOWLEDGMENTS
We thank the staff of the Collider-Accelerator and Physics Departments at Brookhaven National Laboratory and the staff of the other PHENIX participating institutions for their vital contributions. We acknowledge support from the Office of Nuclear Physics in the Office of Science of the Department of Energy, the National Science Foundation, Abilene Christian University Research Council, Research Foundation of SUNY, and Dean of the College of Arts and Sciences, Vanderbilt University (U.S.A), Ministry of Education, Culture, Sports, Science, and Technology and the Japan Society for the Promotion of Science (Japan), Conselho Nacional de Desenvolvimento Científico e Tecnológico and Fundação de Amparo à Pesquisa do Estado de São Paulo (Brazil), Natural Science Foundation of China (Peoples’ Republic of China), Croatian Science Foundation and Ministry of Science, Education, and Sports (Croatia), Ministry of Education, Youth and Sports (Czech Republic), Centre National de la Recherche Scientifique, Commissariat à l’Énergie Atomique, and Institut National de Physique Nucléaire et de Physique des Particules (France), Bundesministerium für Bildung und Forschung, Deutscher Akademischer Austausch Dienst, and Alexander von Humboldt Stiftung (Germany), National Science Fund, OTKA, Károly Róbert University College, and the Ch. Simonyi Fund (Hungary), Department of Atomic Energy and Department of Science and Technology (India), Israel Science Foundation (Israel), Basic Science Research Program through NRF of the Ministry of Education (Korea), Physics Department, Lahore University of Management Sciences (Pakistan), Ministry of Education and Science, Russian Academy of Sciences, Federal Agency of Atomic Energy (Russia), VR and Wallenberg Foundation (Sweden), the U.S. Civilian Research and Development Foundation for the Independent States of the Former Soviet Union, the Hungarian American Enterprise Scholarship Fund, and the US-Israel Binational Science Foundation.
References
- Shuryak (1978) E. V. Shuryak, “Quark-Gluon Plasma and Hadronic Production of leptons, photons, and pions,” Phys. Lett. B 78, 150 (1978).
- Adare et al. (2010) A. Adare et al. (PHENIX Collaboration), “Enhanced production of Direct Photons in Au+Au Collisions at =200 GeV and Implications for the Initial Temperature,” Phys. Rev. Lett. 104, 132301 (2010).
- Adare et al. (2015) A. Adare et al. (PHENIX Collaboration), “Centrality dependence of low-momentum direct-photon production in AuAu collisions at 200 GeV,” Phys. Rev. C 91, 064904 (2015).
- Adare et al. (2012a) A. Adare et al. (PHENIX Collaboration), “Observation of Direct-Photon Collective Flow in Au+Au Collisions at =200 GeV,” Phys. Rev. Lett. 109, 122302 (2012a).
- Adare et al. (2011) A. Adare et al. (PHENIX Collaboration), “Measurement of Higher Order Flow Harmonics in AuAu Collisions at GeV,” Phys. Rev. Lett. 107, 252301 (2011).
- Wilde (2013) M. Wilde (ALICE Collaboration), “Measurement of Direct Photons in and PbPb Collisions with ALICE,” Nucl. Phys. A 904, 573c (2013).
- Lohner (2013) D Lohner (ALICE Collaboration), “Measurement of Direct-Photon Elliptic Flow in Pb-Pb Collisions at TeV,” J. Phys. Conf. Ser. 446, 012028 (2013).
- Turbide et al. (2006) S. Turbide, C. Gale, and R. J Fries, “Azimuthal Asymmetry of Direct Photons in High Energy Nuclear Collisions,” Phys. Rev. Lett. 96, 032303 (2006).
- Chatterjee et al. (2006) R. Chatterjee, E. S. Frodermann, U. Heinz, and D. K. Srivastava, “Elliptic Flow of Thermal Photons in Relativistic Nuclear Collisions,” Phys. Rev. Lett. 96, 202302 (2006).
- Chatterjee and Srivastava (2009) R. Chatterjee and D. K. Srivastava, “Elliptic flow of thermal photons and formation time of the quark gluon plasma at energies available at the BNL Relativistic Heavy Ion Collider (RHIC),” Phys. Rev. C 79, 021901 (2009).
- Dusling (2010) K. Dusling, “Photons as a viscometer of heavy ion collisions,” Nucl. Phys. A 839, 70 (2010).
- van Hees et al. (2011) H. van Hees, C. Gale, and R. Rapp, “Thermal photons and collective flow at energies available at the BNL Relativistic Heavy-Ion Collider,” Phys. Rev. C 84, 054906 (2011).
- Linnyk et al. (2014) O. Linnyk, W. Cassing, and E. L. Bratkovskaya, “Centrality dependence of the direct-photon yield and elliptic flow in heavy-ion collisions at =200 GeV,” Phys. Rev. C 89, 034908 (2014).
- Gale et al. (2015) C. Gale, Y. Hidaka, S Jeon, S. Lin, J.-F. Paquet, R. D. Pisarski, D. Satow, V. V. Skokov, and G. Vujanovic, “Production and Elliptic Flow of Dileptons and Photons in a Matrix Model of the Quark-Gluon Plasma,” Phys. Rev. Lett. 114, 072301 (2015).
- Muller et al. (2014) B. Muller, S.-Y. Wu, and D.-L. Yang, “Elliptic flow from thermal photons with magnetic field in holography,” Phys. Rev. D 89, 026013 (2014).
- Shen et al. (2014) C. Shen, U. Heinz, J.-F. Paquet, and C. Gale, “Thermal photons as a quark-gluon plasma thermometer revisited,” Phys. Rev. C 89, 044910 (2014).
- Shen et al. (2015a) C. Shen, U. Heinz, J.-F. Paquet, I. Kozlov, and C. Gale, “Anisotropic flow of thermal photons as a quark-gluon plasma viscometer,” Phys. Rev. C 91, 024908 (2015a).
- van Hees et al. (2015) H. van Hees, M. He, and R. Rapp, “Pseudo-critical enhancement of thermal photons in relativistic heavy-ion collisions?” Nucl. Phys. A 933, 256 (2015), and private communication.
- Monnai (2014) A. Monnai, “Thermal photon with slow quark chemical equilibration,” Phys. Rev. C 90, 021901 (2014).
- Chatterjee et al. (2013) R. Chatterjee, H. Holopainen, I. Helenius, T. Renk, and K. J. Eskola, “Elliptic flow of thermal photons from an event-by-event hydrodynamic model,” Phys. Rev. C 88, 034901 (2013).
- Dion et al. (2011) M. Dion, J.-F. Paquet, B. Schenke, C. Young, S. Jeon, and C. Gale, “Viscous photons in relativistic heavy ion collisions,” Phys. Rev. C 84, 064901 (2011).
- Liu and Liu (2014) F.-M. Liu and S.-X. Liu, “Quark-gluon plasma formation time and photons from heavy ion collisions,” Phys. Rev. C 89, 034906 (2014).
- Vujanovic et al. (2014) G. Vujanovic et al., “Probing the early-time dynamics of relativistic heavy-ion collisions with electromagnetic radiation,” Nucl. Phys. A 932, 230 (2014).
- McLerran and Schenke (2014) L. McLerran and B. Schenke, “The Glasma, photons and the implications of anisotropy,” Nucl. Phys. A 929, 71 (2014).
- Tuchin (2013) K. Tuchin, “Electromagnetic radiation by quark-gluon plasma in a magnetic field,” Phys. Rev. C 87, 024912 (2013).
- McLerran and Schenke (2016) L. McLerran and B. Schenke, “A Tale of Tails: Photon Rates and Flow in Ultra-Relativistic Heavy Ion Collisions,” Nucl. Phys. A 946, 158 (2016).
- Basar et al. (2012) G. Basar, D. E. Kharzeev, and V Skokov, “Conformal Anomaly as a Source of Soft Photons in Heavy Ion Collisions,” Phys. Rev. Lett. 109, 202303 (2012).
- Gelis et al. (2004) F. Gelis, H. Niemi, P. V. Ruuskanen, and S. S. Rasanen, “Photon production from non-equilibrium QGP in heavy-ion collisions,” J. Phys. G 30, S1031 (2004).
- Biro et al. (2014) T. S. Biro, Zs. Szendi, and Zs. Schram, “Illusory Flow in Radiation from Accelerating Charge,” Eur. Phys. J. A 50, 62 (2014).
- (30) Y. Hidaka, S. Lin, R. Pisarski, and D. Satow, “Dilepton and photon production in the presence of a nontrivial Polyakov loop,” J. High Energy Phys. 10 (2015) 005.
- Campbell (2015) S. Campbell, “Photon production from gluon-mediated quark–anti-quark annihilation at confinement,” Phys. Rev. C 92, 014907 (2015).
- Allen et al. (2003) M. Allen et al., “PHENIX Inner Detectors,” Nucl. Inst. Methods Phys. Res., Sect. A 499, 549 (2003).
- Anderson et al. (2011) W. Anderson et al., “Design, construction, operation and performance of a Hadron Blind Detector for the PHENIX experiment,” Nucl. Inst. Methods Phys. Res., Sect. A 646, 35 (2011).
- Adcox et al. (2003) K. Adcox et al., “PHENIX Central Arm Tracking Detectors,” Nucl. Inst. Methods Phys. Res., Sect. A 499, 489 (2003).
- Aizawa et al. (2003) M. Aizawa et al., “PHENIX Central Arm Particle I.D. Detectors,” Nucl. Inst. Methods Phys. Res., Sect. A 499, 508 (2003).
- Aphecetche et al. (2003) L. Aphecetche et al., “The PHENIX Calorimeter,” Nucl. Inst. Methods Phys. Res., Sect. A 499, 521 (2003).
- Afanasiev et al. (2012) S. Afanasiev et al. (PHENIX Collaboration), “Measurement of Direct Photons in Au+Au Collisions at GeV,” Phys. Rev. Lett. 109, 152302 (2012).
- Adare et al. (2008) A. Adare et al., “Suppression Pattern of Neutral Pions at High Transverse Momentum in Au+Au Collisions at GeV and Constraints on Medium Transport Coefficients,” Phys. Rev. Lett. 101, 232301 (2008).
- Richardson et al. (2011) E. Richardson et al., “A reaction plane detector for PHENIX at RHIC,” Nucl. Inst. Methods Phys. Res., Sect. A 636, 99 (2011).
- Poskanzer and Voloshin (1998) A. M. Poskanzer and S. A. Voloshin, “Methods for analyzing anisotropic flow in relativistic nuclear collisions,” Phys. Rev. C 58, 1671 (1998).
- Adare et al. (2013) A. Adare et al. (PHENIX Collaboration), “Azimuthal anisotropy of and mesons in Au+Au collisions at GeV,” Phys. Rev. C 88, 064910 (2013).
- Adare et al. (2016) A. Adare et al. (PHENIX Collaboration), “Measurement of the higher-order anisotropic flow coefficients for identified hadrons in AuAu collisions at GeV,” Phys. Rev. C 93, 051902 (2016).
- Adare et al. (2012b) A. Adare et al. (PHENIX Collaboration), “Deviation from quark-number scaling of the anisotropy parameter of pions, kaons, and protons in Au+Au collisions at = 200 GeV,” Phys. Rev. C 85, 064914 (2012b).
- Adare et al. (2007) A. Adare et al., “Scaling Properties of Azimuthal Asymmetry in Au+Au and Cu+Cu Collisions at GeV,” Phys. Rev. Lett. 98, 162301 (2007).
- Adler et al. (2007) S. S. Adler et al. (PHENIX Collaboration), “Measurement of Direct Photon Production in + Collisions at GeV,” Phys. Rev. Lett. 98, 012002 (2007).
- Ryu et al. (2015) S. Ryu, J. F. Paquet, C. Shen, G. S. Denicol, B. Schenke, S. Jeon, and C. Gale, “The importance of the bulk viscosity of QCD in ultrarelativistic heavy-ion collisions,” Phys. Rev. Lett. 115, 132301 (2015).
- Paquet et al. (2016) J.-F. Paquet, C. Shen, G. S. Denicol, M. Luzum, B. Schenke, S. Jeon, and C. Gale, “The production of photons in relativistic heavy-ion collisions,” Phys. Rev. C 93, 044906 (2016), and private communication J.-F. Paquet.
- Shen et al. (2015b) C. Shen, J.-F. Paquet, U. Heinz, and C. Gale, “Photon Emission from a Momentum Anisotropic Quark-Gluon Plasma,” Phys. Rev. C 91, 014908 (2015b).
- Linnyk et al. (2015) O. Linnyk, V. Konchakovski, T. Steinert, W. Cassing, and E. L. Bratkovskaya, “Hadronic and partonic sources of direct photons in relativistic heavy-ion collisions,” Phys. Rev. C 92, 054914 (2015), and private communication.