The Surface Diffusion Length of Water Molecules on Faceted Ice:
A Reanalysis of “Roles of Surface/Volume Diffusion
in the Growth Kinetics of Elementary Spiral Steps
on Ice Basal Faces Grown from Water Vapor,”
by Asakawa et al.
Kenneth G. Libbrecht
Department of Physics, California Institute of Technology
Pasadena, California 91125
Abstract. We reanalyzed the measurements made by Asakawa et al. [1] of the growth velocities of single-molecule-high steps on basal ice surfaces, as we believe the authors made a number of incorrect assumptions regarding ice growth parameters and bulk diffusion in their experiments. Applying what we believe are more accurate assumptions, we used the data in [1] to derive a surface diffusion length of nm for water molecules on basal ice surfaces at C, about 500 times lower than what was reported in [1]. Moreover, in our analysis we found that no information about the height of the Ehrlich-Schwoebel barrier could be obtained from these measurements.
1 Introduction
In [1], the authors describe a series of remarkable measurements of the growth velocities of single-molecule-high steps on a basal ice surface at C. Specifically, they measured the step velocity for a series of what can be approximated as equally spaced steps, as a function of the spacing between steps. They also measured as a function of the water vapor supersaturation at a ice-coated reference surface that served as a water vapor source. The experiments were conducted in air at normal atmospheric pressure.
In their analysis of these measurements, the authors found that the surface diffusion length for water molecules on a faceted basal surface was m, and they found that the attachment coefficient for water molecules on the basal surface near a step was At low they measured the step kinetic coefficient (defined by was m/sec.
As described below, we believe that the authors substantially underestimated the effects of bulk diffusion (of water molecules through the air) in the analysis of their measurements. We also believe that the attachment coefficient they derived is strongly inconsistent with a number of other measurements that reported for the same quantity. We therefore reanalyzed the data in [1] using what we believe is an improved treatment of bulk diffusion, along with more realistic assumptions regarding
2 Diffusion Analysis
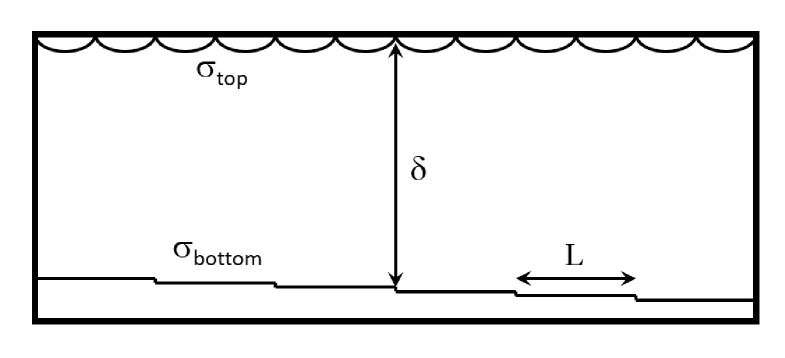
Consider the idealized experimental system shown in Figure 1, which is similar to that described in the data analysis section in [1] (specifically the analysis described in Equations 1 through 11 in [1]). We assume a constant supersaturation at the top surface of this simplified growth chamber (with the supersaturation being measured relative to the temperature of the bottom surface), and we assume that the bottom surface consists of a single faceted basal ice surface containing a series of one-molecule-high steps with spacing As in [1], the step velocity can be written
| (1) |
where is the size of a water molecule and is the average perpendicular growth velocity of the faceted surface.
Using a slightly different notation from [1] (defined in detail in [2]), solving the diffusion equation in this simplified one-dimensional geometry gives
| (2) |
which is equivalent to Equation 5 in [1]. As in [1], we estimate m as a reasonable model of the idealized system, as this is roughly equal to the size of, and spacing between, the numerous test crystals on the sample surface.
We simplify the analysis slightly relative to [1] by writing as [2]
| (3) |
where is the diffusion length and is the attachment coefficient for water molecules striking the ice surface near the step (on the lower terrace), specifically at distances small compared to This is essentially equivalent to Equation 7 in [1], but in the limit
At this point our analysis begins to differ substantially from that in [1]. First, we expect that at the top of the idealized box in Figure 1 is much smaller than the supersaturation calculated at the distant vapor reservoir in the experiment. (In [1], ). Second, we expect that compared to the value reported in Figure 10 in [1]. Needless to say, these are large differences in our assumptions pertaining to the same experimental data, which leads us to much different conclusions regarding the surface diffusion length. We proceed by examining these assumptions in more detail.
2.1 The near-surface supersaturation
Consider first an estimate of Our idealized box is quite small, with m, so really represents the supersaturation quite near the test crystals. As described in the Supporting Information associated with [1], the sample surface is several millimeters in size and is covered with a large number of growing ice crystals, some of which are unobserved, and many of the ice crystals on the sample surface are likely not completely faceted. In addition, the ice crystals making up the vapor reservoir are about 16 mm away from the test crystals, in a test chamber with a somewhat complex geometry. The vapor pressure defined in [1] is the vapor pressure at the vapor reservoir, which is not the same as the vapor pressure just above the sample surface. The large number of crystals on the sample surface all act as sinks, reducing the vapor pressure relative to As stated in [1], “the existence of many crystals and a small amount of nonfaceted faces made precise analysis of a volume diffusion field of water vapor impossibly difficult.” We agree with this statement, and it means that the value of (essentially the value of at a height above a single faceted test crystal surface) is difficult to determine. We would add that the geometry of the test chamber, together with the large number of crystals on the sample surface, suggests that is much smaller than .
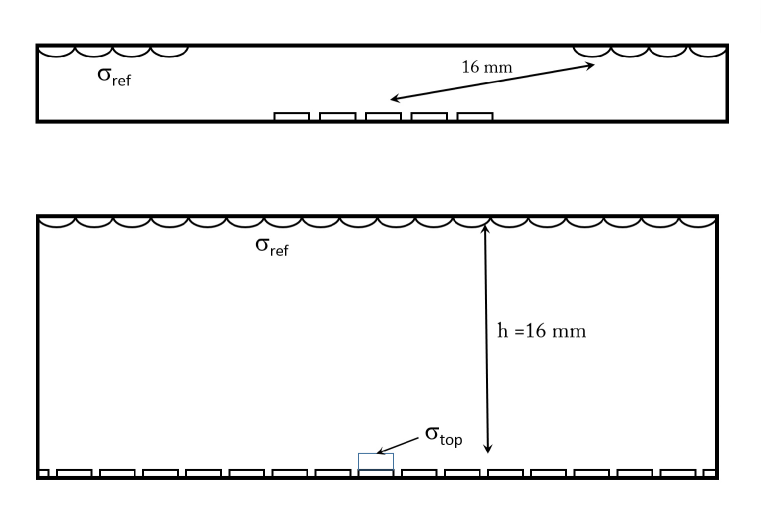
We can examine the bulk diffusion problem further by embedding the tiny idealized test chamber in Figure 1 inside a much larger chamber shown in Figure 2, which better represents the actual experimental chamber geometry described in detail in the Supporting Information associated with [1]. For we assume a value of 16 mm from [1], so now we see that is essentially the supersaturation just above a large field of growing test crystals. Performing a diffusion analysis similar to that above gives
where is a correction factor to account for the nontrivial geometry of the test chamber compared to the more open geometry shown in the lower sketch in Figure 2. Also is defined by so is essentially the area-averaged attachment coefficient of all the crystals on the sample surface, including nonfaceted areas.
Rearranging Equation 2.1 gives
| (5) |
where
In the most likely case that (assuming there are a substantial number of nonfaceted ice crystals on the sample surface, as the authors describe) Equation 5 simplifies to
| (6) |
Unfortunately, we have no good way to estimate . In ice-free regions and on perfectly faceted ice surfaces, we expect while nonfaceted regions would give All growing ice surfaces must contain some molecular steps, and each step contributes to increasing Assuming a fraction of surfaces and gives , but this is just a very rough estimate. As stated in [1], determining with greater accuracy is “impossibly difficult” without a better defined experimental arrangement. However, our estimate that is much smaller than is certainly consistent with, and expected from, the experimental details presented in [1].
2.2 The attachment coefficient
In [1] the authors mention that their derived values of are much smaller than the values of found in two references. We would add that the measurements in [3] are substantially improved over the older references, giving on basal surfaces in the absence of a nucleation barrier. We note also that there is no nucleation barrier for molecules impinging near a molecular step. We disagree with the statement in [1] that “there is no value of that can be directly compared with ours.” The different experiments are all measuring essentially the same so they can all be compared, and the preponderance of evidence supports . Moreover, a value of in the absence of a nucleation barrier would imply ice crystal growth velocities that are orders of magnitude below what are commonly observed; the growth of an ordinary snowflake would take weeks with such a low attachment coefficient!
3 An Improved Model
Assuming that the above conclusions are essentially correct, we begin with the assumptions that and and from these reinterpret the measurements presented in [1]. Going back to the idealized growth chamber in Figure 1, we can rearrange Equations 2 and 3 to obtain
| (7) |
Taking gives the velocity of an isolated step, and when
| (8) |
Using the 329 Pa data in [1], we take m along with our assumptions of m and to obtain nm, 500 times smaller than the m obtained in [1]. Moreover we see that depends on so there is a substantial uncertainty in our derived that depends on the uncertainties in our solution of the bulk diffusion equation in the experimental chamber. In a nutshell, the complex geometry of the experimental chamber does not allow a very accurate measure of owing to bulk diffusion effects. We estimate that our value of nm is perhaps only accurate to a factor of three.
Because we find this means that at the ice surface near the growing step is nearly equal to what we called above. In other words, bulk diffusion does not substantially lower the supersaturation at the surface of 10-nm features, relative to the supersaturation just above these features. This can be verified to a reasonable approximation using the analytic solution of the diffusion equation for an infinitely long growing cylinder [4]. This verifies Equation 3 above.
3.1 A consistency check
To many it seems counterintuitive that covering 0.1 percent of an area with surface (0.1 percent because , while leaving the remaining 99.9 percent with would reduce the supersaturation by a factor of two. To see that this is indeed reasonable, we again rearrange Equations 2 and 3 to obtain
| (9) |
where
| (10) |
In the limit of large (no molecular steps) we have and as expected. But if surfaces cover just a fraction of the surface, then and Thus even a quite simple diffusion analysis supports our result of
3.2 A second consistency check
3.3 A third consistency check
We can also consider the case of very low With slow growth of the test crystals, one expects essentially all exposed surfaces to become faceted, greatly reducing in Equation 5, to the point that throughout the growth chamber. In this case Equation 3 becomes
| (12) |
so (defined in [1]) becomes
This is an upper limit, however, since is smaller if is even slightly greater than zero. Thus a small residual in the experiment could easily explain the measured m/sec presented in [1].
The measured change in with at higher (Figure 7 in [1]) can be similarly understood by considering how increases with As increases from zero, the faceted crystals begin to grow, so steps emerge on their surfaces, increasing and decreasing following Equation 6. Soon the ice growth becomes strongly diffusion limited, resulting in non-flat surfaces with quite large , thus reducing the slope to the degree shown in Figure 7 in [1].
4 Conclusions
We have reanalyzed the data presented in [1], and our analysis yields a surface diffusion length nm for water molecules on a basal ice surface at C. Our analysis assumed from the outset, a value that is indicated by several other ice growth experiments, while we rejected the extraordinarily low value reported in [1]. Essentially all of the data presented in [1] can be explained in a reasonable and self-consistent way using our model, as described above. Moreover, our model does not distinguish whether admolecules are attaching to the step from the upper or lower terrace, or both. Thus we find that the step velocity measurements provide no useful information about the height of the Ehrlich-Schwoebel barrier, contrary to what was concluded in [1].
It has long been known, and was recently demonstrated with improved accuracy in [3], that growing small, isolated, faceted crystals in a near-vacuum environment reduces the effects of bulk diffusion to much more manageable levels, thus better revealing molecular kinetic effects. Measuring the growth velocities of one-molecule-high steps in such an experimental system would be a welcome next step toward understanding the fundamental physics of ice growth dynamics.
References
- [1] H. Asakawa, G. Sazaki, and et al. Roles of surface/volume diffusion in the growth kinetics of elementary spiral steps on ice basal facets grown from water vapor. Cryst. Growth and Design, (14):3210–3220, 2014.
- [2] K. G. Libbrecht. The physics of snow crystals. Rep. Prog. Phys., 68:855–895, 2005.
- [3] Kenneth G. Libbrecht and Mark E. Rickerby. Measurements of surface attachment kinetics for faceted ice crystal growth. J. Crystal Growth, (377):1–8, 2013.
- [4] Kenneth G. Libbrecht. Quantitative modeling of faceted ice crystal growth from water vapor using cellular automata. J. Computational Methods in Phys., (ID-174806), 2013.