Heterogeneity in 12CO/13CO Ratios Toward Solar-type Young Stellar Objects
Abstract
This study reports an unusual heterogeneity in [12C16O]/[13C16O] abundance ratios of carbon monoxide observed in the gas phase toward seven solar-mass YSOs and three dense foreground clouds in the nearby star-forming regions, Ophiuchus, Corona Australis, Orion, Vela and an isolated core, L43. Robust isotope ratios were derived using infrared absorption spectroscopy of the 4.7 m fundamental and 2.3 m overtone rovibrational bands of CO at very high resolution (/), observed with the CRIRES spectrograph on the Very Large Telescope. We find [12C16O]/[13C16O] values ranging from 85 to 165, significantly higher than those of the local interstellar medium ( to 69). These observations are evidence for isotopic heterogeneity in carbon reservoirs in solar-type YSO environments, and encourage the need for refined Galactic chemical evolution models to explain the 12C/13C discrepancy between the solar system and local ISM. The oxygen isotope ratios are consistent with isotopologue-specific photodissociation by CO self-shielding toward the disks, VV CrA N and HL Tau, further substantiating models predicting CO self-shielding on disk surfaces. However, we find that CO self-shielding is an unlikely general explanation for the high [12C16O]/[13C16O] ratios observed in this study. Comparison of the solid CO against gas-phase [12C16O]/[13C16O] suggests that interactions between CO ice and gas reservoirs need to be further investigated as at least a partial explanation for the unusually high [12C16O]/[13C16O] observed.
Subject headings:
astrochemistry — protoplanetary disks — stars: solar-type — stars: protostars — infrared: stars — molecular processes1. Introduction
Observations of carbon monoxide (CO) provide a robust window into circumstellar chemistry. Due to the large percentage of carbon ( to ) and oxygen () tied up in CO in the early stages of young stellar object (YSO) formation (Dickman, 1978), CO is a valuable tracer of chemical inheritance from the envelope to the disk in solar-type YSOs. The use of high-resolution spectroscopy to observe CO at infrared wavelengths enables high-precision investigations of isotope fractionation in both oxygen and carbon toward YSOs in embedded and disk-phase evolutionary stages, and is consequently an important tool for connecting the solar system to currently forming protoplanetary systems. Examples include observational studies toward diffuse clouds and inferring isotopologue-specific photodissociation by CO self-shielding as a potentially important mechanism of carbon isotope fractionation in CO in the interstellar medium (Bally & Langer, 1982; Sheffer et al., 2002). Further, high-resolution near-infrared observations of the CO rovibrational band toward protoplanetary disks (Brittain et al., 2005; Smith et al., 2009) and protostellar envelopes have recently revealed signatures in CO isotopologue ratios that are consistent with CO self-shielding, with precision sufficiently high for comparison to meteoritic data (Smith et al., 2009).
Observations of isotope ratios toward YSOs and, where possible, their parent clouds, are valuable in assessing theorized similarities between circumstellar envelopes, disks and dense clouds local to their origin. This is important not only for evaluating predictions of galactic chemical evolution (GCE) models that are constrained by solar system abundances, but also for characterizing the range of carbon isotope ratios toward YSOs varying with evolutionary stage, and establishing accurate astrochemical constraints on protoplanetary environments. Observational studies can help demonstrate whether there are significant isotopic differences or trends between diffuse clouds, dense molecular clouds, and YSOs. These in turn help construct explanations for apparent chemical anomalies, such as the 12C/13C solar system-interstellar medium (ISM) discrepancy and solar system oxygen isotope anomaly.
This paper focuses on the carbon isotopic systems in YSOs as traced by high-resolution observations of CO isotopologues, with additional mention of significant findings in oxygen isotopes. Current measurements of the 12C/13C ratio for the solar system are to 89, derived from photospheric models applied to the solar CO spectrum (Scott et al., 2006), and bulk solar system materials (Rosman & Taylor, 1998; Wilson, 1999; Coplen et al., 2002; Clayton & Nittler, 2004; Young et al., 2011). Values of 12C/13C for the solar system have been consistently higher than those of to 69 observed toward the local ISM, measured using millimeter to sub-millimeter rotational transitions of various carbon-bearing molecules, CO, CN, CH+, and H2CO (Langer & Penzias, 1993; Wilson, 1999; Milam et al., 2005; Casassus et al., 2005). The apparent discrepancy in 12C/13C between the solar system and ISM has been attributed to GCE leading to enrichment of 13C relative to 12C over the Gyr lifetime of the solar system (e.g. Milam et al., 2005; Prantzos et al., 1996). An important property of GCE models is the assumption that the solar system records the chemical state of the molecular cloud material Gyr ago. That is, the assumption that the solar nebula was isotopically representative of its parent cloud at its Galactic radius at the time of formation should also hold for present-day solar-type YSOs.
The challenge for observational comparisons of solar system isotope ratios in general is the need for high precision in molecular abundance measurements. While techniques using strong rotational lines in the millimeter/sub-millimeter range often involve model-dependent comparisons between optically thick and thin lines, high-resolution infrared spectrographs have enabled significant breakthroughs in observations of nearby YSOs. Infrared absorption spectroscopy of optically thin CO lines allows for precise column density measurements along pencil-beam lines-of-sight, enabling the derivation of precise column densities and isotope ratios from the line profiles of as many as four currently observable CO isotopologues (12C16O, 13C16O, 12C18O, 12C17O). Robust isotope ratios so derived can be compared with statistical significance to sub-millimeter ISM values, solar abundances, and meteoritic oxygen. A high degree of precision (within ) on the absolute values of the column densities has been demonstrated for the four most common CO isotopologues (Smith et al., 2009). The study reported here builds on this work.
Our targets span a range in 12C16O ice optical depth, from nearly saturated to undetected, providing an opportunity to investigate a potential observational connection between the CO ice and gas reservoirs by comparing the gas-phase [12C16O]/[13C16O] to the CO ice column along a single line-of-sight. Since solids tend to concentrate the heavy isotope, relative ice-gas partioning may lead to a paucity of 13C (or excess of 12C) in the gas phase, with the opposite signature sequestered in the ice.
2. Observations
Data for all targets were obtained as part of a European Southern Observatory Large Program (Pontoppidan et al., 2011b) to observe YSOs and protoplanetary disks with the Cryogenic Infrared Echelle Spectrograph (CRIRES) at the Very Large Telescope (VLT) in Chile. The CRIRES instrument is an adaptive optics (AO)-assisted spectrometer that operates at very high resolving power (/ 95,000).
| Target | RegionaaThe evolutionary stage refers to the system proposed by Robitaille et al. (2006). The two targets with N/S components are 1-2″binaries, for which the secondary is a highly extincted “infrared companion” (Koresko et al., 1997). | Distance | CommentsaaThe evolutionary stage refers to the system proposed by Robitaille et al. (2006). The two targets with N/S components are 1-2″binaries, for which the secondary is a highly extincted “infrared companion” (Koresko et al., 1997). |
|---|---|---|---|
| (pc) | |||
| DoAr24E S,N | Oph | 125 | Stage II/IR companion |
| IRS 43 | Oph | 125 | Stage I |
| IRS 51 | Oph | 125 | Extincted stage II |
| IRS 63bbIRS 63 may be formed from an isolated core (Ridge et al., 2006). | Oph | 125 | Stage I |
| RNO 91 | L43 | 125 | Stage I |
| VV CrA N,S | CrA | 130 | Stage II/IR companion |
| HL Tau | Tau | 140 | Stage I |
| Reipurth 50 | Ori | 470 | Stage I/FU Ori |
| LLN 19 | Vel | 700 | Stage I |
Note. —
2.1. Strategy
Targets tracing high column densities of molecular gas were selected based on evidence of deep CO absorption lines at 4.7 m in spectra obtained with VLT-ISAAC (Pontoppidan et al., 2003) and Keck-NIRSPEC (e.g., Boogert et al., 2002b). Selected targets were observed by CRIRES in the CO overtone () band at 2.3 m and the fundamental () band at 4.7 m. Because the overtone transitions are weaker than those of the fundamental band by a factor of , the former are typically optically thin for 12C16O, thereby enabling the precise measurement of column densities for this molecule. The spectra of the fundamental rovibrational bands were obtained using the slit, resulting in a resolving power of (corresponding to 3.2 km s-1). Several settings in the fundamental band were obtained for all targets in order to probe a range of rotational levels for 13C16O, 12C18O and 12C17O, spanning to at least . Observations were timed such that the Doppler shifts of the targets relative to the Earth’s atmosphere were at least 20 km s-1 due to a combination of the intrinsic target velocity and reflex motion of the Earth. As a consequence, telluric CO lines are typically not affecting the absorption lines of the targets.
| Target | RA | Dec | Spectral Range | Obs. Date |
|---|---|---|---|---|
| (J2000) | (J2000) | (m) | (UT) | |
| DoAr24E S,NaaThe non-coevality of these observations may contribute some level of uncertainty to the derived isotopic abundances, as discussed in the text. | 16 26 23.36 | -24 20 59.8 | 2007-09-02 | |
| 2010-03-18 | ||||
| IRS 43 | 16 27 26.94 | -24 40 50.8 | 2008-08-05 | |
| 2008-08-04 | ||||
| IRS 51 | 16 27 39.83 | -24 43 15.1 | 2008-08-02 | |
| 2008-08-03 | ||||
| IRS 63aaThe non-coevality of these observations may contribute some level of uncertainty to the derived isotopic abundances, as discussed in the text. | 16 31 35.65 | -24 01 29.3 | 2007-04-25 | |
| 2008-08-07 | ||||
| RNO 91 | 16 34 29.28 | -15 47 01.5 | 2010-03-18 | |
| 2010-04-08 | ||||
| VV CrA N,S | 19 03 06.74 | -37 12 49.7 | 2007-08-31 | |
| 2007-08-31 | ||||
| HL Tau | 04 31 38.44 | 18 13 57.7 | 2010-01-30 | |
| 2010-01-28 | ||||
| Reipurth 50 | 05 40 27.70 | -07 27 28.0 | 2007-10-11 | |
| 2007-10-17 | ||||
| LLN 19 | 08 48 48.00 | -43 32 25.0 | 2007-04-25 | |
| 2007-04-25 |
Note. —
Table 1 summarizes the region, distance and evolutionary stage of the observed targets, listed in order of increasing distance from the local solar neighborhood ( kpc). Specific observing parameters are listed in Table 2. Selected targets probe a range of circumstellar environments, as noted. Because the lines-of-sight traced by infrared absorption may pass through the upper layers of an inclined disk as well as through envelope material and a foreground molecular cloud unrelated to the YSO, some portion of each of these environments may be represented in the integrated spectra, depending on the target. For instance, near-infrared absorption spectra observed toward the extincted protoplanetary disk, IRS 51, will be an integrated sight line consisting mostly of the foreground Ophiuchus ridge and a relatively small contribution of the protoplanetary disk. This geometry has been predicted by interferometric observations (van Kempen et al., 2009) and is supported by our observations that reveal cold-only gas lines.
2.2. Data reduction
The CRIRES spectra were reduced using standard procedures for infrared echelle spectroscopy, including flat-field correction, adjustments to account for detector non-linearity, and linearization of the spectral traces in dispersion- and cross-dispersion directions. The spectra were optimally extracted, wavelength-calibrated using the telluric absorption lines referenced to an atmospheric model spectrum, and transformed to the local standard-of-rest frame. Relative flux calibration was carried out by dividing the targets by observations of early-type telluric standards observed immediately surrounding observations of the science target at the same airmass. The division was optimized by modifying the telluric spectra to account for any difference in grating angle, airmass, and spectral resolving power. To aid in the measurement of any intrinsic line broadening, the resolving powers for each science spectrum were measured from telluric spectra to within an accuracy of km s-1, by fitting the “Reference Forward Model” (RFM111http://www.atm.ox.ac.uk/RFM, see also Section 3.2). Further details on CRIRES data processing is described in Pontoppidan et al. (2008, 2011a).
3. Methods and results
3.1. spectra
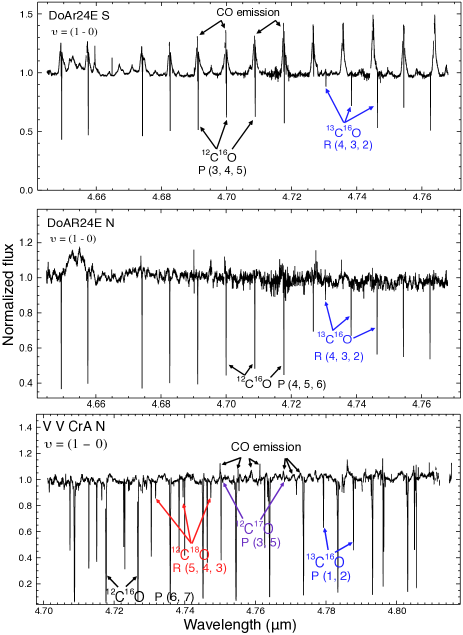
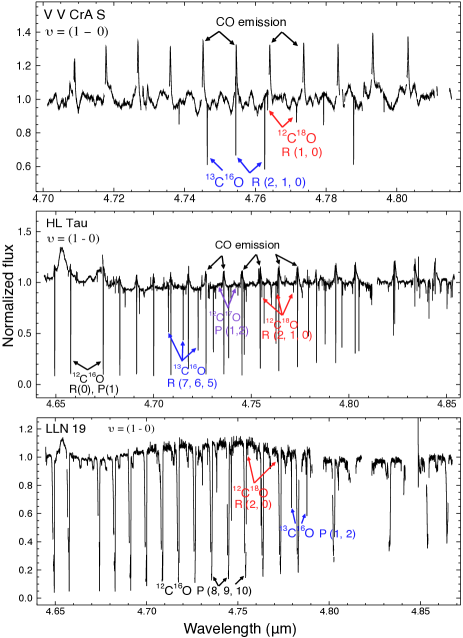
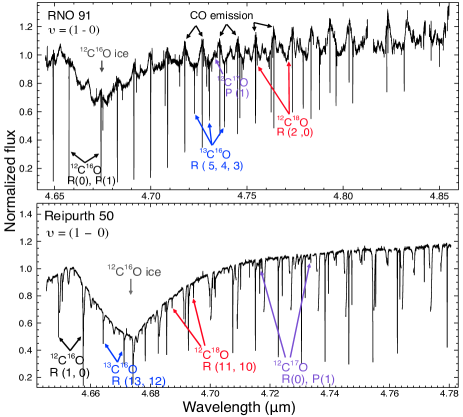
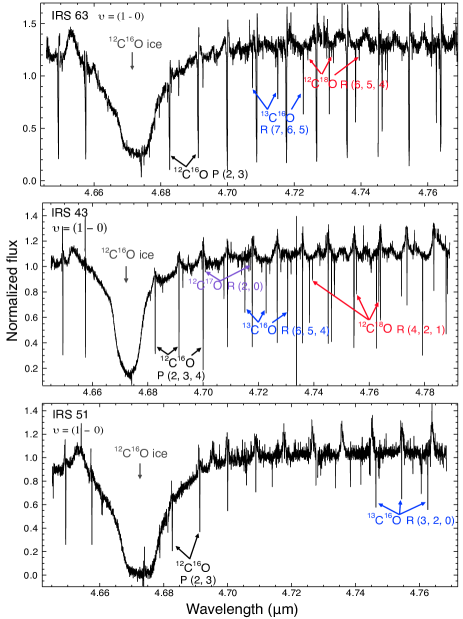
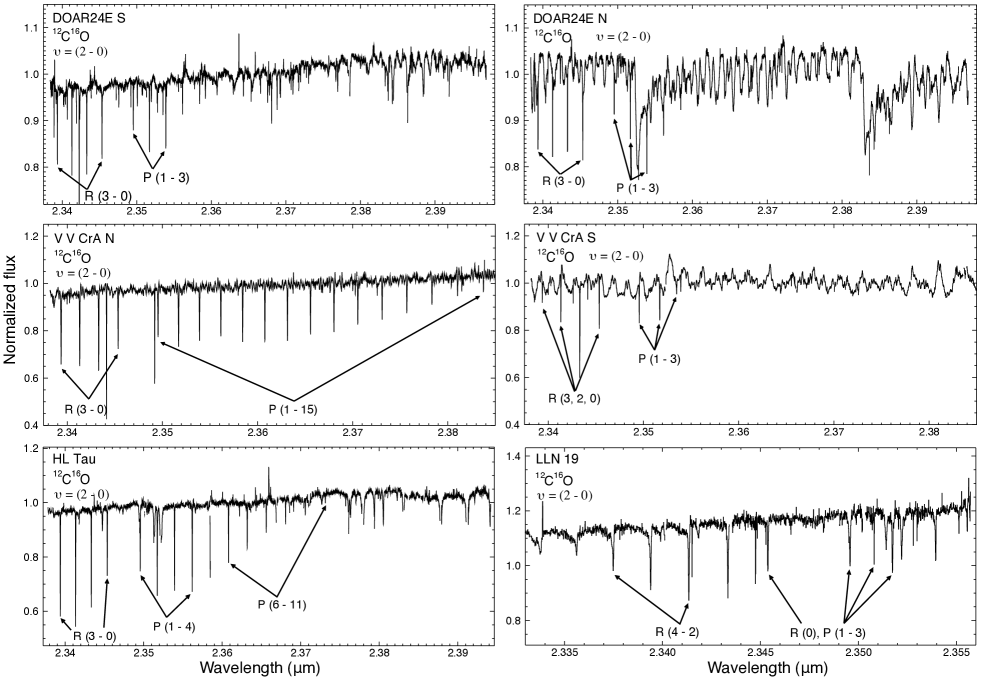
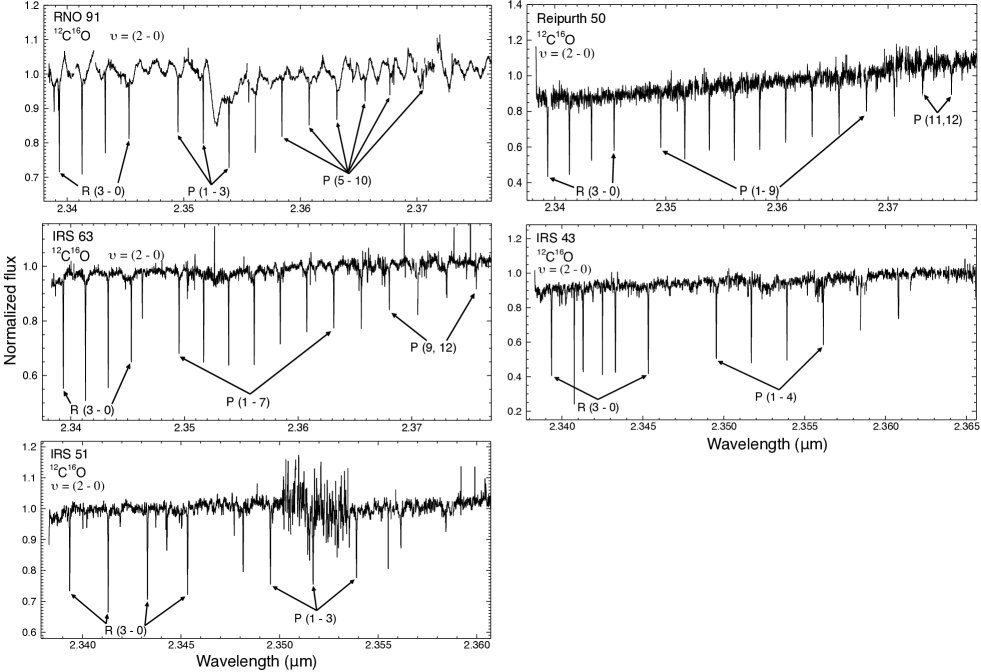
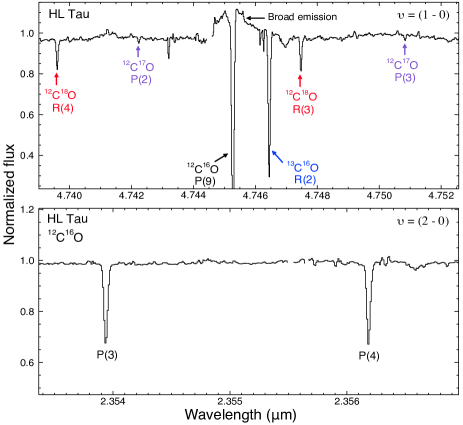
The fundamental and first-overtone rovibrational bands are shown for all targets in Figures 1 through 6, in ascending order of CO ice optical depths at m. A forest of narrow CO rovibrational absorption lines is seen to varying degrees in all spectra. A magnified spectral region of HL Tau is shown as a representative example of individual line profiles (Figure 7). Broad, complex CO emission is often seen in the spectra, and likely originates in the innermost (AU) regions of the disks (Herczeg et al., 2011). However, the emission does not interfere with the analysis, as it is much broader than the absorption, and is generally weak or absent in the rare isotopologue transitions. The potentially affected 12C16O lines are not used for column density measurements. Broad absorption observed toward several objects at (Figures 5, 6) likely originates in the stellar photosphere and is clearly separated from the narrow interstellar CO lines.
Temporal variation in [12CO]/[13CO] was found toward VV CrA S, with a [12CO]/[13CO] abundance ratio of when using a observation four months prior to the first-overtone , as compared to when coeval observations were used (errors are statistical 1 values). The possibility for temporal spectral variability should therefore be considered for DoAr24E and IRS 63, targets for which only non-coeval observations are available.
3.2. Derivation of column densities and isotopologue ratios
Total abundances for each isotopologue were derived by measuring the column density of CO in each observed rovibrational level of the ground vibrational state which, in turn, was obtained from the intrinsic optical depths at line center derived from a best-fit absorption line profile to each rovibrational transition. Individual column densities were used to make a best fit to a Boltzmann population, then summed over all levels. This method is described in detail in Smith et al. (2009).
| Target | FWHMinstrumentalaaThe instrumental broadening is measured by fitting an atmospheric model to unresolved telluric lines. The uncertainty is km s-1. These refined measurements of instrumental broadening account for the slight variation in results for VV CrA and Reipurth 50 as compared to (Smith et al., 2009). | FWHMintrinsicbbThe intrinsic velocity dispersion is the Gaussian FWHM before being convolved with the measured instrumental CRIRES broadening for the individual spectra. It is based on a weighted mean FWHM from a selection of 12C18O lines, unless otherwise noted. Uncertainties reflect the weighted means of the individual 12C18O line widths. | C16O) | C16O) | C18O) | C17O) | |
|---|---|---|---|---|---|---|---|
| (km s-1) | (km s-1) | (km s-1) | |||||
| DoAr24E S | 2.79 | 3.12 | – | ||||
| DoAr24E N | 2.79 | 3.12 | ccMean value from DoAr24E S 12C18O lines and . | – | |||
| VV CrA N | 2.82 | 3.49 | |||||
| VV CrA S | 2.82 | 3.49 | |||||
| HL Tau | 3.26 | 3.43 | |||||
| LLN 19 | 3.22 | 4.68 | – | ||||
| RNO 91 | 3.26 | 3.72 | |||||
| Reipurth 50 | 3.44 | 4.54 | |||||
| IRS 63 | 3.57 | 3.39 | |||||
| IRS 43 | 3.03 | 3.45 | |||||
| IRS 51 | 3.03 | 3.37 | ddThis width is estimated based 12C16O and 13C16O lines, since the source has very weak 12C18O lines. | – | – | ||
Note. —
The technique of using the line profiles to directly determine column densities takes advantage of the high spectral resolution of CRIRES to spectrally resolve the velocity dispersion of the individual CO lines. This in turn leads to greater precision than using unresolved lines which require a curve-of-growth analysis to derive intrinsic line widths (Mitchell et al., 1989, 1990, 1991; Sheffer et al., 1992; Mitchell & Maillard, 1993; Lambert et al., 1994; Sheffer et al., 2002; Federman et al., 2003; Goto et al., 2003; Brittain et al., 2005). With CRIRES, the resolving power is sufficiently high to partially resolve the intrinsic line profiles (FWHM), albeit marginally in some cases: VV CrA S, RNO 91, and IRS 43. Therefore, it is possible that the derived column densities toward these targets may be more uncertain.
| Isotopologue | Transition | ||
|---|---|---|---|
| (km s-1) | |||
| 12C16O | |||
| 12C16O | |||
| 12C16O | |||
| 12C16O | |||
| 12C16O | |||
| 12C16O | |||
| 12C16O |
Note. —
The measured instrumental broadening, intrinsic velocity dispersions and optical depth ranges for each observed isotopologue are shown in Table 3. Line-by-line optical depths and Doppler shifts for observed targets are available in the online version of this paper, with a sample partial line list shown in Table 4. Complete data tables are available in the online version of the paper222Complete data tables can be temporarily found at http://naturalsciences.org/data/apj2015.. Instrumental broadening values were modeled individually for each spectrum in its entirety, following the method in Seifahrt et al. (2010) for using an atmospheric model for telluric spectra. The Reference Forward Model (RFM; http://www.atm.ox.ac.uk/RFM/) code was used to derive a detailed fit to the individual telluric standard star spectra, with consideration of meteorological conditions at the time of observation. The atmospheric molecular parameters were taken from the HITRAN 2008 database (Rothman et al., 2009). There are small relative differences in resolving power between the standard stars and science targets due to differences in seeing or adaptive optics (AO) correction, but these differences were accurately measured and corrected for by minimizing the continuum residuals after telluric division.
Optimized intrinsic velocity dispersions were derived from the weighted mean of dispersions measured in individual 12C18O lines, assuming that both the intrinsic and instrumental profiles are well-approximated by Gaussian profiles. The 12C18O lines were used because this rare isotopologue is always optically thin, and therefore is not subjected to saturation line broadening, which may affect the more common 13CO isotopologue. Optical depths of the optically-thin 12C16O lines were similarly computed using the derived intrinsic broadening from the 12C18O lines. It can be noted that, even when the resolving power of the two spectral bands differed for a single target, we obtained good fits to lines in both bands under the reasonable assumption that the intrinsic profile width is independent of transition and isotopologue. Further, it is reasonable to use the same velocity dispersion parameter for a target with a two-temperature distribution of the data, since thermal contributions are very small contributors to the total intrinsic dispersion (0.077 and 0.242 km s-1 for 12C16O at 20 and 200 K, respectively).
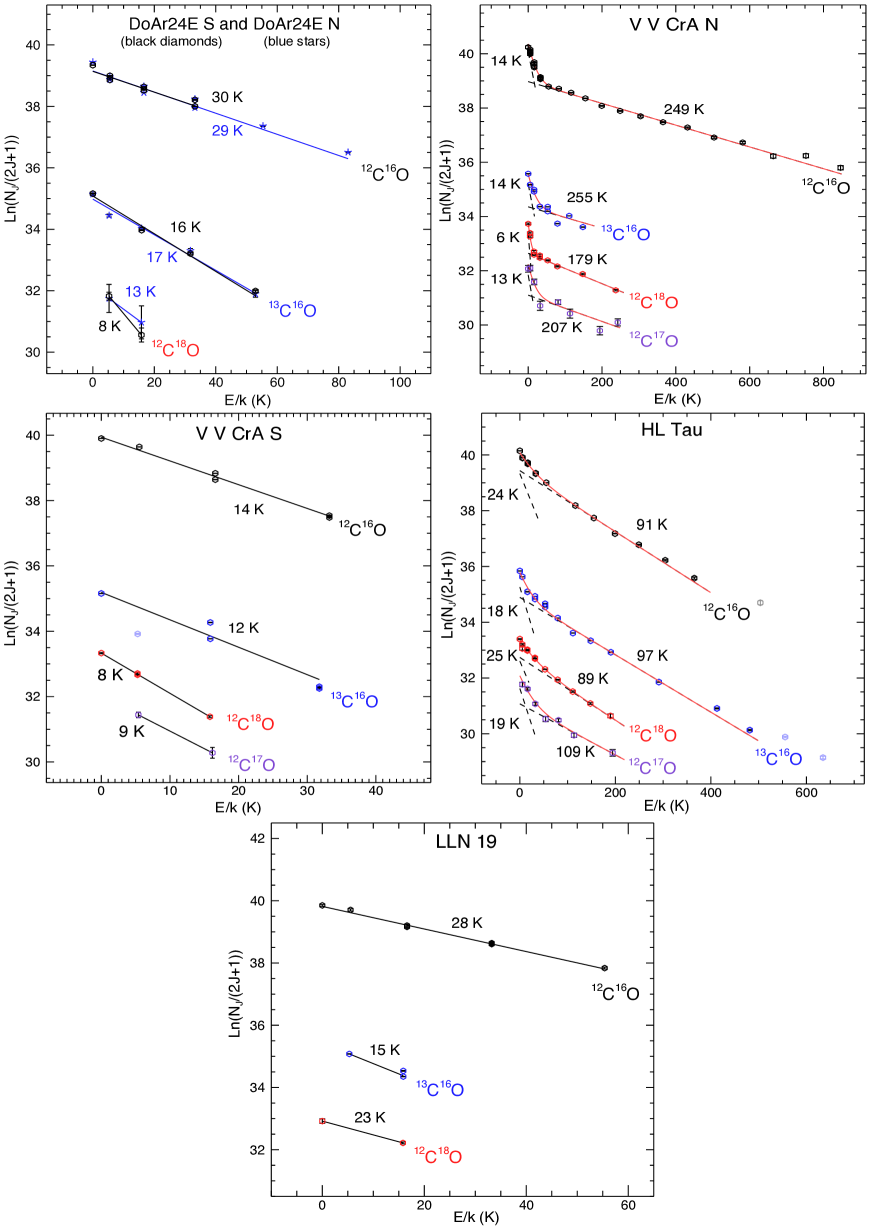
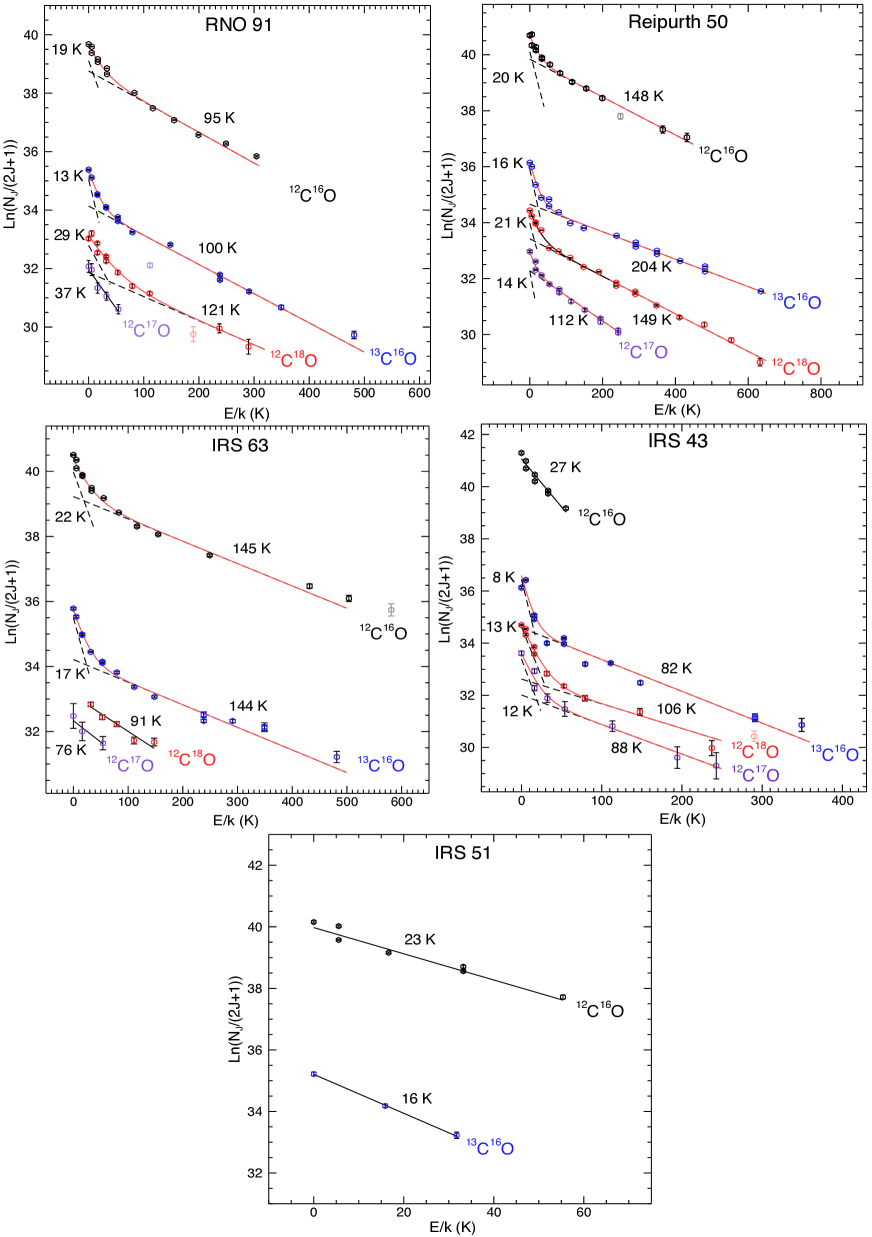
The rotational analyses for all targets are shown in Figures 8 and 9. Sub-level column densities, , derived from the fits to the absorption lines, are plotted against the energy, , of the rotational transition state, . For targets where cold gas dominates, a single-temperature model is sufficient to fit the data, while targets with absorption that includes higher- transitions are best fit with a two-temperature model, representing cold and warm environments along the line-of-sight, and allowing for different excitation temperatures for each isotopologue along a given line-of-sight. Derived isotopologue temperatures from the fits are shown in Table 5. High temperatures ( to 250 K) are roughly consistent with those of the inner parts of typical YSO envelopes, while low temperatures ( to 30 K) may trace outer envelopes or molecular cloud material in front of the YSOs. For lines-of-sight with no warm component, it is likely that the gas is from a foreground cloud not related to the YSO itself (DoAr24E N and S), VV CrA S, and IRS 51.
Total column densities and isotopologue ratios are shown in Table 6. Due to the dominance of higher- lines in targets with both low- and high-temperature lines, the higher-temperature ratios are generally better constrained within two-temperature environments (Smith et al., 2009).
Statistical errors on the column densities are generally found to be small, reflecting the very high signal-to-noise ratio of the data. For example, average signal-to-noise per pixel in the fundamental bands is . With an average CRIRES FWHM of 2.0 pixels, we retrieve average line errors of (1/()). First-overtone bands average . We therefore expect to know the column densities to a fraction of a percent, which is represented in our results. These errors do not take into account any potential systematic errors in extracting the line strengths and profiles due to inherent non-gaussianity of the line-fitting procedure, which we cannot quantify with certainty. However, to roughly estimate the magnitude of systematic retrieval errors, we carried out a small number of forward models with 2-dimensional radiative transfer models (RADLite, Pontoppidan et al., 2009) simulating synthetic CO isotopologue absorption spectra using a basic one-dimensional infalling envelope from Shu (1977). The synthetic spectra were convolved with the appropriate instrumental resolution and isotopologue ratios retrieved from the synthetic spectra using the same methods as for the observed data. In each case, we were able to reproduce the input ratios to better than 10%. We therefore estimate that model-dependent systematics add at most a 10% error to the retrieved isotopologue ratios, in addition to the statistical error.
| Target | ComponentaaThis is a partial table for DoAr24E S. Line-by-line tables for all observed targets are available in the online version of the paper, and can be temporarily found at http://naturalsciences.org/data/apj2015. | C16O) | C16O) | C18O) | C17O) |
|---|---|---|---|---|---|
| (K) | (K) | (K) | (K) | ||
| DoAr24E S | single | – | |||
| DoAr24E N | single | – | |||
| VV CrA N | high | ||||
| VV CrA N | low | ||||
| VV CrA S | single | ||||
| HL Tau | high | ||||
| HL Tau | low | ||||
| LLN 19 | single | – | |||
| RNO 91 | high | – | |||
| RNO 91 | low | ||||
| Reipurth 50 | high | ||||
| Reipurth 50 | low | ||||
| IRS 63 | high | ||||
| IRS 63 | low | – | – | ||
| IRS 43 | high | ||||
| IRS 43 | low | – | |||
| IRS 51 | single | – | – |
Note. — ††footnotetext: All uncertainties are statistical error derived from the rotational analysis.
3.3. Notes on individual sources
The DoAr24E system is a hierarchical multiple for which we have spectra of two components, with the rotational analyses nearly identical for both components. This lack of significant spatial variability strongly suggests that we are tracing spatially extensive and homogenous foreground material, that in turn is the dominant contributor smoothly distributed on scales of at least a few 100 AU. The lack of isotopic variability between the DoAr24E components gives us further confidence on our retrieval method for deriving precise isotope ratios.
Due to high extinction leading to a faint band continuum for the embedded YSO IRS 43, we detect high- lines for all CO isotopologues in , but only low- lines for 12C16O in the band. Given this disparate set of temperature ranges, our data for IRS 43 are therefore not useful for measuring CO isotopologue abundance ratios relative to 12C16O.
Toward VV CrA S, we derive a 12C16O column density of cm-2. This is nearly three orders of magnitude higher than the value of cm-2 derived in Kruger et al. (2011). Our rotational temperature ( K) is also significantly lower than their value ( K). Since Kruger et al. (2011) used the spectra from the archive, these differences could be explained by strong saturation effects resulting from their use of the highly optically thick 12C16O lines. This difference reinforces the necessity of using data for deriving precise 12C16O column densities.
Smith et al. (2009) proposed that the cold gas component observed toward VV CrA S may be interpreted as either molecular cloud material in front of the VV CrA binary system, or disk gas toward the primary component as suggested by Kruger et al. (2011). We point out that the former is more likely because the presence of both warm and cold components are expected for a disk, while a foreground cloud will typically only show a single cold component, such as that seen towards VV CrA N. Taken together, the likely geometry for the VV CrA system and the spectroscopic results render it unlikely that the VV CrA S spectra represent outer disk. VV CrA N observations most likely represent warm and cold disk gas.
| Target | Comp. | C16O) | [12C16O]/[13C16O] | [12C16O]/[12C18O] | [12C16O]/[12C17O] | [12C18O]/[12C17O] |
|---|---|---|---|---|---|---|
| ( cm-2) | ||||||
| DoAr24E S | single | : | – | – | ||
| DoAr24E N | single | : | – | – | ||
| VV CrA N | high | |||||
| VV CrA N | low | |||||
| VV CrA S | single | : | : | |||
| HL Tau | high | |||||
| HL Tau | low | |||||
| LLN 19 | single | : | – | – | ||
| RNO 91aaThe temperature component. Single if a single temperature component was used. High and low for two-component fits. | high | |||||
| RNO 91aaThe 12C17O lines for RNO 91 were fit with a single-temperature model. | low | |||||
| Reipurth 50 | high | |||||
| Reipurth 50 | low | |||||
| IRS 63 | high | |||||
| IRS 63 | low | – | – | – | ||
| IRS 43bbRatios relative to 12C16O are uncertain because only low- 12C16O lines are available, while the low- lines for the other isotopologues are poorly constrained. | high | : | : | : | ||
| IRS 43bbRatios relative to 12C16O are uncertain because only low- 12C16O lines are available, while the low- lines for the other isotopologues are poorly constrained. | low | – | : | : | : | : |
| IRS 51 | single | – | – | – | ||
| Local ISMccValues from Wilson (1999). | – | – |
Note. — ††footnotetext: All uncertainties are statistical errors derived from the line fits. ††footnotetext: Isotope ratios that may be affected by significant systematic uncertainty are indicated with a “:”.
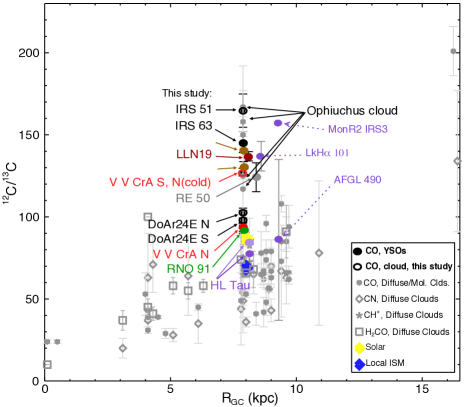
3.4. Carbon isotope ratios versus Galactocentric radius
Derived [12C16O]/[13C16O] ratios are plotted against Galactocentric radius (R) in Figure 10. The solar system and local ISM values of (Scott et al., 2006) and (Milam et al., 2005) are plotted at 8 kpc, respectively. Derived [12C16O]/[13C16O] toward our targets range from to 165, values inconsistent with those toward most YSOs and molecular clouds, or from GCE (Prantzos et al., 1996) and regression models (Milam et al., 2005). The distribution of data from the literature approximates the general trend of increasing metallicity toward the Galactic center, with the corresponding increase in 12C/13C with greater R.
3.5. Derivation of ice fractions
Previous studies have discussed the exchange between CO solid- and gas-phase reservoirs in disks and envelopes (e.g. van Dishoeck et al., 1996; Boogert et al, 2000). With a range of CO ice column densities centered at m (Figures 1 through 4), our data set provided an opportunity to investigate relationships between the gas-phase isotopologue ratios and the CO ice fraction along single lines-of-sight. CO ice column densities were calculated from optical depth analyses in Pontoppidan et al. (2003) and Thi et al. (2010).
Of the broad CO ice profile, the pure, cold CO component is most relevant with respect to interactions with CO gas, as it is the solid state reservoir that would most likely directly exchange with the gas in cold, dense clouds. We used optical depths for this component to derive total CO ice column densities for each target. Using the phenomenological decomposition analyses in Pontoppidan et al. (2003), the pure component corresponds to the middle optical depth () profile measurement; Thi et al. (2010) was used for LLN 19. For targets with no (VV CrA, DoAr24E) or very weak (HL Tau) spectral ice features, we used upper limits from the CRIRES fundamental bands.
Total column densities of pure CO in the ice phase were computed using the relation from Pontoppidan et al. (2003),
| (1) |
where is the optical depth at line center of the pure CO component, is the band strength of 12CO, and the numerical factor, 6.03 cm-1, considers the effect of grain shape on the band strength. In this study, we used the continuous distribution of ellipsoids (CDE) model (Pontoppidan et al., 2003) in computing solid CO column densities.
Optical depths, column densities, and total CO ice fractions are listed in Table 7, in ascending order of CO ice optical depth. Although it is assumed that cold CO gas will more likely exchange with CO ice, for targets where CO gas was observed in both cold and warm environments, values for CO ice fractions are shown separately for each environment.
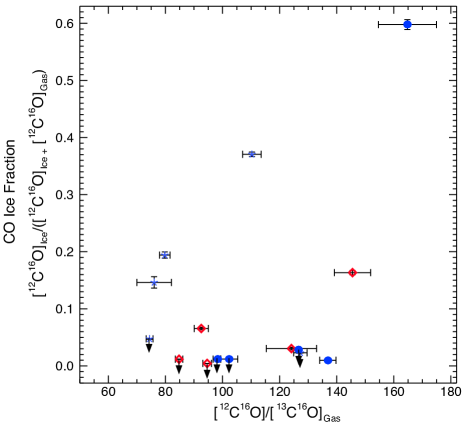
The relation between the CO ice fraction and [12C16O]/[13C16O] gas-phase ratios is shown in Figure 11, with CO ice fractions plotted against derived [12CO]/[13CO] for cold ( to 30 K) and warm ( to 250 K) regimes, the latter only for targets where warm gas was observed. We distinguish between targets where only cold CO gas is observed, and targets where both warm and cold temperatures is found. In the latter cases, cold-gas measurements are likely more uncertain due to the contribution of the high-temperature on the low-temperature lines.
3.6. Solid / toward IRS 51
The optical depth for the 13CO ice toward the foreground cloud traced by IRS 51 provides the only solid [12C16O]/[13C16O] ratio () that can be compared to a gas-phase ratio along the same line-of-sight in this study. The ice-phase ratio is significantly lower than our derived gas-phase ratio of . The [12C16O]/[13C16O] value in ice for IRS 51 is roughly consistent with other published [12C16O]/[13C16O] values for ice in YSO targets: Boogert et al. (2002a) derive a [12C16O]/[13C16O] ratio of for the ice observed toward the massive YSO NGC 7538 IRS 9, using Keck-NIRSPEC, and a lower ratio of was observed toward the CRBR 2422.8-3423 edge-on disk using VLT-ISAAC (Pontoppidan et al., 2005).
| Target | Component | [12C16O]ice | [12C16O]gas | CO ice fraction cc[12C16O]Ice/([12C16O]Ice + [12C16O]Gas. | |
|---|---|---|---|---|---|
| ( cm-2) | ( cm-2) | ||||
| DoAr24E SddUpper limits on the CO ice column from spectra in this paper. | single | ||||
| DoAr24E NddUpper limits on the CO ice column from spectra in this paper. | single | ||||
| VV CrA NddUpper limits on the CO ice column from spectra in this paper. | low | ||||
| VV CrA NddUpper limits on the CO ice column from spectra in this paper. | high | ||||
| VV CrA SddUpper limits on the CO ice column from spectra in this paper. | single | ||||
| HL TauddUpper limits on the CO ice column from spectra in this paper. | low | ||||
| HL TauddUpper limits on the CO ice column from spectra in this paper. | high | ||||
| LLN 19eeOptical depth is from the middle component values from the phenomenological decompositions in Thi et al. (2010). | single | ||||
| RNO 91 | low | ||||
| RNO 91 | high | ||||
| Reipurth 50 | low | ||||
| Reipurth 50 | high | ||||
| IRS 63 | low | ||||
| IRS 63 | high | ||||
| IRS 51 | single |
Note. — aafootnotetext: Optical depths for all targets excepting LLN 19 are derived from the middle component as determined by the phenomenological decompositions in Pontoppidan et al. (2003). bbfootnotetext: Uncertainties are .
4. Discussion
4.1. Galactic / heterogeneity
We find significant heterogeneity in gas-phase [12C16O]/[13C16O] toward our targets (Figures 10 and 11), with most values falling above local ISM values of , as determined by sub-millimeter observations (Wilson, 1999; Milam et al., 2005). The large spread in [12C16O]/[13C16O] suggests either heterogeneity in the carbon isotopic composition in our local solar neighborhood (e.g. R kpc), and/or one or more new fractionation mechanisms for CO operating in the dense envelopes of young stars. The distribution of CO isotopologue ratios derived from our CRIRES data do not match the general Galactic trend, which suggests that the carbon reservoirs of young stellar envelopes do not necessarily isotopically represent their parent clouds, as is often assumed in GCE models (Prantzos et al., 1996).
We are not the first to observe unusual [12C16O]/[13C16O] abundance ratios in YSOs and molecular clouds (Figure 10). In ultraviolet absorption, Lambert et al. (1994) and Federman et al. (2003) found high [12C16O]/[13C16O] values toward diffuse regions in the Ophiuchus cloud, with values ranging from to 167. These results have been attributed to selective CO photodissociation by external ultraviolet radiation (Lambert et al., 1994; Federman et al., 2003). We discuss connections with CO photodissociation in Section 4.3.
Unusually high [12C16O]/[13C16O] values were also detected in rovibrational absorption using Subaru ( toward the massive young stars LkH101 and MonR2 IRS3, with values of and 158, respectively (Goto et al., 2003). Goto et al. (2003) suggested that photon-trapping in the rotational lines of the most abundant isotope as a possible explanation for the apparently elevated carbon isotope ratios, although the potential effect was not quantified in their study.
4.2. Ice-gas partitioning of and
4.2.1 Observed relation between the ice-gas fraction and the CO isotopologue ratios
A possible mechanism for the observed CO fractionation is mass-dependent exchange between gas and ice. Compared to single-dish, beam-averaged millimeter measurements of CO gas-phase isotopologue ratios in molecular clouds, rovibrational absorption through protostellar envelopes is likely to probe denser gas. Dense, cold gas is known to lead to efficient CO freeze-out onto dust grains (Jørgensen et al., 2004). If the adsorption/desorption rates of CO are mass-dependent, isotopologue fractionation may occur. Further, if the heavier isotopologue (13CO) is more tightly bound to the dust grains, we would expect a increase in the [12CO]/[13CO] ratio in the gas, which is consistent with the detection of large columns of CO ice along the observed lines-of-sight. Here we discuss whether ice-gas partitioning is a possible explanation for the observed high CO isotopologue ratios in the gas.
The relative fraction of CO sequestered in ice, averaged along the line-of-sight, is plotted against the [12C16O]/[13C16O] abundance ratios in the gas (Figure 11). While we might expect to see increased values of the CO abundance ratio for lines-of-sight with a high ice/gas fraction if 13CO is preferentially bound in the ice mantles, we instead find significant scatter, much larger than the individual errors on each data point, with no simple apparent relation between these quantities. A correlation is particularly absent between cold-gas reservoirs and CO ice fraction, although these two quantities are likely cospatial and trace the same total CO reservoir. However, the line-of-sight with the largest ice fraction (IRS 51) also has the highest CO isotopologue ratio in the gas. Therefore, while other factors are likely equally important, we cannot rule out that ice-gas partitioning could play a significant role in the observed high gas-phase [12C16O]/[13C16O].
With respect to other factors affecting the gas-phase ratios, we note that high [12C16O]/[13C16O] ratios are also observed in the warm gas in some lines-of-sight (Figure 11, red diamonds), which is unexpected if ice-gas partitioning is the only fractionation mechanism, since environments warm enough to fully sublimate the CO ice should reset the gas isotopologue fraction back to the canonical value of . In order to reconcile this with ice-gas partitioning, there must be a mechanism to effectively remove CO from the ice during the cold phase of envelope evolution. Chemical pathways removing CO from the ice include the successive hydrogenation of CO to formaldehyde (H2CO) and methanol (CH3OH) (Hidaka et al., 2004; Watanabe & Kouchi, 2002; Cuppen et al., 2009; Fuchs et al., 2009), or reactions with OH or O to form CO2 (Mennella et al., 2006; Oba et al., 2010; Ioppolo et al., 2011). Further, we would expect the column densities of ice to be comparable or larger than those of the gas in order for the ice to be a significant reservoir that could increase the gas-phase [12C16O]/[13C16O]. For IRS 51, the large discrepancy in [12C16O]/[13C16O] between the ice () and the gas (), along with a seemingly low CO ice fraction (), suggests instead that open-system chemistry may be occurring via CO ice reactions.
While the data are inconclusive with regard to carbon isotopic fractionation between reservoirs of CO ice and gas, potential trends in cold- and warm-gas reservoirs can be further investigated with high-resolution spectroscopy for a larger sample of protostellar lines-of-sight. Further, models considering chemical evolution in protoplanetary environments including YSOs could consider interactions between ice and gas reservoirs as a potential influence on isotope partitioning.
4.2.2 Comparison to theoretical and experimental studies
To estimate whether there is an expectation of ice-gas partitioning for CO, we briefly review the theoretical basis for a potential mass-dependence in the ice-gas balance. Following a standard approach for ice-gas partitioning (e.g. Tielens & Hagen, 1982), CO separations between the solid- and gas-phase reservoirs can be investigated with respect to mass-dependent kinetics and the balance between the rates of 12C16O and 13C16O gas adsorption and desorption, as given by the relation,
| (2) |
where is the number density of ice, exp , and are the desorption and adsorption rates, respectively. The factor, , is the binding energy of CO. The factor accounts for CO desorbing only from the top monolayer of the ice, is the grain radius, and is the sticking coefficient. The mass of CO is an obvious mass-dependency of this relation, and is the pre-exponential factor. The number densities of the CO gas and dust particles are given by and , respectively (Pontoppidan, 2006). In addition to the mass itself, the binding energy and pre-exponential factors are likely both mass-dependent, although to unknown degrees.

Some experimental work exists for the mass dependence of thermal desorption of CO. In an ultra-high vacuum, temperature-programmed desorption (TPD) experiment, Acharyya et al. (2007) measured binding energies and pre-exponentials for desorption from pure 12CO and 13CO ices. The parameters were derived using an empirical kinetic model. However, no difference between the 12CO and 13CO binding energies could be measured within the experimental uncertainties: K and K for 12C16O and 13C16O, respectively.
To estimate the degree of ice-gas fractionation allowed by the boundaries imposed by the experimental evidence, we solved for the ice abundance in Eq. 2, assuming a 10 K difference in binding energy between the two CO isotopologues and a pre-exponential that scales as (Hasegawa et al., 1992). In Figure 12 it is seen that, under these assumptions, the [12CO]/[13C] gas ratio may reach values as high as 170, but only for a narrow range of temperatures close to those of CO desorption (above which no ice exists). Essentially, a dust temperature exists at which 13CO can efficiently remain bound to the dust surface, while 12CO cannot. Nearly all of this effect is due to the assumed difference of only 10 K in the binding energies. Compared to what is currently available, significantly more precise laboratory measurements of mass-dependent binding energies would be needed to rule out binding-energy differences as a significant cause of ice-gas fractionation. While such temperature-dependent fractionation may be consistent with the observed spread in isotopologue ratios, it remains unclear to which degree the physical conditions of real molecular clouds and envelopes must be fine-tuned to lead to significant ice-gas fractionation.
More realistic modeling of ice-gas fractionation of CO is potentially complicated by several factors. For example, investigations of the effects of CO entrapment in the ice on the desorption and adsorption (both potential mass-dependent processes) in astrophysical environments have shown that diffusion of CO into the porous H2O ice leads to competing CO entrapment and diffusion effects on the desorption of CO, the degree to which depends on the ice temperature (Collings et al., 2003). Further, a recent study has shown that three-phase modeling of H2O:CO2 ice desorption depends on the ice thickness and mixing ratios, which may have significant effects on ice desorption (Fayolle et al., 2011).
4.3. Oxygen isotopologues and self-shielding
Isotope-selective photodissociation of CO due to self-shielding refers to the differential shielding of CO isotopologues from photodissociation by far ultraviolet (FUV) radiation in proportion to their column densities. With regard to oxygen isotopes, this leads to spatial regions characterized by more rapid destruction of 12C17O and 12C18O compared to the much more abundant 12C16O molecule. Oxygen liberated during this process is thought to eventually end up in H2O, providing an explanation for the overabundance of HO and HO relative to HO in the early solar system. Isotope-selective photodissociation of CO due to self-shielding has been shown to be a relevant process in the interstellar medium (van Dishoeck & Black, 1988; Visser et al., 2009).
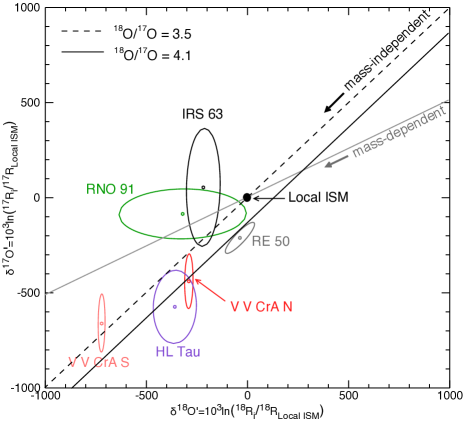
The solar system oxygen isotope anomaly is characterized by the mass-independent correlation between [16O]/[18O] and [16O]/[17O] found in meteoritic materials as compared to the mass-dependent distribution known in terrestrial rocks. Mass independence refers to relative differences in [16O]/[18O] and [16O]/[17O] among primitive rocky objects that are nearly identical, suggesting changes in [16O] relative to both [17O] and [18O], rather than the expected mass-dependent trend in which relative changes in [16O]/[17O] are about half those in [16O]/[18O] on a log scale. The solar system oxygen anomaly has defied conclusive explanation since its discovery (Clayton et al., 1973), and has been investigated observationally by Brittain et al. (2005) and Smith et al. (2009), the latter study finding mass-independent signatures in oxygen isotopes observed in CO toward the VV CrA N disk, consistent with isotope-specific photodissociation by CO self-shielding.
The compiled oxygen data for this study, which also includes refined analyses of VV CrA N and Reipurth 50 from Smith et al. (2009), are shown in Table 6 and Figure 13. The mass-dependent lines in Figure 13 are derived by estimating the oxygen isotope ratios for the ISM as a function of distance from the Galactic center. These values can be estimated from the 4 kpc and 8 kpc values (Wilson, 1999), such that for :
| (3) |
where the uncertainty in the slope reflects the uncertainty in the standard errors reported in Table 4 of Wilson (1999). For , equation 3 is combined with values for in the ISM, which vary from 3.5 (Wilson, 1999) to 4.1 (Wouterloot et al., 2008) (Figure 13).
We find a mass-independent signature in the oxygen isotopes relative to solar system abundances, consistent with CO self-shielding, toward the HL Tau disk, and the same mass-independent signature is retrieved in the refined results for VV CrA N (as compared to Smith et al. (2009)). These findings lend further support for models considering CO self-shielding on disk surfaces (Lyons & Young, 2005; Young et al., 2008). It is particularly interesting to note that the recent suggestions of planet formation in the HL Tau disk based on new ALMA imaging (Tamayo et al., 2015) would imply that CO self-shielding may be a process that occurs and/or persists later in the evolution of YSOs than previously thought.
We would not expect UV photolysis to be a significant process in the foreground cloud traced by VV CrA S, or in the relatively embedded objects, RNO 91, Reipurth 50, and IRS 63. Nevertheless, due to the errors in the rare isotopologue, 12C17O, a mass-dependent effect cannot be distinguished from mass-independence in oxygen fractionation for RNO 91 and IRS 63. Additional high-quality CO data for YSOs would help in evaluating mass-independence in oxygen for objects in various stages of evolution.
With regard to the rare CO isotopolgues, with the exception of low-temperature gas in Reipurth 50, the [12C18O]/[12C17O] ratios are within of molecular cloud radio measurements for local ISM, further strengthening the claim that the solar system is anomalous in 18O/17O with respect to the local solar neighborhood (Young et al., 2011). This consistency in our data is observational support for 12C18O and 12C17O being similarly affected in young stellar environments.
4.3.1 Evaluation of self-shielding on carbon isotope ratios
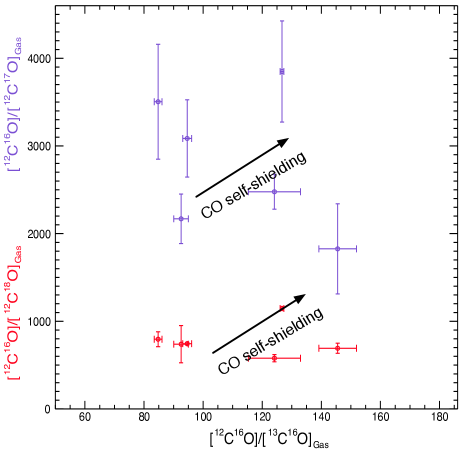
While critical evaluation of mass-independence requires three isotopes, we qualitatively considered if isotope-selective photodissociation by CO self-shielding could be affecting the derived [12C16O]/[13C16O] toward our targets by comparing the oxygen and carbon isotope ratios where this was possible: VV CrA N, VV CrA S, HL Tau, RNO 91, Reipurth 50, and IRS 63. These are plotted in Figure 14, with the qualitative relative trend for CO self-shielding overplotted on the data. The derived [16O]/[17O] changes by nearly a factor of two relative to [12C16O]/[13C16O], while the [12C16O]/[12C18O] varies by roughly 1.5 times with [12C]/[13C]. If CO self-shielding were the dominant mechanism, we would expect at least positive, direct changes in the carbon with the oxygen isotopes along an integrated line-of-sight, as well as similar variability in [12C18O] and [12C17O] compared with [12C16O]/[13C16O] due to their similar rates of photodissociation (e.g. van Dishoeck & Black, 1988; Visser et al., 2009). Therefore, while we cannot be certain that photodissociation of CO has no affect on the [12C16O]/[13C16O], we cannot claim that it is a dominant process affecting this carbon reservoir.
Models for low-mass YSOs predict that [12C16O]/[13C16O] should not increase significantly due to photodissociation (e.g. Visser et al., 2009; Woods & Willacy, 2009). Atomic carbon liberated by CO photodissociation is photoionized largely to C+, and C+ reacts rapidly to exchange carbon with CO by the reaction 13C+ + O 12C+ + 13CO + 35 K (Warin et al., 1996; van Dishoeck & Black, 1988; Langer et al., 1984), driving 13C back into CO and diminishing the signature of selective photodissociation. However, very high [12C16O]/[13C16O] ratios derived for diffuse clouds have nevertheless been attributed to CO self-shielding. Values of , (Federman et al., 2003), and (Lambert et al., 1994) have been observed toward diffuse Ophiuchus clouds that are thought to be subjected to high-UV fields, and where CO photodissociation is thought to dominate over the carbon exchange reaction that would otherwise erase a photochemical signature.
While the upper range in [12C16O]/[13C16O] in our sample is consistent with the Ophiuchus data (Figure 10), we do not find the expected mass-independent signatures in oxygen isotopes consistent with CO self-shielding. Further, as compared to diffuse clouds, we would not expect the molecular gas deep inside embedded YSO envelopes to be subjected to such high UV fields given their relatively high values of visual extinction ( (e.g. Vuong et al., 2003)).
5. Conclusions
Heterogenous [12C16O]/[13C16O] gas-phase abundance ratios, with several unusually high values, have been found using infrared absorption spectroscopy at very high resolution toward a sample of YSOs in nearby star-forming clouds. A possible partial explanation for this trend may be CO isotopologue partitioning between the ice and gas reservoirs. The degree of partitioning and the preservation of the relation in warm regions where the CO ice has sublimated would require the action of a process that can remove CO from the ice phase without returning it to the gas. Additional high-quality data could help substantiate these findings.
Signatures consistent with isotopologue-selective photodissociation by CO self-shielding in oxygen were observed in the oxygen isotopes toward the disks, HL Tau and VV CrA. However, our results do not support CO self-shielding as a dominant mechanism for explaining the trends in the gas-phase [12C16O]/[13C16O] heterogeneity.
We conclude that chemical evolution models for young stellar environments should consider the interaction between CO ice and gas reservoirs as a potential fractionation mechanism affecting the carbon isotope budget and influencing carbon isotopic heterogeneity in the gas. Interactions between these reservoirs could also contribute to isotopic heterogeneity between solar-type YSOs and their parent clouds. Finally, isotopologue-selective photodissociation by CO self-shielding should be considered an important mechanism affecting oxygen isotopes in protoplanetary disks, potentially persisting in the later stages of planet formation.
References
- Acharyya et al. (2007) Acharyya, K., Fuchs, G. W., Fraser, H. J., van Dishoeck, E. F., & Linnartz, H. 2007, A&A, 466, 1005
- Bally & Langer (1982) Bally, J., & Langer, W. D. 1982, ApJ, 255, 143
- Boogert et al (2000) Boogert, A. C. A., Ehrenfreund, P., Gerakines, P. A., Tielens, A. G. G. M., Whittet, D. C. B., Schutte, W. A., van Dishoeck, E. F., de Graauw, T., Decin, L., & Prusti, T. 2000, A&A, 353, 349
- Boogert et al. (2002a) Boogert, A. C. A., Blake, G. A., & Tielens, A. G. G. M. 2002a, ApJ, 577, 271
- Boogert et al. (2002b) Boogert, A. C. A., Hogerheijde, M. R., & Blake, G. A. 2002b, ApJ, 568, 761
- Brittain et al. (2005) Brittain, S. D., Rettig, T. W., Simon, T., & Kulesa, C. 2005, ApJ, 626, 283
- Casassus et al. (2005) Casassus, S., Stahl, O., & Wilson, T. L. 2005, A&A, 441, 181
- Clayton et al. (1973) Clayton, R. N., Grossman, L., & Mayeda, T. K. 1973, Science, 182, 458
- Clayton & Nittler (2004) Clayton, D. D., & Nittler, L. R. 2004, ARA&A, 42, 39
- Collings et al. (2003) Collings, M. P., Dever, J. W., Fraser, H. J., McCoustra, M. R. S., & Williams, D. A. 2003, ApJ, 583, 1058
- Coplen et al. (2002) Coplen, T. B., Böhlke, J. K., De Bièvre, P., Ding, T., Holden, N. E., Hopple, J. A., Krouse, H. R., Lamberty, A., Peiser, H. S., Révész, K., Rieder, S. E., Rosman, K. J. R., Roth, E., Taylor, P. D. P., Vocke, Jr., R. D., & Xiao Y.K. 2002, Pure Appl. Chem., 74 (10), 1987
- Cuppen et al. (2009) Cuppen, H. M., van Dishoeck, E. F., Herbst, E., & Tielens, A. G. G. M. 2009, A&A, 508, 275
- Dickman (1978) Dickman, R. L. 1978, ApJS, 37, 407
- Fayolle et al. (2011) Fayolle, E. C., Öberg, K. I., Cuppen, H. M., Visser, R., & Linnartz, H. 2011, A&A, 529, A74
- Federman et al. (2003) Federman, S. R., Lambert, D. L., Sheffer, Y., et al. 2003, ApJ, 591, 986
- Fuchs et al. (2009) Fuchs, G. W., Cuppen, H. M., Ioppolo, S., et al. 2009, A&A, 505, 629
- Goto et al. (2003) Goto, M., Usuda, T., Takato, N., et al. 2003, ApJ, 598, 1038
-
Hasegawa et al. (1992)
Hasegawa, T. I., Herbst, E., & Leung, C. M. 1992, ApJS, 82, 167
-
Herczeg et al. (2011)
Herczeg, G. J., Brown, J. M., van Dishoeck, E. F., & Pontoppidan, K. M. 2011, A&A, 533, A112
- Hidaka et al. (2004) Hidaka, H., Watanabe, N., Shiraki, T., Nagaoka, A., & Kouchi, A. 2004, ApJ, 614, 1124
- Ioppolo et al. (2011) Ioppolo, S., van Boheemen, Y., Cuppen, H. M., van Dishoeck, E. F., & Linnartz, H. 2011, MNRAS, 413, 2281
-
Jørgensen et al. (2004)
Jørgensen, J. K., Schöier, F. L., & van Dishoeck, E. F. 2004, A&A, 416, 603
- Koresko et al. (1997) Koresko, C. D., Herbst, T. M., & Leinert, C. 1997, ApJ, 480, 741
- Kruger et al. (2011) Kruger, A. J., Richter, M. J., Carr, J. S., et al. 2011, ApJ, 729, 145
- Lambert et al. (1994) Lambert, D. L., Sheffer, Y., Gilliland, R. L., & Federman, S. R. 1994, ApJ, 420, 756
- Langer et al. (1984) Langer, W. D., Graedel, T. E., Frerking, M. A., & Armentrout, P. B. 1984, ApJ, 277, 581
- Langer & Penzias (1993) Langer, W. D., & Penzias, A. A. 1993, ApJ, 408, 539
- Lyons & Young (2005) Lyons, J. R. & Young, E. D. 2005, Nature, 435 (7040), 317
- Mennella et al. (2006) Mennella, V., Baratta, G. A., Palumbo, M. E., & Bergin, E. A. 2006, ApJ, 643, 923
- Milam et al. (2005) Milam, S. N., Savage, C., Brewster, M. A., Ziurys, L. M., & Wyckoff, S. 2005, ApJ, 634, 1126
- Mitchell et al. (1989) Mitchell, G. F., Curry, C., Maillard, J.-P., & Allen, M. 1989, ApJ, 341, 1020
- Mitchell & Maillard (1993) Mitchell, G. F., & Maillard, J.-P. 1993, ApJ, 404, L79
- Mitchell et al. (1990) Mitchell, G. F., Maillard, J.-P., Allen, M., Beer, R., & Belcourt, K. 1990, ApJ, 363, 554
- Mitchell et al. (1991) Mitchell, G. F., Maillard, J.-P., & Hasegawa, T. I. 1991, ApJ, 371, 342
- Oba et al. (2010) Oba, Y., Watanabe, N., Kouchi, A., Hama, T., & Pirronello, V. 2010, ApJ, 712, L174
- Pontoppidan (2006) Pontoppidan, K. M. 2006, A&A, 453, L47
- Pontoppidan et al. (2011a) Pontoppidan, K. M., Blake, G. A., & Smette, A. 2011a, ApJ, 733, 84
- Pontoppidan et al. (2008) Pontoppidan, K. M., Blake, G. A., van Dishoeck, E. F., et al. 2008, ApJ, 684, 1323
- Pontoppidan et al. (2005) Pontoppidan, K. M., Dullemond, C. P., van Dishoeck, E. F., et al. 2005, ApJ, 622, 463
- Pontoppidan et al. (2003) Pontoppidan, K. M., Fraser, H. J., Dartois, E., et al. 2003, A&A, 408, 981
- Pontoppidan et al. (2009) Pontoppidan, K. M., Meijerink, R., Dullemond, C. P., & Blake, G. A. 2009, ApJ, 704, 1482
- Pontoppidan et al. (2011b) Pontoppidan, K. M., van Dishoeck, E., Blake, G. A., et al. 2011b, The Messenger, 143, 32
- Prantzos et al. (1996) Prantzos, N., Aubert, O., & Audouze, J. 1996, A&A, 309, 760
- Ridge et al. (2006) Ridge, N. A., Di Francesco, J., Kirk, H., et al. 2006, AJ, 131, 2921
- Robitaille et al. (2006) Robitaille, T. P., Whitney, B. A., Indebetouw, R., Wood, K., & Denzmore, P. 2006, ApJS, 167, 256
- Rothman et al. (2009) Rothman et al. 2009, JQSRT, 110, 553
- Rosman & Taylor (1998) Rosman, K. L. R., & Taylor, P. D. P. 1998, J. Phys. Chem. Ref. Data, 27 (6), 851
- Scott et al. (2006) Scott, P. C., Asplund, M., Grevesse, N., & Sauval, A. J. 2006, A&A, 456, 675
- Scoville et al. (1983) Scoville, N., Kleinmann, S. G., Hall, D. N. B., & Ridgway, S. T. 1983, ApJ, 275, 201
- Seifahrt et al. (2010) Seifahrt, A., Käufl, H. U., Zängl, G., Bean, J., Richter, M., & Siebenmorgen, R. 2010, The Messenger, 142, 21
- Sheffer et al. (1992) Sheffer, Y., Federman, S. R., Lambert, D. L., & Cardelli, J. A. 1992, ApJ, 397, 482
- Sheffer et al. (2002) Sheffer, Y., Lambert, D. L., & Federman, S. R. 2002, ApJ, 574, L171
- Shu (1977) Shu, F. H. 1977, ApJ, 214, 488
- Smith et al. (2009) Smith, R. L., Pontoppidan, K. M., Young, E. D., Morris, M. R., & van Dishoeck, E. F. 2009, ApJ, 701, 163
- Tamayo et al. (2015) Tamayo, D., Triaud, A. H. M. J., Menou, K., & Rein, H. 2015, ApJ, 805, 100
- Thi et al. (2010) Thi, W.-F., van Dishoeck, E. F., Pontoppidan, K. M., & Dartois, E. 2010, MNRAS, 406, 1409
- Tielens & Hagen (1982) Tielens, A. G. G. M., & Hagen, W. 1982, A&A, 114, 245
- van Dishoeck & Black (1988) van Dishoeck, E. F., & Black, J. H. 1988, ApJ, 334, 771
- van Dishoeck et al. (1996) van Dishoeck, E. F., Helmich, F. P., de Graauw, T., Black, J. H., Boogert, A. C. A., Ehrenfreund, P., Gerakines, P. A., Lacy, J. H., Millar, T. J., Schutte, W. A., Tielens, A. G. G. M., Whittet, D. C. B., Boxhoorn, D. R., Kester, D. J. M., Leech, K., Roelfsema, P. R., Salama A., & Vandenbussche, B. 1996, A&A, 315, L349
- van Kempen et al. (2009) van Kempen, T. A., van Dishoeck, E. F., Salter, D. M., et al. 2009, A&A, 498, 167
- Visser et al. (2009) Visser, R., van Dishoeck, E. F., & Black, J. H. 2009, A&A, 503, 323
- Vuong et al. (2003) Vuong, M. H., Montmerle, T., Grosso, N., Feigelson, E. D., Verstraete, L., & Ozawa, H. 2003, A&A, 408, 581
- Warin et al. (1996) Warin, S., Benayoun, J. J., & Viala, Y. P. 1996, A&A, 308, 535
- Watanabe & Kouchi (2002) Watanabe, N., & Kouchi, A. 2002, ApJ, 571, L173
- Wouterloot et al. (2008) Wouterloot, J. G. A., Henkel, C., Brand, J., & Davis, G. 2008 A&A, 487, 237
- Wilson (1999) Wilson, T. L. 1999, Reports on Progress in Physics, 62, 143
- Woods & Willacy (2009) Woods, P. M., & Willacy, K. 2009, ApJ, 693, 1360
- Young et al. (2008) Young, E. D., Kuramoto, K., Marcus, R.A., Yurimoto, H., & Jacobsen, Stein B. 2008, Reviews in Mineralogy & Geochemistry, Oxygen in the Solar System, 68, 187.
- Young et al. (2011) Young, E. D., Gounelle, M., Smith, R. L., Morris, M. R., & Pontoppidan, K. M. 2011, ApJ, 729, 43