000\Yearpublication2016\Yearsubmission2015\Month11\VolumeXXX\IssueXX
Gravitational Lensing Size Scales for Quasars
Abstract
We review results from our monitoring observations of several lensed quasars performed in the optical, UV, and X-ray bands. Modeling of the multi-wavelength light curves provides constraints on the extent of the optical, UV, and X-ray emission regions. One of the important results of our analysis is that the optical sizes as inferred from the microlensing analysis are significantly larger than those predicted by the theoretical-thin-disk estimate. In a few cases we also constrain the slope of the size-wavelength relation. Our size constraints of the soft and hard X-ray emission regions of quasars indicate that in some objects of our sample the hard X-ray emission region is more compact than the soft and in others the soft emission region is smaller. This difference may be the result of the relative strengths of the disk-reflected (harder and extended) versus corona-direct (softer and compact) components in the quasars of our sample. Finally, we present the analysis of several strong microlensing events where we detect an evolution of the relativistic Fe line profile as the magnification caustic traverses the accretion disk. These caustic crossings are used to provide constraints on the innermost stable circular orbit (ISCO) radius and the accretion disk inclination angle of the black hole in quasar RX J11311231.
keywords:
galaxies: active quasars: general accretion disks black hole physics gravitational lensing1 Introduction
Due to gravitational lensing the event horizon of a black hole casts a shadow that for a distant observer has a size of about 10 (e.g., Falcke et al. 2000). The predicted angular sizes of these black-hole shadows for SgrA* and M87 based on their measured black-hole masses are 50as and 35as, respectively. Direct imaging has been employed to image the accretion disk of SgrA* with submm Very Long Baseline Interferometry (Doeleman et al. 2008, 2011).
Direct imaging of the environments of quasars using submm VLBI is not possible due to their large distances, however, we currently rely on indirect methods to infer the structure near black holes. Indirect mapping methods include light travel time arguments, reverberation mapping of the broad line region (Blandford & McKee 1982; Peterson 1993, Netzer & Peterson 1997), reverberation mapping of the Fe K emission region (Young & Reynolds 2000), reverberation between the X-ray and optical/UV continua (Shappee et al. 2014; Edelson et al. 2015), and microlensing of the continuum and line emission regions (e.g., Grieger et al. 1988 and 1991; Schneider, Ehlers & Falco 1992; Gould & Gaudi 1997; Agol & Krolik 1999; Yonehara et al. 1999; Mineshige & Yonehara 1999; Chartas et al. 2002, 2009, 2012; Popovic et al. 2003, 2006; Blackburne et al. 2006, 2011, 2014, 2015; Pooley et al. 2006, 2007; Kochanek et al. 2004, 2007; Jovanovic et al. 2008; Morgan et al. 2006, 2008a, 2008b, 2010, 2012; Dai et al. 2010; Mosquera et al. 2011, 2013; Chen et al. 2011, 2012; MacLeod et al. 2015).
Macrolensing of a quasar into multiple images may occur in cases where there is near alignment of the observer, an intervening galaxy and the background quasar. The surface mass density of the lensing galaxy needs to be above a critical value before multiple images are produced (strong lensing). Typical separations of images produced in macrolensing range between 0.1 – 20 arcsec.
Microlensing is the bending of light produced by the individual stars in the lensing galaxy. Microlensing variability occurs when the complex pattern of caustics produced by stars in the lens moves across the source plane.
The characteristic scale of these patterns is the Einstein radius of
| (1) |
where is the mean mass of the lensing stars, D is the angular diameter distance, and the subscripts L, S, and O refer to the lens, source, and observer, respectively.
Microlensing will affect the images differently resulting in uncorrelated variability between images. Emission regions with sizes significantly smaller than the projected Einstein radius of the stars will be strongly affected by microlensing whereas emission regions with sizes significantly larger will not be affected. The light curves of compact sources are therefore expected to show enhanced uncorrelated variability compared to the light-curves of more extended emission regions.
Simulations of light-curves of images of gravitationally lensed quasars from caustic crossings are fit to observed light-curves and provide constraints on the size of the emission regions, the microlens mass scale, and the mass fraction of the local surface density of the lens galaxy. The microlensing analysis includes the creation of many random realizations of the star fields near each image and the generation of magnification maps. This technique was first developed by Kochanek (2004; Kochanek et al. 2007) and has successfully been applied to several gravitational lens systems. Recent improvements of microlensing simulations that allow for movement of the stars between epochs also provide constraints on the inclination of the accretion disk and the direction of motion of the caustics (e.g., Poindexter & Kochanek 2010).
The majority of the optical and UV continuum emission of AGN is thought to originate from the accretion disk. The microlensing method therefore applied to the optical and UV light curves of images of lensed quasars places constraints on the sizes of the accretion disks at their respective rest-frame wavelengths. The majority of the X-ray continuum of quasars is dominated by non-thermal radiation of the X-ray corona with a smaller contribution from the disk. The accretion disk components is often referred to as the reflected component. Measurements using the microlensing method to fit the X-ray light curves of the images of lensed quasars place constraints on the size of the X-ray hot corona.
A promising technique for measuring the ISCO and spin of AGN relies on modeling the Fe K fluorescence lines originating from the inner parts of the disk (e.g., Fabian et al. 1989; Laor 1991; Reynolds & Nowak 2003). Modeling of the relativistic iron line can only be applied to a few relatively nearby Seyferts where the line is detectable at a high signal-to-noise level. The Fe K line is most Seyferts is typically very weak and constraining the spin and accretion disk parameters of Seyferts requires considerable observing time on XMM-Newton and Chandra.
Here we provide for the first time a new technique based on microlensing that provides a robust upper limit on the size of the inner radius of the X-ray emitting region of an accretion disk. Whereas relativistically broadened Fe K lines detected in the spectra of unlensed AGN are produced from emission originating from a large range of azimuthal angles and radii, the microlensed Fe K lines in the spectra of lensed AGN are produced from a relatively smaller region on the disk that is magnified as a microlensing caustic crosses the disk. Simulations of microlensing caustics crossing the accretion disk show significant redshifts and blueshifts of the fluorescent Fe K line (e.g., Popovic et al. 2006). The evolution of the energy and shape of the Fe K line during a caustic crossing depends on the ISCO, spin, inclination angle of the disk and caustic angle. The extreme shifts are produced when the microlensing caustic is near the ISCO of the black hole. Measurements of the distribution of the energy shifts of the Fe K line due to microlensing therefore provides a powerful and robust method for estimating the ISCO, spin and inclination angle of the disk. In §2 we present a review of our multi-wavelength monitoring campaign of gravitationally lensed quasars and summarise our major results. In §3 we present an estimate of the ISCO of RX J11311231 based on the measured distribution of energy shifts of the Fe K line caused by microlensing. Finally in §4 we present a summary of results obtained from our monitoring campaign of lensed quasars. Throughout this paper we adopt a flat cosmology with = 67 km s-1 Mpc-1, = 0.69, and = 0.31, based on the Planck 2015 results (Planck Collaboration et al. 2015).
| Object | zs | zl | MBH | Line |
|---|---|---|---|---|
| (108 M⊙) | ||||
| Q J01584325 | 1.294 | 0.317 | 1.6 | (MgII, a) |
| HE 04351223 | 1.689 | 0.454 | 5.0 | (CIV, a) |
| SDSS0924+0219 | 1.524 | 0.390 | 2.8 | (MgII, b) |
| SDSS1004+4112 | 1.734 | 0.680 | 0.4 | (MgII, b) |
| QSO 11041805 | 2.319 | 0.729 | 5.9 | (H, c) |
| PG 1115+080 | 1.720 | 0.310 | 4.6 | ( H, c) |
| RX J11311231 | 0.658 | 0.295 | 0.6 | (H, a) |
| Q 2237+030 | 1.690 | 0.040 | 12.0 | (H, c) |
Notes:
a-Peng et al. 2006, b-Morgan et al. 2006, c-Assef et al. 2011
2 Multiwavelength Monitoring of Lensed Quasars
We are performing multiwavelength monitoring of several quasars listed in Table 1,with the main scientific goal of measuring the emission structure near the black holes in the optical, UV, and X-ray bands in order to test accretion disk models. The X-ray monitoring observations were performed with the Chandra X-ray Observatory. The Optical (B, R and I band) observations were made with the SMARTS Consortium 1.3m telescope in Chile. The UV observations were performed with the Hubble Space Telescope. Here we highlight several of the most recent results published by our microlensing team.
In Blackburne et al. 2015 we analyze the lightcurves of = 2.32 quasar HE 11041805 using dynamical microlensing magnification patterns. HE 11041805 has been observed at a variety of wavelengths ranging from the mid-infrared to X-ray for nearly 20 years. Dynamical microlensing analysis constrains the half-light radius of the accretion disk to (r1/2/cm) = 16.0 , the half-light radius of the X-ray emission region to have an upper limit of (r1/2/cm) = 15.33 (95% confidence), a low inclination angle is preferred statistically, the mean mass of the stars in the lensing galaxy (M) ranges between 0.1 and 0.4 M⊙ and the slope of the size-wavelength relation , is = 1.0. The majority of the observed continuum X-ray emission is found to originate within 30, assuming a black hole estimate of = 5.9 108 M⊙ based on the width of the H line (Assef et al. 2011). Based on this black hole mass estimate the gravitational radius of HE 11041805 is = 8.7 1013 cm.
In MacLeod et al. 2015 we analyze the light-curves of = 1.524 quasar SDSS 09240219 using static microlensing magnification patterns. SDSS J09240219 has been observed at a variety of wavelengths ranging from the near-infrared to X-ray. Our microlensing analysis in this system constrains the soft-X-ray, UV, and optical half-light radii to be 2.5 1014 cm, 8 1014 cm, and 1015 cm, respectively. Assuming the MgII based black-hole estimate of = 2.8 108 M⊙ the majority of the soft X-ray emission of SDSS 09240219 originates within 30 . The gravitational radius of SDSS 09240219 is = 4.12 1013 cm.
In Dai et al. 2010 and Chartas et al. 2009 we analyze the light-curves of = 0.658 quasar RX J11311231. We find the X-ray and optical half-light radii to be 2.3 1014 cm and 1.3 1015 cm, respectively. These sizes correspond to 26 and 147, respectively.
An important result found in all microlensing studies is that optical sizes of quasar accretion disks as inferred from the microlensing analysis are significantly larger than those predicted by thin-disk theory. Specifically, measurements of the radius of the accretion disk at 2500 rest-frame indicate that the sizes obtained from microlensing measurements are 2–3 times larger than the values predicted by thin-disk theory (e.g., Morgan et al. 2010, Mosquera et al. 2013).
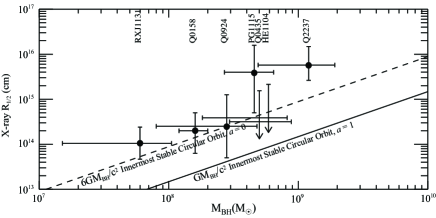
In Figure 1 we present the X-ray half-light radii of quasars from recent microlensing studies of lensed systems observed as part of our monitoring program (MacLeod et al. 2015, Blackburne et al. 2014, 2015, Mosquera et al. 2013, Morgan et al. 2008, 2012, Dai et al. 2010, and Chartas et al. 2009). Included in Figure 1 are the uncertainties of the black-hole mass estimates and uncertainties in the size estimates. The X-ray sizes of the quasars in our sample are found to be close to the sizes of their innermost stable circular orbits. Assuming that most of the X-ray emission in the band detected originates from the hot X-ray corona, these results indicate that the corona is very compact and not extended over a large portion of the accretion disk.
3 Estimating the Inner Most Stable Circular Orbit Using Microlensing
RX J11311231 has been monitored 38 times over a period of 10 years with the Chandra X-ray Observatory. As reported in Chartas el al. 2012, redshifted and blueshifted Fe Ka lines have been detected in the spectra of the lensed images.
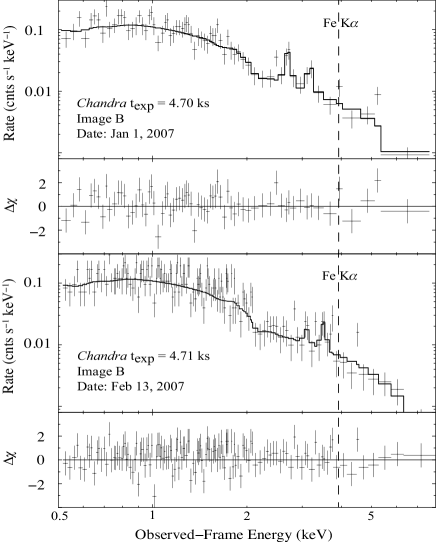
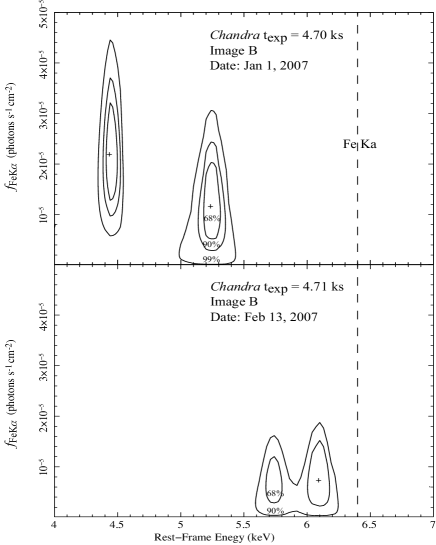
In Figure 2 we show the evolution of the red and blue components of the Fe K line possibly caused by the motion of a magnification caustic as it moves away from the center of the black hole. We interpret the shift of the Fe K line as resulting from general relativistic and special relativistic Doppler effects. As shown in Figure 3, the two redshifted iron lines in the Jan 1, 2007 observation are each detected at the 99% confidence and the iron lines in the Feb 13, 2007 observation are each marginally detected at the 90% confidence level (Figure 3).
The extreme values of the normalized energy shifts = / of the two lines can be used to roughly constrain the radius of the emitting material as shown in Figure 4. The generalized Doppler shifts were calculated for the case of a spinning black hole (Kerr 1963) using the formalism described in Muller & Camenzind 2004 and Karas & Sochora 2010.
For these calculations we assumed the radial and toroidal velocity components and v(θ) of the radiating plasma of the accretion disk in the Zero Angular Momentum Observer frame to be relatively small. For a given inclination angle , the angle between the direction of the orbital velocity of the plasma and our line of sight is assumed to range between a minimum and maximum value that will depend on the inclination angle , and the angle between the caustic direction of motion and the projection of our line-of-sight onto the disk plane. We assume that the most redshifted line component, as shown in Figure 2, is produced by Fe K emission originating close to the ISCO. For a Keplerian profile is assumed (equation 15 of Muller & Camenzind 2004), whereas for constant specific angular momentum is assumed.
The two redshifted iron lines detected in the Jan 1, 2007 observation correspond to generalized Doppler shifts of 0.7 and 0.82 and the two lines detected in the Feb 13, 2007 observation correspond to 0.9 and 0.96. The detected energies of the iron lines and their evolution is consistent with a microlensing caustic moving by a distance of about 15 between the two epochs that are separated by 44 days (observed frame).
We can independently check this estimate by estimating the distance a caustic in this system is expected to travel in 44 days. Due to the combined motions of the observer, lens, source, and stars in the lens galaxy, the source moves relative to the magnification patterns at an effective velocity of veff 700 km s-1 (see Mosquera et al. 2011). Assuming a black-hole mass of 6 107 M⊙ (i.e., Sluse et al. 2012) the gravitational radius of RX J11311231 is = 3.6 1013 cm. The distance travelled by a caustic in = 44 days is = veff /(1+) 18. This is consistent with the estimated value based on the shift of the Fe K lines between the two epochs.
We have performed a systematic spectral analysis of all epochs and all images searching for the presence of the Fe K lines in the spectra. To determine the significance of the iron lines detected we produced confidence contours of the flux normalization of the lines as a function of their energy (see Figure 3). The spectral models used to fit the X-ray spectra of RX J11311231 consist of a power law with Galactic and neutral intrinsic absorption and Gaussian lines to model the iron lines. For producing the confidence contours the only model parameter that was frozen in the spectral fit was the Galactic column density of = 3.6 1020 cm-2 (Dickey & Lockman 1990).
We find that the iron line is detected in 58 out of the 152 spectra (38 epochs 4 images) at 90% confidence and in 18/152 spectra at 99% confidence. There is considerable shift of the energy of the iron line due to microlensing.
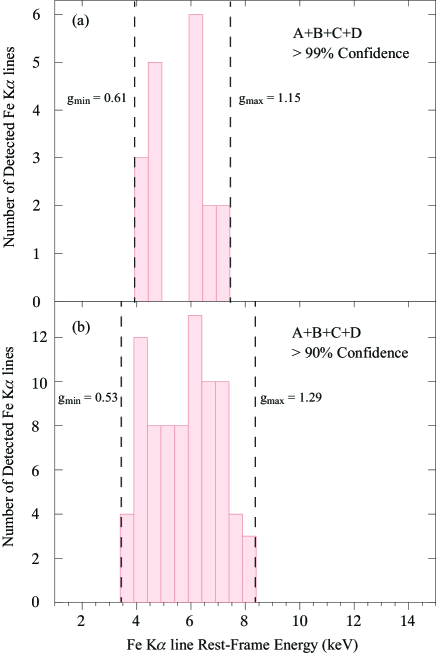
In Figure 5 we show the distribution of the energy-shifts of the Fe K line in all images. One important feature of this iron line energy-shift distribution in the significant cut-off of the distribution at rest-frame energies of 3.9 keV and 7.4 keV for iron lines detected at confidence. These cut-offs represent the most extremely redshifted and blueshifted Fe K lines. If we interpret the largest energy-shifts to be produced by X-ray emission originating close to the inner most stable circular orbit of the black hole we can provide upper limits on the size of the ISCO and inclination angle of RX J11311231.
The extreme blueshift of the distribution is sensitive to the inclination angle of the disk. Specifically, the measured generalized Doppler factor = 1.15 (99% confidence) constrains the inclination angle to be 55∘.
The extreme redshift of the distribution is sensitive to the ISCO radius. Specifically, the measured generalized Doppler factor = 0.61 (99% confidence) constrains 3.5 9. For the measured generalized Doppler factor = 0.53 (90% confidence) we find 3 7.
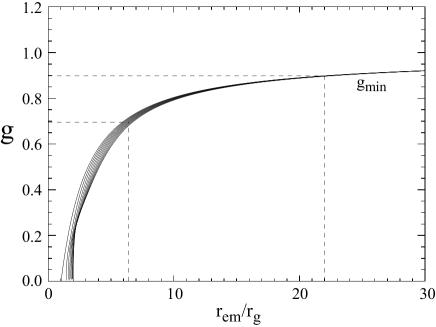
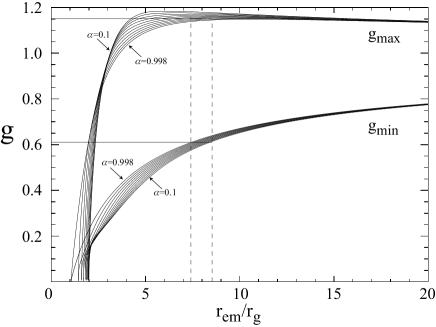
In Figure 6 we plot the values of the iron line for an accretion disk with an inclination angle of and a caustic crossing angle of = 20∘. The observed extreme values of = 0.6 and = 1.15 from all epochs and all images are consistent with an emitting region of an 9 and an inclination angle of 60∘.
A more detailed analysis will involve simulating the shifts of the Fe K line due to microlensing caustic crossings for a range of inclination angles, caustic crossing angles and black hole spin parameters. A comparison between the observed generalized Doppler shift distribution with those simulated will provide more accurate constraints on the inclination angle, and the ISCO. The spin of the black hole can be inferred from the known relation between ISCO radius and spin.
Additional monitoring observations with will provide more representative and complete distributions of the generalized Doppler shift values of the Fe K line in RX J11311231 and other lensed quasars. The -distribution method provides a new and independent technique of constraining the inclination angle, ISCO radius, and black hole spin of quasars.
4 Conclusions
Multiwavelegth monitoring of lensed quasars provides a powerful technique for constraining the sizes of accretion disks and hot X-ray coronae of distant quasars. Simultaneous modeling of the optical, UV and X-ray light curves places strong constraints on their relative sizes. Recent improvements to this method include dynamical microlensing which provides additional constraints on the inclination angle of the disk. Several important results of our monitoring campaign of lensed quasars are:
1. Optical sizes of accretion disks at inferred from our microlensing analysis are a factor of 2–3 larger than those predicted by thin disk theory. This result is consistent with recent measurements of continuum lags in nearby Seyferts NGC2617 (Shappee et al. 2014) and NGC5548 (Edelson et al. 2015).
2. The size of the UV emission region is found to be a factor of about 10 on average smaller than the optical but larger than the X-ray emission region.
2. The X-ray corona is found to be compact with a half-flight radius 30 (see Figure 1).
4. The scaling between optical sizes at and black hole mass is consistent with thin disk theory.
Future improvements include monitoring a larger variety of quasars (for example, BAL quasars and radio loud quasars.) Several models predict that radio-loud quasars contain truncated disks and measurements of the sizes of radio-loud objects may address this issue.
We introduced a promising new technique (-distribution method) for measuring the inclination angle, ISCO, and spin of a black hole. The -distribution method involves measurements of the distribution of the energy shifts of the relativistic iron line emitted from the accretion disk and a comparison of the measured -distribution with microlensing caustic simulations. The method has been applied to RX J11311231 and initial results indicate that 9 and 60∘. Further monitoring of RX J11311231 and other lensed quasars will provide tighter constraints on the inclination angle, ISCO radius and spin of the black hole of distant quasars.
Acknowledgements.
We acknowledge financial support from NASA via the Smithsonian Institution grant G03-141l0B.References
- [Agol & Krolik(1999)] Agol, E., & Krolik, J. 1999, ApJ, 524, 49
- [Assef et al.(2011)] Assef, R. J., Denney, K. D., Kochanek, C. S., et al. 2011, ApJ, 742, 93
- [Blackburne et al.(2015)] Blackburne, J. A., Kochanek, C. S., Chen, B., Dai, X., & Chartas, G. 2015, ApJ, 798, 95
- [Blackburne et al.(2014)] Blackburne, J. A., Kochanek, C. S., Chen, B., Dai, X., & Chartas, G. 2014, ApJ, 789, 125
- [Blackburne et al.(2011)] Blackburne, J. A., Pooley, D., Rappaport, S., & Schechter, P. L. 2011, ApJ, 729, 34
- [Blackburne et al.(2006)] Blackburne, J. A., Pooley, D., & Rappaport, S. 2006, ApJ, 640, 569
- [Blandford & McKee(1982)] Blandford, R. D., & McKee, C. F. 1982, ApJ, 255, 419
- [Chartas et al.(2002)] Chartas, G., Agol, E., Eracleous, M., et al. 2002, ApJ, 568, 509
- [Chartas et al.(2009)] Chartas, G., Kochanek, C. S., Dai, X., Poindexter, S., & Garmire, G. 2009, ApJ, 693, 174
- [Chartas et al.(2012)] Chartas, G., Kochanek, C. S., Dai, X., et al. 2012, ApJ, 757, 137
- [Chen et al.(2012)] Chen, B., Dai, X., Kochanek, C. S., et al. 2012, ApJ, 755, 24
- [Chen et al.(2011)] Chen, B., Dai, X., Kochanek, C. S., et al. 2011, ApJ, 740, L34
- [Dai et al.(2010)] Dai, X., Kochanek, C. S., Chartas, G., et al. 2010, ApJ, 709, 278
- [Dickey & Lockman(1990)] Dickey, J. M., & Lockman, F. J. 1990, ARA&A, 28, 215
- [Doeleman et al.(2008)] Doeleman, S. S., Weintroub, J., Rogers, A. E. E., et al. 2008, Nature, 455, 78
- [Doeleman et al.(2011)] Doeleman, S., Mai, T., Rogers, A. E. E., et al. 2011, PASP, 123, 582
- [Edelson et al.(2015)] Edelson, R., Gelbord, J. M., Horne, K., et al. 2015, ApJ, 806, 129
- [Fabian et al.(1989)] Fabian, A. C., Rees, M. J., Stella, L., & White, N. E. 1989, MNRAS, 238, 729
- [Falcke et al.(2000)] Falcke, H., Melia, F., & Agol, E. 2000, ApJ, 528, L13
- [Gould & Gaudi(1997)] Gould, A., & Gaudi, B. S. 1997, ApJ, 486, 687
- [Grieger et al.(1988)] Grieger, B., Kayser, R., & Refsdal, S. 1988, A&A, 194, 54
- [Grieger et al.(1991)] Grieger, B., Kayser, R., & Schramm, T. 1991, A&A, 252, 508
- [Jovanović et al.(2008)] Jovanović, P., Zakharov, A. F., Popović, L. Č., & Petrović, T. 2008, MNRAS, 386, 397
- [Karas & Sochora(2010)] Karas, V., & Sochora, V. 2010, ApJ, 725, 1507
- [Kerr(1963)] Kerr, R. P. 1963, Physical Review Letters, 11, 237
- [Kochanek et al.(2007)] Kochanek, C. S., Dai, X., Morgan, C., Morgan, N., & Poindexter, S. C., G. 2007, Statistical Challenges in Modern Astronomy IV, 371, 43
- [Kochanek(2004)] Kochanek, C. S. 2004, ApJ, 605, 58
- [Laor(1991)] Laor, A. 1991, ApJ, 376, 90
- [Mineshige & Yonehara(1999)] Mineshige, S., & Yonehara, A. 1999, PASJ, 51, 497
- [MacLeod et al.(2015)] MacLeod, C. L., Morgan, C. W., Mosquera, A., et al. 2015, ApJ, 806, 258
- [Morgan et al.(2012)] Morgan, C. W., Hainline, L. J., Chen, B., et al. 2012, ApJ, 756, 52
- [Morgan et al.(2010)] Morgan, C. W., Kochanek, C. S., Morgan, N. D., & Falco, E. E. 2010, ApJ, 712, 1129
- [Morgan et al.(2008)] Morgan, C. W., Kochanek, C. S., Dai, X., Morgan, N. D., & Falco, E. E. 2008, ApJ, 689, 755
- [Morgan et al.(2008)] Morgan, C. W., Eyler, M. E., Kochanek, C. S., et al. 2008, ApJ, 676, 80
- [Morgan et al.(2006)] Morgan, C. W., Kochanek, C. S., Morgan, N. D., & Falco, E. E. 2006, ApJ, 647, 874
- [Mosquera et al.(2013)] Mosquera, A. M., Kochanek, C. S., Chen, B., et al. 2013, ApJ, 769, 53
- [Mosquera & Kochanek(2011)] Mosquera, A. M., & Kochanek, C. S. 2011, ApJ, 738, 96
- [Müller & Camenzind(2004)] Müller, A., & Camenzind, M. 2004, A&A, 413, 861
- [Netzer & Peterson(1997)] Netzer, H., & Peterson, B. M. 1997, Astronomical Time Series, 218, 85
- [Peng et al.(2006)] Peng, C. Y., Impey, C. D., Ho, L. C., Barton, E. J., & Rix, H.-W. 2006, ApJ, 640, 114
- [Peterson(1993)] Peterson, B. M. 1993, PASP, 105, 247
- [Planck Collaboration et al.(2015)] Planck Collaboration, Ade, P. A. R., Aghanim, N., et al. 2015, arXiv:1502.01589
- [Poindexter & Kochanek(2010)] Poindexter, S., & Kochanek, C. S. 2010, ApJ, 712, 668
- [Pooley et al.(2007)] Pooley, D., Blackburne, J. A., Rappaport, S., & Schechter, P. L. 2007, ApJ, 661, 19
- [Pooley et al.(2006)] Pooley, D., Blackburne, J. A., Rappaport, S., Schechter, P. L., & Fong, W.-f. 2006, ApJ, 648, 67
- [Popović & Chartas(2005)] Popović, L. Č., & Chartas, G. 2005, MNRAS, 357, 135
- [Popović et al.(2003)] Popović, L. Č., Mediavilla, E. G., Jovanović, P., & Muñoz, J. A. 2003, A&A, 398, 975
- [Popović et al.(2006)] Popović, L. Č., Jovanović, P., Mediavilla, E., et al. 2006, ApJ, 637, 620
- [Reynolds & Nowak(2003)] Reynolds, C. S., & Nowak, M. A. 2003, Phys. Rep., 377, 389
- [Schneider et al.(1992)] Schneider, P., Ehlers, J., & Falco, E. E. 1992, Gravitational Lenses, XIV, 560 pp. 112 figs.. Springer-Verlag Berlin Heidelberg New York. Also Astronomy and Astrophysics Library
- [Shappee et al.(2014)] Shappee, B. J., Prieto, J. L., Grupe, D., et al. 2014, ApJ, 788, 48
- [Yonehara et al.(1999)] Yonehara, A., Mineshige, S., Fukue, J., Umemura, M., & Turner, E. L. 1999, A&A, 343, 41
- [Young & Reynolds(2000)] Young, A. J., & Reynolds, C. S. 2000, ApJ, 529, 101