CSO and CARMA Observations of L1157. I. A Deep Search for Hydroxylamine (NH2OH)
Abstract
A deep search for the potential glycine precursor hydroxylamine (NH2OH) using the Caltech Submillimeter Observatory (CSO) at mm and the Combined Array for Research in Millimeter-wave Astronomy (CARMA) at mm is presented toward the molecular outflow L1157, targeting the B1 and B2 shocked regions. We report non-detections of NH2OH in both sources. We a perform non-LTE analysis of CH3OH observed in our CSO spectra to derive kinetic temperatures and densities in the shocked regions. Using these parameters, we derive upper limit column densities of NH2OH of cm-2 and cm-2 toward the B1 and B2 shocks, respectively, and upper limit relative abundances of and , respectively.
1 Introduction
Glycine (NH2CH2COOH), the simplest amino acid, has been identified in cometary (Elsila et al., 2009) and meteoritic samples (Kvenvolden et al., 1970), however it is not yet known whether the species is formed in these solid bodies, in the interstellar medium (ISM), or both. Indeed, a detection in the ISM has so far proven ellusive (Snyder et al., 2005; Cunningham et al., 2007; Jones et al., 2007). Although chemical models predict the formation of glycine in the ISM, in low abundance (see, e.g. Garrod (2013) and refs. therein), it has been difficult to observationally constrain them without a detection of the species. The relative likelihood of different possible formation routes can, however, be constrained by careful observation of the reactants used in the chemical models to form glycine.
One pathway which has garnered significant interest is the formation of glycine through the reaction of hydroxylamine (NH2OH), or its protonated and ionized derivatives, with acetic acid (CH3COOH), a known interstellar molecule (Mehringer et al., 1997). Ionization or protonation of NH2OH under interstellar conditions should be efficient (Angelelli et al., 1995; Boulet et al., 1999), and subsequent laboratory work has demonstrated the formation of glycine from NH2OH and its ionized and protonated forms (Blagojevic et al., 2003; Snow et al., 2007). Although recent theoretical work has suggested that these gas-phase routes forming glycine through these reactions are inefficient under interstellar conditions (Barrientos et al., 2012), condensed-phase surface-mediated reactions remain a possibility, and observational constraints of the precursors are still desirable for the refinement of models. While acetic acid is readily-constrained, NH2OH has yet to be observed in the ISM.
In recent years, laboratory work has shown that a number of pathways exist which result in efficient formation of NH2OH on grain surfaces. Zheng & Kaiser (2010) demonstrated the formation of NH2OH in H2O-NH3 ices after UV-irradiation. Formation by successive hydrogenation of NO has been shown to proceed efficiently, barrierlessly, and in high yield (Congiu et al., 2012a, b; Fedoseev et al., 2012; Ioppolo et al., 2014; Minissale et al., 2014). Most recently, He et al. (2015) demonstrated the efficient formation of NH2OH via oxidation of NH3 in ices with a low barrier to activation (of order 1000 K).
Earlier modeling work by Garrod et al. (2008) also suggested that NH2OH is formed in high abundance in interstellar ices, and is subsequently liberated into the gas-phase during the warm-up period of emerging hot cores and hot corinos in readily-detectable quantities. Observational efforts by Pulliam et al. (2012), however, failed to detect NH2OH toward a selection of such sources known to be rich in complex organic material (e.g. Sgr B2(N) and Orion-KL) establishing upper limits of N. Refinement of the Garrod et al. (2008) model in subsequent work (Garrod, 2013), as well as limiting modeling presented in the aforementioned laboratory studies, resulted in predicted gas-phase abundances in line with the upper limits established by Pulliam et al. (2012). Yet, with the inclusion of the H + HNO HNOH pathway into the model, as described by the laboratory work of Congiu et al. (2012a), condensed phase abundances of NH2OH again approach N, with gas-phase abundances of N.
The Garrod (2013) model largely assumes that the release of NH2OH into the gas-phase is a gradual process dominated by the warm-up of the hot core. Both the laboratory work and the models, however, predict NH2OH is initially formed in large abundance at very cold ( K) temperatures and early in the evolution of these sources. Thus, the most optimistic source for a detection of gas-phase NH2OH is one where the reservoir of condensed-phase NH2OH formed at low temperatures is liberated en masse into the gas-phase prior to release by thermal mechanisms.
Shocked regions displaying high degrees of molecular complexity likely represent this best-case scenario. In these regions, complex molecules are formed efficiently in ices at low temperatures, but are not otherwise liberated into the gas-phase except by thermal desorption at much greater temperatures. When these ices are subjected to shocks, however, the mantle is non-thermally ejected into the gas-phase, resulting in large abundances of relatively cool ( K), complex organic material (see, e.g., Requena-Torres et al. (2006)). One of the most prominent of these regions is the young protostellar outflow L1157. Numerous recent studies report high degrees of molecular complexity arising from shocked regions within the outflow, which originates in cold, quiescent gas around the protostar (see, e.g., Arce et al. (2008) and Codella et al. (2015)).
Here, we present deep searches for NH2OH using the Caltech Submillimeter Observatory (CSO) at mm and the Combined Array for Research in Millimeter-wave Astronomy (CARMA) at mm toward the L1157 outflow. We report non-detections of NH2OH in both searches. In order to derive upper limits to the column density of NH2OH, we use transitions of CH3OH observed with the CSO to constrain the kinetic temperature and density in the shocked gas using a radiative-transfer approach, and CARMA images of CH3OH to determine the size of the shocked gas. Finally, we estimate upper limits to the abundance of NH2OH and discuss possible implications.
2 L1157
L1157 is a dark cloud in Cepheus located a distance of 250 pc (Looney et al., 2007), and contains a prototypical shocked bipolar outflow from a Class 0 protostar. It has been the subject of great interest in the last twenty years, with numerous studies investigating the physical conditions within the source. Due to the variety of methods used for these studies, direct comparisons between results is challenging. Nevertheless, an overall picture does come into view, and this general description will be sufficient for the discussion presented here.
Originating in the cold, quiescent gas ( K, Bachiller et al. (1993)) surrounding the Class 0 protostar L1157-mm, the southern lobe of the accelerated outflow ( K, Bachiller et al. (1993)) has undergone two major shocks, referred to as L1157-B1 and L1157-B2. The B1 shock is younger and warmer (2000 yr, K) than the B2 shock (4000 yr, K), and many complex chemical species are observed in enhanced abundance toward both shocks due to non-thermal desorption from grains (Mendoza et al., 2014; Codella et al., 2015). While the absolute values of these physical parameters vary somewhat within the literature, this qualitative picture and enhancement in chemical abundance is consistently reported.
3 CSO Observations
The spectrum toward L1157 obtained with the CSO was collected over 8 nights in 2012 July, August, and September, and 7 nights in 2014 September and December. The telescope was pointed at the B1 shocked region at (J2000) = 203907.7, (J2000) = 68∘01′15′′.5 and the B2 shocked region at (J2000) = 203913, (J2000) = 68∘00′37′′ (see Figure 1) and spectra were adjusted to a = 1.75 km s-1. A small subset of scans toward B1 were obtained at a second position offset by -4″ in declination. The CSO 230/460 GHz sidecab double-sideband (DSB) heterodyne receiver was used in fair weather ( 0.1 – 0.25) which resulted in typical system temperatures of 300 – 500 K. The backend was a fast Fourier-transform spectrometer which provided 1 GHz of DSB data at 122 kHz resolution (0.2 km s-1 at 230 GHz). The total frequency coverage was 188 – 193 GHz, 200 – 205 GHz, 237 – 243 GHz, and 249 – 255 GHz toward B1, and 237 – 243 GHz and 249 – 255 GHz toward B2. The targeted transitions of NH2OH are given in Table 1.
A chopping secondary mirror with a throw of 4′ was used for ON-OFF calibration. Pointing was performed every 2 hours and typically converged to within 1 – 2″. The raw data were calibrated using the standard chopper wheel calibration method resulting in intensities on the atmosphere-corrected temperature scale. These were then corrected to the main beam temperature scale, , where . For these observations, the main beam efficiency was . The spectra were collected in DSB mode at a variety of IF settings to allow for a robust deconvolution. The CLASS package from the GILDAS suite of programs111Institut de Radioastronomie Millimétrique, Grenoble, France - http://www.iram.fr/IRAMFR/GILDAS was used for the data reduction. Spurious signals were removed from the spectra, which were then baseline subtracted using a polynomial fit. The standard CLASS deconvolution routine was used to generate single-sideband data. The spectra were then Hanning smoothed to a resolution of 1.4 km s-1. The average full-width half-maximum linewidth in B1 was 7.9 km s-1, and in B2 was 5.2 km s-1.
| Transition | Frequency**Transitions and parameters accessible at www.splatalogue.net. Original laboratory work reported by Tsunekawa (1972) and Mornio et al. (2000). Catalogued at CDMS (Müller et al., 2005). | S | ††Values were taken from corresponding transitions of -CH3OH obtained from the Leiden Atomic and Molecular Database (Schöier et al., 2005) and used without further modification. Original data reported by Rabli & Flower (2010). | log() | ‡‡Given as = | |
|---|---|---|---|---|---|---|
| (MHz) | (K) | (Debye2) | (cm3 s-1) | (log(s-1)) | (cm-3) | |
| 21,2 – 11,1 | 100683.58(20) | 15.204 | 0.520 | -5.9079 | ||
| 20,2 – 10,1 | 100748.23(20) | 7.2527 | 0.694 | -5.7821 | ||
| 21,1 – 11,0 | 100807.62(20) | 15.213 | 0.520 | -5.9062 | ||
| 51,5 – 41,4 | 251677.3666(78) | 44.194 | 1.665 | -4.5515 | ||
| 54,1 – 44,0 | 251734.8061(82) | 163.51 | 0.625 | -4.9771 | ||
| 54,2 – 44,1 | 251734.8061(82) | 163.51 | 0.625 | -4.9771 | ||
| 53,3 – 43,2 | 251780.3167(70) | 107.85 | 1.110 | -4.7270 | ||
| 53,2 – 43,1 | 251780.3178(70) | 107.85 | 1.110 | -4.7270 | ||
| 52,4 – 42,3 | 251811.9913(70) | 68.081 | 1.457 | -4.6088 | ||
| 52,3 – 42,2 | 251813.8609(70) | 68.081 | 1.457 | -4.6087 | ||
| 50,5 – 40,4 | 251838.4937(79) | 36.261 | 1.735 | -4.5329 | ||
| 51,4 – 41,3 | 251987.1350(78) | 44.239 | 1.665 | -4.5498 |
4 CARMA Observations
A total of 89.3 hours of observations were conducted with the CARMA 15-element array in C-configuration (2013 May), D-configuration (2012 October, November), and E-configuration (2012 August) at mm. The phase center for these observations was (J2000) = 203907.7, (J2000) = 68∘01′11′′.5. The CARMA correlator was used in its 62 MHz bandwidth, 3-bit mode providing 255 channels across the band for a resolution of 243 kHz or 0.7 km s-1. The three targeted transitions of NH2OH are given in Table 1.
MWC349 and Neptune were used as primary flux calibrators; the passband calibrators were 1635+381, 2232+117, 0102+584, 1743-038, 2015+372, and 3C84. The gain calibrator was 1927+739. Data reduction was completed using the Miriad package. Data were flagged for antennas that were offline or malfunctioning during observation or when the phases in the calibrators had deviations greater than thirty degrees from a smooth trend line. Image cleaning was also performed using Miriad. The robust factor tended towards natural weighting with cell size set to 0.4″ and image size of 1024 pixels. No channel averaging was applied for the maps shown; however, channel averaging to 1.4 km s-1 was used on windows targeting hydroxylamine transitions. Clean regions were drawn with the polygon tool around clear emission and cleaned to an average noise of 0.7 mJy beam-1. The restoring beam was typically 3″.4 3″.2.
The full set of observations toward L1157 CARMA included a host of other molecular species, and will be presented in a follow-up paper by Dollhopf et al. (2015).
5 Non-LTE Modeling of CH3OH
An accurate determination of NH2OH column density upper limits in the B1 and B2 shocks requires the kinetic temperature and density in these regions. To obtain these, we fit the observed CH3OH emission in the same spectral window (Table 2) to a non-LTE model of the outflow and shock, based on a physical model derived from our our CARMA observations, using the RADEX code (van der Tak et al., 2007).
| Transition△△“+” and “-” refer to and parity states, respectively. For -CH3OH, a negative value of is used to differentiate between (+) and (-) states, which belong to the same symmetry species. | Frequency**Transitions and parameters accessible at www.splatalogue.net. Original laboratory work reported by Xu & Lovas (1997) and references therein and by Müller et al. (2004). Catalogued at CDMS (Müller et al., 2005). Except where noted, uncertainties are 50 kHz. | S | ††Values obtained from the Leiden Atomic and Molecular Database (Schöier et al., 2005). Original data reported by Rabli & Flower (2010). | log() | ‡‡Given as = | |
|---|---|---|---|---|---|---|
| (MHz) | (K) | (Debye2) | (cm3 s-1) | (log(s-1)) | (cm-3) | |
| -CH3OH | ||||||
| 20,2 – 10,1 + + | 96741.375(5) | 6.9650 | 1.617 | -5.4675 | ||
| 51,5 – 41,4 + + | 239746.253 | 49.059 | 3.885 | -4.2468 | ||
| 50,5 – 40,4 + + | 241791.431 | 34.817 | 4.043 | -4.2184 | ||
| 53,3 – 43,2 + + | 241832.91(20) | 84.618 | 2.578 | -4.4137 | ||
| 53,2 – 43,1 - - | 241832.91(20) | 84.618 | 2.578 | -4.4137 | ||
| 52,4 – 42,3 - - | 241842.324 | 72.530 | 3.415 | -4.2915 | ||
| 52,3 – 42,2 + + | 241887.704 | 72.533 | 3.415 | -4.2912 | ||
| 51,4 – 41,3 - - | 243915.826 | 49.661 | 3.885 | -4.2243 | ||
| 110,11 – 101,10 + + | 250506.980 | 153.10 | 10.63 | -4.0728 | ||
| 83,5 – 82,6 - + | 251517.262 | 133.36 | 7.308 | -4.0990 | ||
| 73,4 – 72,5 - + | 251641.667 | 114.79 | 6.279 | -4.1099 | ||
| 63,3 – 62,4 - + | 251738.520 | 98.546 | 5.224 | -4.1272 | ||
| 53,2 – 52,3 - + | 251811.882 | 84.618 | 4.126 | -4.1567 | ||
| 43,1 – 42,2 - + | 251866.579 | 73.012 | 2.954 | -4.2144 | ||
| 53,3 – 52,4 + - | 251890.901 | 84.619 | 4.125 | -4.1564 | ||
| 63,4 – 62,5 + - | 251895.728 | 98.545 | 5.220 | -4.1266 | ||
| 43,2 – 42,3 + - | 251900.495 | 73.012 | 2.953 | -4.2143 | ||
| 33,0 – 32,1 - + | 251905.812 | 63.727 | 1.641 | -4.3603 | ||
| 33,1 – 32,2 + - | 251917.042 | 63.727 | 1.641 | -4.3603 | ||
| 73,5 – 72,6 + - | 251923.631 | 114.79 | 6.272 | -4.1089 | ||
| 83,6 – 82,7 + - | 251984.702 | 133.36 | 7.293 | -4.0975 | ||
| -CH3OH | ||||||
| 2-1,2 – 1-1,2 | 96739.362(5) | 12.541 | 1.213 | -5.5922 | ||
| 20,2 – 10,2 | 96744.550(5) | 20.090 | 1.617 | -5.4675 | ||
| 21,1 – 11,0 | 96755.511(5) | 28.011 | 1.244 | -5.5811 | ||
| 50,5 – 40,4 | 241700.219 | 47.934 | 4.040 | -4.2192 | ||
| 5-1,5 – 4-1,4 | 241767.224 | 40.391 | 3.882 | -4.2362 | ||
| 53,2 – 43,1 | 241843.646 | 82.531 | 2.587 | -4.4120 | ||
| 51,4 – 41,3 | 241879.073 | 55.871 | 3.980 | -4.2248 | ||
| 5-2,4 – 4-2,3 | 241904.152 | 60.725 | 3.399 | -4.2932 | ||
| 52,3 – 42,2 | 241904.645 | 57.069 | 3.356 | -4.2987 | ||
| 20,2 – 1-1,1 | 254015.340 | 20.090 | 0.499 | -4.7208 | ||
Note. — Only transitions with modeled peak intensity above 5 mK are listed here. A complete modeled spectrum is available as Supplementary Information.
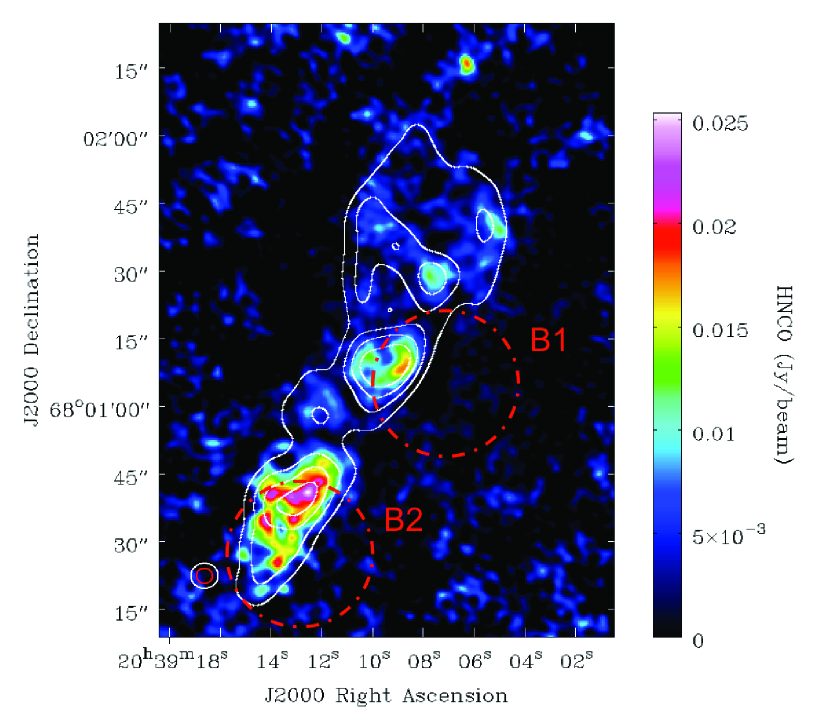
First, we determined the approximate spatial extent and location of the shocked gas from the CH3OH emission observed with CARMA. Figure 1 shows the CSO beam at the targeted positions overlaid on our CARMA observations of CH3OH and HNCO222Details and analysis of the HNCO observations will be presented in Paper II by Dollhopf et al. (2015) at mm. The pointing position for B1 was chosen from the literature prior to our CARMA observations, and is roughly centered on the shock front, rather than the peak of the shock emission. The pointing position for B2 was chosen after we had acquired the CARMA observations, and is centered on the peak of the shocked HNCO emission. In both cases, the shock is nearly completely contained within the beam, and we estimate a reasonable equivalent size of 12″ for the shock, and 20″ for the second component, within our 30″ CSO beam. In B1, the shock is not centered in the beam, and thus any emission will suffer more significant fall-off effects than in B2.
We made the initial assumption that the two components in our fit represented the shocked gas and the outflow. Under these assumptions, and based on our CARMA observation as well as prior studies (Bachiller et al., 1995), we constrained the fit of the CH3OH emission with the following assumptions:
-
1.
The kinetic temperature of the shock was no less than that of the outflow.
-
2.
The density of the shock was no less than that of the outflow.
-
3.
The column density of CH3OH was no less in the shock than in the outflow.
Assumptions (1) and (2) are well-substantiated in the literature, both toward L1157 (Bachiller et al., 1995) and in shocked environments in general (van Disheock & Blake, 1998), and assumption (3) agrees with the previous findings of Bachiller et al. (1995). Using these constraints, and the two-source component model described earlier, we performed a reduced- analysis of a grid of models for the CSO observations, simultaneously fitting - and -CH3OH following the methods described in Crockett et al. (2014). A thorough discussion of the uncertainties in the fitting method is provided in Appendix A.
Based on these uncertainties, and the assumptions described above, we find the parameters in Table 3 represent a best-fit to the data, with reduced- values of 2.50 and 1.77 for B1 and B2, respectively. These values are likely due to the simplicity of our model relative to the complexity of the source. Literature sources (see, e.g., Lefloch et al. (2012)) suggest a structure with three or more components is more realistic, but such additional components would not be well-constrained in our case due to the limited number of observed CH3OH transitions. Additionally, there are likely quite large temperature and density gradients, especially in the newer, more compact B1 shock, which will contribute additional error to the fit which is not accounted for in our analysis. Finally, CH3OH excitation is sensitive to the far-IR radiation field present, which we have assumed as standard galactic background, any deviation from which would further impact the accuracy of the model and increased the ultimate .
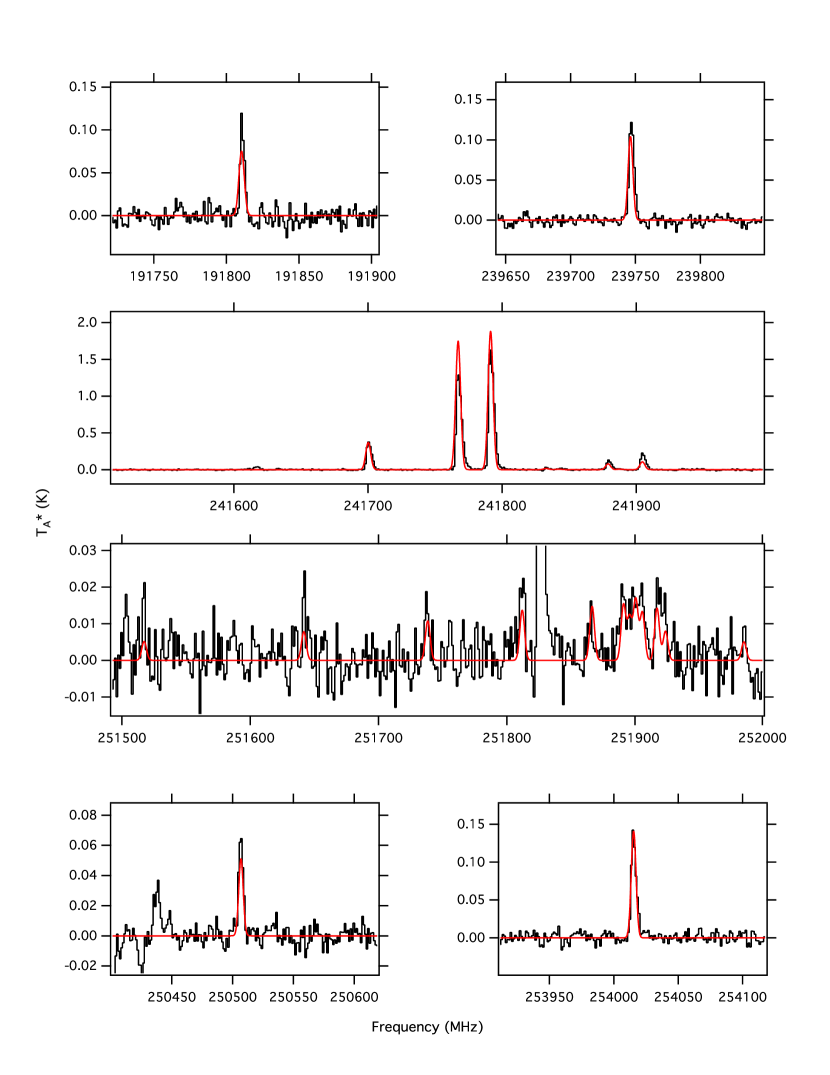
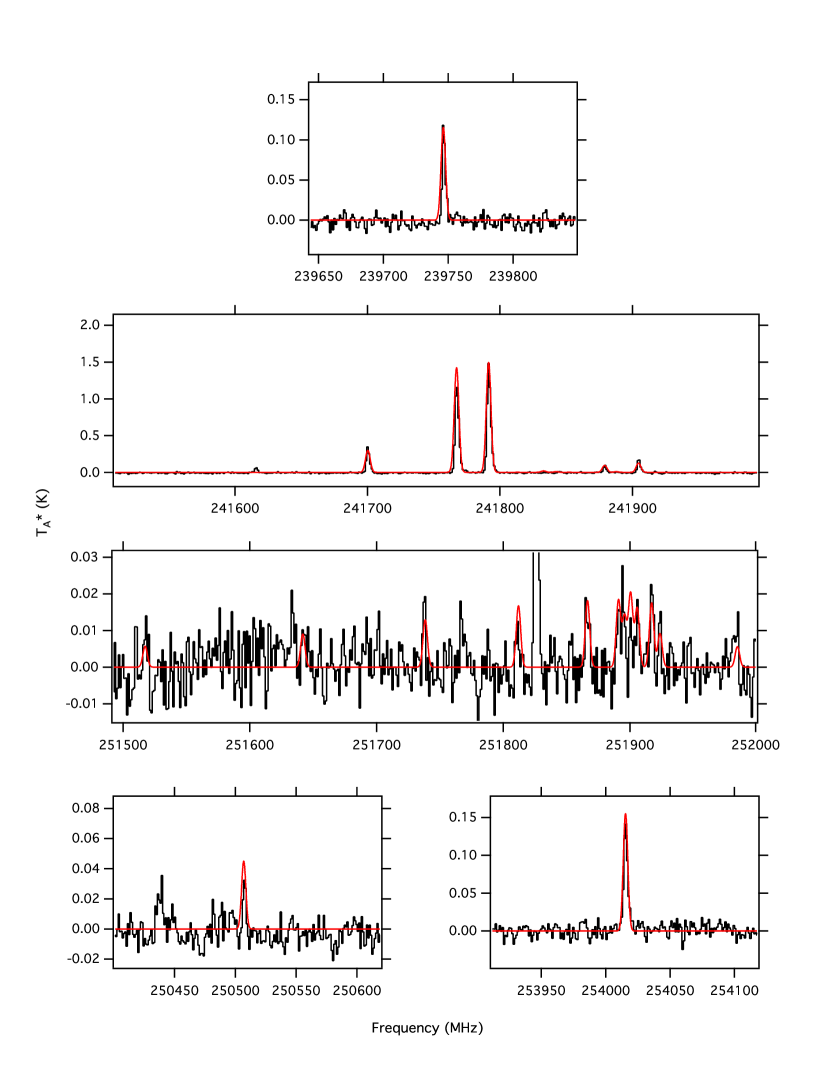
Simulated non-LTE spectra of CH3OH from these results toward B1 and B2 are provided in Figures 2 and 3, respectively, overlaid on observations and corrected for beam efficiency and a 12″ source size. The CH3OH column densities and H2 densities found here are in relatively good agreement with previous observations of the source (Bachiller et al., 1995; Bachiller & Pérez Gutiérrez, 1997; Sugimura et al., 2010). The derived values of for the warmer component, which we ascribe to the shocks, agrees well with previous measurements in B2 (Lefloch et al., 2012), while the upper range of our derived value in B1 falls at the lower edge of previous measurements.
The kinetic temperature of the second component ( K) is significantly lower than previous measurements of both the shock and the outflow ( K), indicating that it is likely not probing the outflow as we had originally presumed. Instead, toward B1, this component is more likely related to the component described by Lefloch et al. (2012) as remnants from the gas in which the earlier B2 shock was formed, also offering a possible explanation for the component’s presence toward B2. The component has been reported to be both cold ( K) and extended Mendoza et al. (2014); Lefloch et al. (2012), in qualitatively good agreement with our fit.
| L1157-B1 | L1157-B2 | ||||
|---|---|---|---|---|---|
| Parameter | Component 1 | Component 2 | Component 1 | Component 2 | |
| (cm-3) | |||||
| (K) | 60(20) | 10(3) | 50(15) | 10(3) | |
| (cm-2) | |||||
Note. — Errors given are from Equation A1 and calculated to be 32%.
6 Results
Despite deep searches, we find no conclusive evidence for NH2OH emission at mm or mm in either the CARMA or the CSO data, respectively. To calculate appropriate upper limits for NH2OH in the both datasets, we assume that NH2OH, if present in the gas phase, originates in the warm, shocked gas traced by the warm, dense CH3OH component. The rationale for this assumption is discussed in §7.
6.1 NH2OH in CSO Data
Near the temperatures derived from our RADEX fit in the warm component toward B1 and B2, the strongest NH2OH transition is the 50,5 – 40,4 at 251838 MHz. As noted in Table 1, the critical density () for this transition is cm-3. This value is based on the assumption that the collisional coefficients for NH2OH are similar to those of -CH3OH. While not exact, the similar mass, dipole moments, molecular size, and energy level structures make this a reasonable approximation within the context of the following discussion.
Given the densities derived from our RADEX fit (3 – 6 cm-3), we therefore assume that, at least for this transition, LTE is a reasonable approximation for determining NH2OH upper limits and thus . Under these conditions, we derive 1 upper limit column densities for NH2OH of cm-2 and cm-2 in B1 and B2, respectively.
Lefloch et al. (2012) derive a CO column density of cm-2 in the component of the B1 shock, arising from the shocked gas and covering the entire region, assuming a 20″ source size. Assuming the CO is homogeneously distributed over the region, this gives a source-averaged CO column of cm-2 for the 12″ source size used here. Taking (c.f. Bolatto et al. (2013) and Lefloch et al. (2012)), this results in an H2 column density of cm-2. A similar argument using the CO column density of cm-2 for B2 found by Bachiller & Pérez Gutiérrez (1997) also results in an H2 column density of cm-2. This gives upper limits to the fractional abundances of NH2OH of and for B1 and B2, respectively.
6.2 NH2OH in CARMA Data
To calculate appropriate upper limits for NH2OH in the CARMA data, we again assume that NH2OH, if present in the gas phase, originates in the warm, shocked gas traced by the warm, dense CH3OH component. The spectra extracted from a 12″ beam centered on these locations are shown in Figure 4. While there is an unidentified feature at the frequency of the NH2OH transition, if this were truly NH2OH emission, the other transitions in the observed window would be of equal or greater intensity.
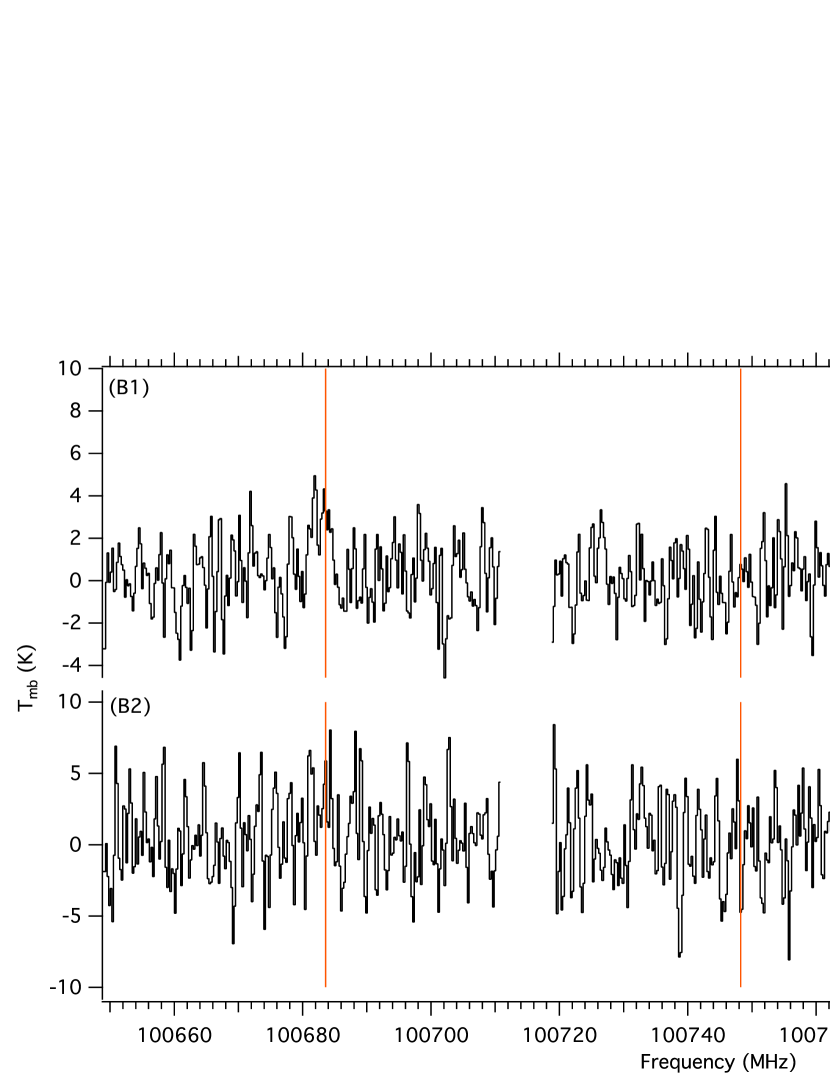
We measure the RMS to be 1.6 mK and 2.9 mK in the B1 and B2 spectra. At the derived temperatures, the transitions at 100748 MHz is predicted to be strongest. As both B1 and B2 have densities higher than for this transition (see Table 1), we again derive an upper limit to the column density assuming LTE conditions.
Following the same procedure as for the CSO data, we find a 1 upper limit of NH2OH of cm-2 for B1 and cm-2 for B2. This gives upper limits to the fractional abundances of NH2OH of and for B1 and B2, respectively. All results are summarized in Table 4.
| CSO mm | CARMA mm | ||||
|---|---|---|---|---|---|
| B1 | B2 | B1 | B2 | ||
| (cm-2) | |||||
7 Discussion and Conclusions
In §6, we assumed that NH2OH, if present, would arise predominantly the warm, shocked regions B1 or B2, rather than the molecular outflow. Zheng & Kaiser (2010) show that NH2OH is thermally liberated from their laboratory samples between 160 – 180 K, whereas for realistic interstellar ices and conditions, temperatures above 110 K are likely sufficient (Collings et al., 2004). Both our non-LTE fits, and the literature values discussed earlier have shown that temperatures in the targeted regions are below these thresholds, and thus a thermal mechanism for the desorption of NH2OH from grain surfaces in L1157 is unlikely. Thus, non-thermal desorption in the shocks should be the dominant mechanism for NH2OH liberation, and any NH2OH emission should trace these shocked regions.
The upper limit column densities established with the CARMA data are equivalent to those established by Pulliam et al. (2012) of cm-2. The limits established by Pulliam et al. (2012), however, are beam-averaged column densities, whereas the CARMA measurements presented here provide a more well-constrained source size, and thus a more robust upper limit. Nevertheless, the upper limits to relative abundance found here are significantly higher than those determined by Pulliam et al. (2012) of 10-10 due to the low H2 column in the region. These low columns are common in other chemically-complex shocked regions as well, such as a host of Galactic Center clouds studied by Requena-Torres et al. (2006) ( cm-2), and other shocked outflows like BHR 71 ( cm-2; Garay et al. (1998)).
Yet, these regions likely represent the best-case scenario for a gas-phase detection of NH2OH. Such a detection is critical to accurately constrain the application of laboratory results, which show NH2OH is a significant player in grain-surface nitrogen chemistry, to chemical models. The deep search presented here stretched the capabilities of the CSO and CARMA to the limit; searches deep enough to be sensitive to the relative abundances predicted by laboratory work and modeling are simply time-prohibitive on these types of instruments. The Garrod (2013) model, without the addition of the H + HNO HNOH pathway, predicts peak condensed-phase NH2OH abundances of , which, if liberated en masse in a shock, is a detectable population, but likely only with the sensitivity and spatial resolution of ALMA. The upper limits established here, however, are several orders of magnitude lower than both the condensed-phase and gas-phase populations predicted by the augmented model which includes this hydrogenation pathway. Thus, our results demonstrate that further efforts are needed both in modeling and in the laboratory, to identify and fully-constrain both the formation and the destruction pathways for NH2OH.
Appendix A Error Analysis
The uncertainty in the observations is given as Equation A1, modified from Equation A1 in Crockett et al. (2014).
| (A1) |
is the uncertainty due to the RMS noise level of the spectra. This value is consistently 0.0058 K across the CH3OH transitions in B1, and 0.0078 K in B2.
is the uncertainty in the absolute flux calibration of the observations, which is 30%.
is the uncertainty in the pointing accuracy, which is taken to be 2″ based on the average convergence of pointing observations throughout the observing period.
is the uncertainty in the beam-filling factor. The size of the telescope beam varies by 4″ across the band, is well-described, and is calculated independently at each transition frequency, thus we assume no contribution to from the telescope beam. However, the sizes of the two source components are not a varied parameter, and are only modestly well-described by our CARMA observations. Further, in the case of B1, the shock is positioned off-center of the beam, making the emission more sensitive to fall-off effects that are not accounted for explicitly in the calculations. We therefore assume a factor of two uncertainty in source size to take both issues into consideration, which is reflected in .
These result in net uncertainties of 32% in the absolute intensity of the observed transitions, with the largest contribution from the absolute flux calibration. values outside of the extremes represented by these uncertainties more than double those of the best-fit parameters, so we take 32% to be a reasonable estimate of the overall uncertainty in n, , and .
References
- Angelelli et al. (1995) Angelelli, F., Aschi, M., Cacace, F., Pepi, F., & de Petris, G. 1995, J. Phys. Chem., 99, 6551.
- Arce et al. (2008) Arce, H.G., Santiago-García, J., Jørgensen, J.K, Tafalla, M., & Bachiller, R. 2008, ApJL, 681, L21.
- Bachiller et al. (1993) Bachiller, R., Martín-Pintado, J., & Fuente, A. 1993, ApJL, 417, L45.
- Bachiller et al. (1995) Bachiller, R., Liechti, S., Walmsley, C.M., & Colomer, F., 1995, A&A, 295, L51.
- Bachiller & Pérez Gutiérrez (1997) Bachiller, R. & Pérez Guti’eerrez, M. 1997, ApJ, 487, L93
- Barrientos et al. (2012) Barrientos, C., Redondo, P., Largo, L., Rayon, V.M., Largo, A. 2012, ApJ, 748, 99.
- Blagojevic et al. (2003) Blagojevic, V., Petrie, S., & Bohme, D.K. 2003, MNRAS, 339, L7.
- Bolatto et al. (2013) Bolatto, A.D., Wolfire, M., & Leroy, A.K. 2013, ARA&A, 51, 207.
- Boulet et al. (1999) Boulet, P., Gilardoni, F., Weber, J., Chermette, H., & Ellinger, E. 1999, Chem. Phys., 244, 163.
- Codella et al. (2015) Codella, C., Fontani, F., Ceccarelli, C., et al. 2015, MNRAS, 449, L11.
- Collings et al. (2004) Collings, M.P., Anderson, M.A., Chen, R., et al. 2004, MNRAS, 354, 1133.
- Congiu et al. (2012a) Congiu, E., Fedoseev, G., Ioppolo, S., et al. 2012a, ApJL, 750, L12.
- Congiu et al. (2012b) Congiu, Chaabouni, H., Laffon, C., et al. 2012b, J. Chem. Phys., 137, 054713.
- Crockett et al. (2014) Crockett, N.R., Bergin, E.A, Neill, J.L., et al. 2014, ApJ, 787, 112.
- Cunningham et al. (2007) Cunningham, M.R., Jones, P.A., Godfrey, P.D., et al. 2007, MNRAS, 376, 1201.
- Elsila et al. (2009) Elsila, J.E., Glavin, D.P., & Dworkin, J.P. 2009, Meteor. & Planet. Sci., 44, 1323.
- Fedoseev et al. (2012) Fedoseev, G., Ioppolo, S., Lamberts, T., et al. 2012, J. Chem. Phys., 137, 054714.
- Garay et al. (1998) Garay, G., Köhnenkamp, I., Bourke, T.L., Rodríguez, L.F., & Lehtinen, K.K. 1998, ApJ, 509, 768.
- Garrod et al. (2008) Garrod, R.T., Widicus Weaver, S.L., & Herbst, E. 2008, ApJ, 682, 283.
- Garrod (2013) Garrod, R.T. 2013, ApJ, 765, 60.
- Gueth et al. (1996) Gueth, F., Guilloteau, S., & Bachiller, R. 1996, A&A, 307, 891.
- He et al. (2015) He, J., Vidali, G., Lemaire, J.-L., & Garrod, R.T. 2015, ApJ, 799, 49.
- Ioppolo et al. (2014) Ioppolo, S., Fedoseev, G., Minissale, M., Congiu, E., Dulieu, F., & Linnartz, H. 2014, PCCP, 16, 8270.
- Jones et al. (2007) Jones, P.A., Cunningham, M.R., Godfrey, P.D., & Cragg, D.M. 2007, MNRAS, 374, 579.
- Kuan et al. (2003) Kuan, Y.-J., Charnley, S.B., Huang, H.-C., Tseng, W.-L., & Kisiel, Z. 2003, ApJ, 593, 848.
- Kvenvolden et al. (1970) Kvenvolden, K, Lawless, J., Pering, K., et al. 1970, Nature, 228, 923.
- Largo et al. (2009) Largo, L., Rayón, V.M., Barrientos, C., Largo, A., & Redondo, P. 2009, Chem. Phys. Lett., 476, 174.
- Looney et al. (2007) Looney, L.W., Tobin, J.J., Kwon, W. 2007, ApJL, 670, L131.
- Lefloch et al. (2012) Lefloch, B., Cabrit, S., Busquet, G., et al. 2012, ApJ, 757, L25.
- Mehringer et al. (1997) Mehringer, D.M., Snyder, L.E., Miao, Y., & Lovas, F.J. 1997, ApJL, 480, L71.
- Mendoza et al. (2014) Mendoza, E., Lofloch, B., López-Sepulcre, A., et al. 2014, MNRAS, 445, 151.
- Minissale et al. (2014) Minissale, M., Fedoseev, G., Congiu, E., Ioppolo, S., Dulieu, F., & Linnartz, H. 2014, PCCP, 16, 8257.
- Mornio et al. (2000) Morino, I., Yamada, K.M.T., Klein, H., et al. 2000, J. Mol. Struct., 517, 367.
- Müller et al. (2004) Müller, H.S.P., Menten, K., & Mäder, H. 2004, A&A, 428, 1019.
- Müller et al. (2005) Müller, H.S.P., Schlöder, F., Stutzki, J, & Winnewisser, G. 2005, 742, 215.
- Pulliam et al. (2012) Pulliam, R.L., McGuire, B.A., & Remijan, A.J. 2012, ApJ, 751, 1.
- Rabli & Flower (2010) Rabli, D. & Flower, D.R. 2010, MNRAS, 406, 95.
- Requena-Torres et al. (2006) Requena-Torres, M.A., Martín-Pintado, J., Rodríguez-Franco, A., Martín, S., Rodríguez-Fernández, N.J., & de Vicente, P. 2006, A&A, 455, 971.
- Schöier et al. (2005) Schöier, F.L., van der Tak, F.F.S., van Dishoeck, E.F., & Black, J.H. 2005, A&A, 432, 369.
- Snow et al. (2007) Snow, J.L., Orlova, G., Blagojevic, V., & Bohme, D.K. 2007, JACS, 129, 9910.
- Snyder et al. (2005) Snyder, L.E., Lovas, F.J., Hollis, J.M., et al. 2005, ApJ, 619, 914.
- Sugimura et al. (2010) Sugimura, M., Takahiro, Y., Takeshi, S., et al. 2010, PASJ, 63, 459.
- Tafalla & Bachiller (1995) Tafalla, M. & Bachiller, R. 1995, ApJL, 443, L37.
- Tsunekawa (1972) Tsunekawa, J. 1972, J. Phys. Soc. Jpn., 33, 167.
- Xu & Lovas (1997) Xu, L.-H. & Lovas, F.J. 1997, J. Phys. Chem. Ref. Dat., 26, 17.
- van der Tak et al. (2007) van der Tak, F.F.S., Black, J.H., Schöier, F.L., Jansen, D.J., & van Dischoeck, E.F. 2007, A&A, 468, 627.
- van Disheock & Blake (1998) van Dishoeck, E.F. & Blake, G.A. 1998, ARA&A, 36, 317.
- Zheng & Kaiser (2010) Zheng, W. & Kaiser, R.I. 2010, J. Phys. Chem. A, 114, 5251.