Evidence for a transition region response to penumbral microjets in sunspots
Abstract
Penumbral microjets are short-lived, fine-structured and bright jets that are generally observed in chromospheric imaging of the penumbra of sunspots. Here we investigate their potential transition region signature, by combining observations with the Swedish 1-m Solar Telescope (SST) in the Ca ii H and Ca ii 8542 Å lines with ultraviolet imaging and spectroscopy obtained with the Interface Region Imaging Spectrograph (IRIS), which includes the C ii 1334/1335 Å, Si iv 1394/1403 Å and Mg ii h & k 2803/2796 Å lines. We find a clear corresponding signal in the IRIS Mg ii k, C ii and Si iv slit-jaw images, typically offset spatially from the Ca ii signature in the direction along the jets: from base to top, the penumbral microjets are predominantly visible in Ca ii, Mg ii k and C ii/Si iv, suggesting progressive heating to transition region temperatures along the jet extent. Hence, these results support the suggestion from earlier studies that penumbral microjets may heat to transition region temperatures.
Subject headings:
Sun: activity — Sun: chromosphere — Sun: transition region — sunspotsmydate\THEYEAR,\monthname[\THEMONTH], \THEDAy
1. Introduction
Penumbral microjets (PMJs) are a prime example of the fine-structured dynamics observed in active regions and in sunspots in particular. They were first reported by Katsukawa et al. (2007) in Ca ii H imaging of a sunspot observed at different viewing angles with the Solar Optical Telescope (SOT; Tsuneta et al. 2008) aboard Hinode (Kosugi et al. 2007) and were found to occur near bright penumbral grains. In regular imaging, but especially in time-difference movies, they pop up unmistakably as small-scale, short-lived jets with average lengths between 1–4 Mm, widths of a few hundred kilometers, lifetimes of up to a minute and apparent extension speeds well over 100 km s-1. PMJs have also been observed in the wings of the Ca ii 8542 Å line, with a typically blue-over-red asymmetric spectral profile peaking between 10–20 km s-1 blue-ward of the line core (Reardon et al. 2013; Drews (2014)).
When observed at different viewing angles, their orientation with respect to the background penumbra is also revealing: towards the limb microjets appear at an angle to the photospheric penumbral filaments, while they are well-aligned closer to disc center. This suggests that PMJs are (at least initially) more upright than the photospheric penumbral filaments and indeed inclination angles to the normal ranging between 20∘–70∘ have been found (Katsukawa et al. 2007), with a tendency for increasing angles from the inner to the outer penumbral boundary (Jurčák & Katsukawa 2008). This outward trend is indicative of PMJs following the magnetic field as it expands from the initially near-vertical orientation in the photosphere to a more horizontal orientation in the chromosphere.
These observations also fit with a scenario in which the PMJs are driven by reconnection between penumbral magnetic fields. The darker penumbral filaments are known to host more horizontal fields, while the brighter penumbral areas and grains harbor more vertical fields (Langhans et al. 2005). As the latter move inwards, towards the sunspot umbra, the shearing reconnection between inclined penumbral fields may provide the necessary energy to drive the PMJs. Katsukawa & Jurčák (2010) and Jurčák & Katsukawa (2010) found downflows in the penumbra that in some cases appeared to be related to PMJs, fitting the reconnection scenario.
The launch of the Interface Region Imaging Spectrograph (IRIS; De Pontieu et al. 2014) has opened a new, high-resolution window on the chromosphere and transition region and its data are therefore perfectly suited for investigating the potential transition region response to PMJs (the presence of which was already speculated by Katsukawa et al. 2007). By combining IRIS observations with data from the Swedish 1-m Solar Telescope (SST; Scharmer et al. 2003) for PMJ detection, this work aims at investigating the characteristic ultraviolet signature of the jets and the time-dependence of their visibility in chromospheric and transition region diagnostics.
2. Observations and Analysis
Data acquisition and reduction
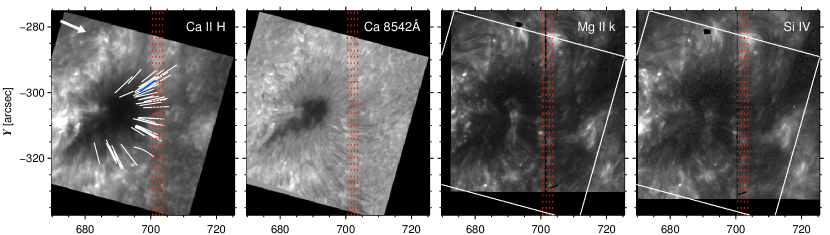
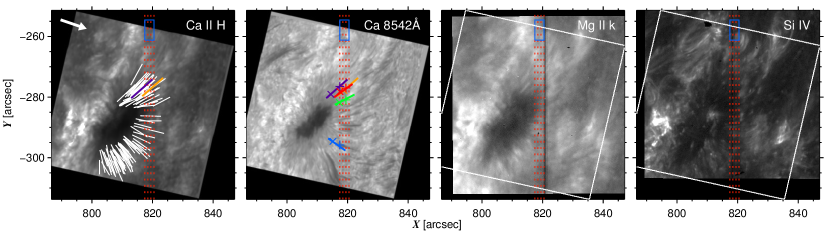
For this study we analyzed two data sets of coordinated SST and IRIS observations obtained on 2014 September 5 and 6, tracking the leading sunspot in AR 12152. Figure 1 shows sample field-of-view images for both days in different SST and IRIS diagnostics. The CRisp Imaging SpectroPolarimeter (CRISP; Scharmer et al. 2008) at the SST recorded imaging spectroscopy in the H and Ca ii 8542 Å lines, in addition to full Stokes polarimetry at one wavelength position in the blue wing of Fe i 6301 Å. The overall repeat cadence of this program is 11.6 s. CRISP observed from 07:58–09:52 UT and from 08:23–10:24 UT on the respective days. In addition, part of the light from the telescope was diverted before entering CRISP to provide Ca ii H core (filter full-width at half-maximum of 1.1 Å) and wide-band imaging. On September 5, the Ca ii H data were obtained only during 07:59–09:07 UT, while on September 6 the full CRISP sequence was supported by Ca ii H imaging. In this study, only Ca ii 8542 Å and Ca ii H core data were used for further analysis.
During these coordinated observations, IRIS ran a 4-step sparse raster (OBSID 3820255167) with 2 second exposures, wavelength binning by 2 in the far ultraviolet (affecting only the spectra between 1332–1407 Å), and including context slit-jaw imaging in three channels, C ii 1330 Å, Si iv 1400 Å and Mg ii k 2796 Å. The overall repeat cadence of both the raster and the slit-jaws is 13 s. IRIS co-observed between 08:06–11:06 UT and 08:05–11:01 UT on the respective days.
We used the CRISPRED pipeline (see de la Cruz Rodríguez et al. (2015) and references therein) for reduction of the SST/CRISP data. The Ca ii H data were processed using a similar set of procedures, including dark and flat field corrections, as well minimization of high-order seeing effects using Multi-Object Multi-Frame Blind Deconvolution (MOMFBD; van Noort et al. 2005) and removal of rubber-sheet distortions through destretching following Shine et al. (1994). The resulting Ca ii H data have the same 11.6 s cadence as the CRISP data. Co-alignment was achieved using the procedures as described in Vissers et al. (2015) and using SST Ca ii 8542 Å/Ca ii H (for September 5 and 6, respectively) and IRIS Mg ii k 2796 Å as reference. The CRisp SPectral EXplorer (CRISPEX; Vissers & Rouppe van der Voort 2012) was extensively used during alignment and for subsequent data analysis.
Event selection
Penumbral microjets were initially detected based on morphology and lifetime dynamics through visual inspection of Ca ii H time-difference sequences constructed with a temporal offset of 3 time-steps (about 35 s). This follows the methodology that has been employed in several PMJ studies before (e.g., Katsukawa et al. 2007; Jurčák & Katsukawa 2008). These identifications were subsequently checked against the regular Ca ii H imaging to confirm their PMJ nature. We restricted our event sample for final analysis to occurrences when IRIS was not affected by increased cosmic ray hits (resulting from the orbital pass through the South Atlantic Anomaly), yielding a grand total of 180 events (along 147 paths, i.e., counting recurring jets separately), of which 52 were on September 5 and 128 on September 6. This selection of PMJs is highlighted by solid lines in the first column of Fig. 1.
3. Results
Morphology and time evolution
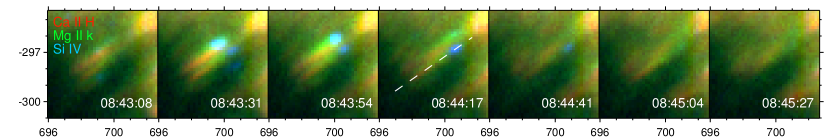
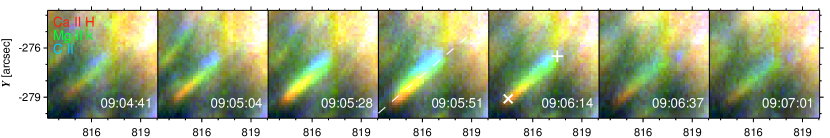
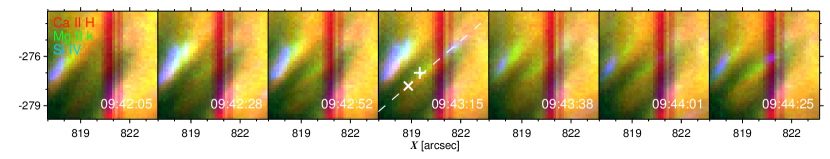
Figure 2 shows the time evolution of three example PMJs that are highlighted by colored tracks in the first column of Fig. 1. Their visibility in different diagnostics is indicated through color coding: Ca ii H signal is red, Mg ii k is green and Si iv or C ii is blue. For events that are visible in multiple channels the colors add; a feature visible in Ca ii H and Mg ii k turns yellow, in Mg ii k and Si iv more cyan, while something visible in all three tends to white. Using nearest-neighbor selection, the time differences between the diagnostics are small, but non-zero nevertheless: about 3.3 s on average and 6.7 s at most between the IRIS slit-jaws and SST, and 6.4 s and 9.8 s between the Mg ii k–Si iv and Mg ii k–C ii pairs, respectively.
Although their lifetimes, sizes and brightness differ, these examples display a generally observed rainbow-colored signature. The signal in Ca ii H (or Ca ii 8542 Å, not shown here) is predominantly found towards the base of the PMJ, Mg ii k is observed throughout but mostly in the middle, while Si iv and C ii are generally only observed towards the PMJ tops. While the Ca ii and Mg ii k signal are elongated and jet-like in shape, the Si iv and C ii signature is more often roundish. Given the viewing angle, this is unlikely an effect of foreshortening, as the jets are viewed from the side. The C ii PMJ signal appears somewhat more elongated than Si iv and is sometimes also offset spatially; for some events this may be an intrinsic effect, as the offset is in the direction perpendicular to the extension of the jet, but for most cases it seems likely a result of the non-negligible 3.5 s time delay between the C ii and Si iv exposures.
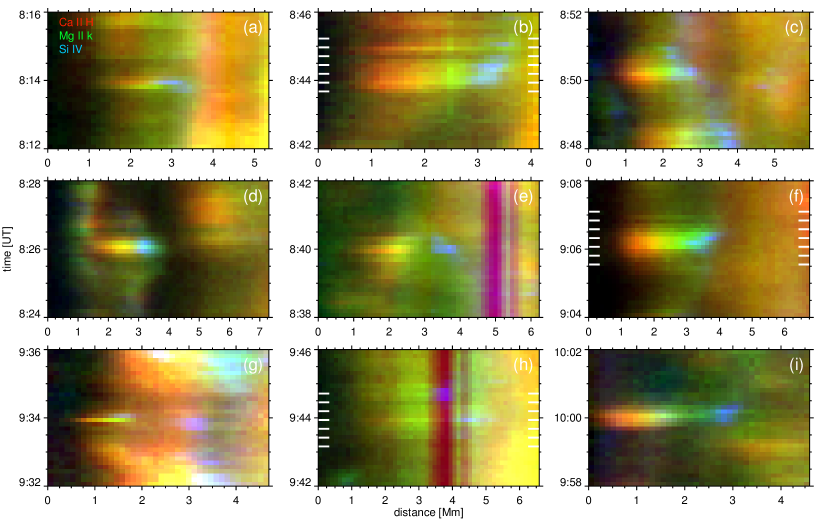
Space-time diagrams were extracted along all paths specified in Fig. 1, in order to further analyze the PMJ time evolution. Figure 3 presents a representative subset of those. The rainbow-colored pattern is clearly visible in all examples, but the details differ from case to case. For instance, in panel (a) the Mg ii k signal appears to be strongly present prior to the visibility in Ca ii H and Si iv, while in all other panels the Mg ii k and Ca ii H signal is roughly co-temporal. Indeed, in most panels the PMJ appears at the same time or within one time step in all three diagnostics. Panels (b) and (c) suggest jet recurrence on the order of 1–2 min along the same path and the latter panel also evidences the radial inward migration of PMJs that was already shown by Katsukawa et al. (2007). The Si iv signal in panels (c) and (e) appears to retract during the PMJ lifetime (with apparent speeds of about 2–4 km s-1), while the opposite apparent motion (at about 10 km s-1) is clearly visible in for instance panel (f). Some PMJs are only visible for 10–20 s (e.g., panels (a), (g) and (h)), while others remain visible for up to a minute (e.g., panels (e) and (f)).
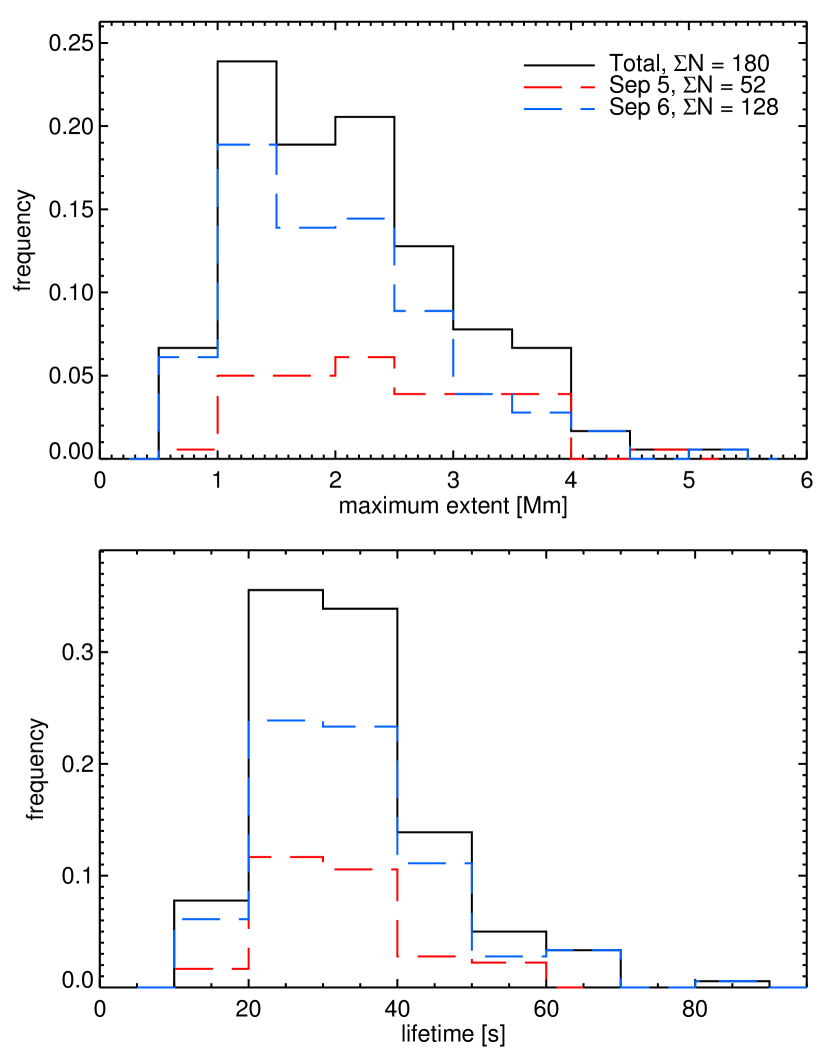
Figure 4 visualizes these properties statistically, showing the frequency distribution of maximum extent and lifetimes. Both represent the combined visibility in Ca ii H, Mg ii k and Si iv, which especially in terms of spatial extent is appreciably larger than for Ca ii H alone (as evident from Fig. 3). We find typical lengths ranging between about 1–5 Mm for PMJs from both data sets, with an overall average of 2.1 Mm, however nearly 57% of the PMJs are shorter than that. The lifetime distribution is equally skewed to lower values, ranging between 10–90 s and with an average of slightly over half a minute. Close to 78% of the PMJs are visible for 35 s or less.
Spectral signature
Although many of the traced paths in Fig. 1 are partially covered by the IRIS raster, the number of events for which spectra are available is limited (note that the traced paths indicate the track along which space-time diagrams have been obtained, not the actual extent of the PMJs). Not only do not all PMJs along those tracks reach the left-most raster position, but of those that do, the Mg ii, Si iv or C ii slit-jaw signal is not always strong, resulting in an only weakly enhanced spectral signal. For September 5, 10 events show a response in either C ii/Si iv or Mg ii h & k, and only one is enhanced in all lines; for September 6, 12 events show response in either lines and 7 are enhanced in all of them. Nonetheless, the IRIS spectra show that the visibility of PMJs in the Mg ii k, Si iv and C ii slit-jaw images is a result of an enhancement of the spectral lines dominating their passbands.
Figure 5 shows sample spectra for five PMJs from September 6 with the strongest IRIS response and which are highlighted with the same color-coding in the second lower panel of Fig. 1. In addition, the violet and orange curves correspond respectively to the PMJs shown in the middle and lower panels of Fig. 2, and the (f) and (h) space-time diagrams in Fig. 3.
For all PMJs, the Ca ii 8542 Å line shows the typical blue-over-red wing asymmetry, peaking out at 10–15 km s-1 blue-ward of the nominal line center. The red wing is generally smooth with intensity close to the field-of-view average, but the blue and violet samplings also show a red wing enhancement at similar Doppler shift, albeit still lower in intensity than the blue wing peak.
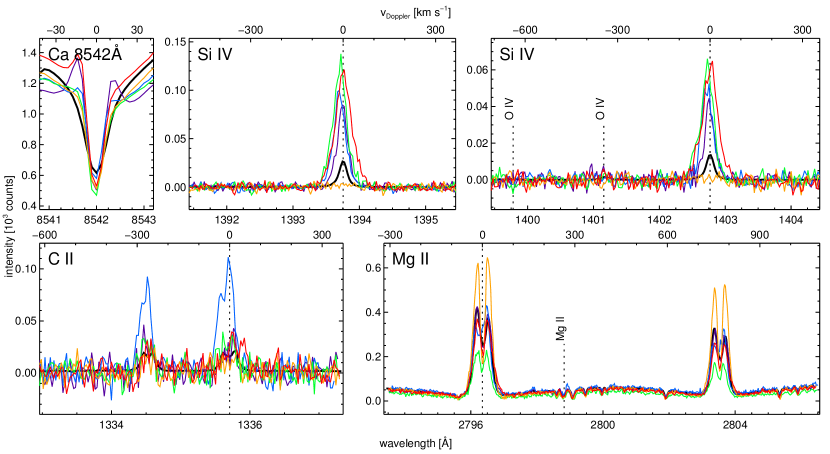
Excluding the orange sampling (which was chosen to show the Mg ii h & k response), the Si iv lines appear the most enhanced of the IRIS diagnostics. The peak ratio of the Si iv 1394 Å to 1403 Å lines varies between 1.8–2.0, close enough to their transition probability of 2 to suggest optically thin formation for all samplings shown. The behavior of both Si iv lines is also similar: both profiles rise by a factor of 3–5 with respect to the quiescent profiles, while broadening appreciably (up to almost a factor 2 for the broadest red profiles). With the exception of the blue and green profiles, which show blue shifts of about 10 km s-1 with respect to the average, the Si iv lines are generally symmetric and show close to zero Doppler shift. There is no sign of O iv 1399.78 Å or 1401.16 Å signal (labeled in the top right panel) for any of the samplings.
By comparison, the C ii lines appear rather docile. Only the blue sampling shows considerable enhancement over the quiescent profile, while all other samplings are dominated by noise. The blue profiles show a hint of red-asymmetry, which is not reflected by the Si iv lines, but which is visible in both the Mg ii h & k lines as well as the Mg ii triplet lines at 2798.82 Å (indicated by the labeled vertical dashed line in the lower right panel). Comparison with the images and spectra in Mg ii k, Ca ii 8542 Å and H suggests this is due to absorption by an overlying fibril that has been blue-shifted by the inverse Evershed effect.
As Figs. 2 and 3 already suggest, the Si iv or C ii signal is generally not co-located with the Mg ii k signal. Hence, it is not surprising that the response in Mg ii h & k is generally weak (if at all present) in most samplings shown in Fig. 5. Indeed, the response in the Si iv and Mg ii k lines appears to be anti-correlated at these sampling locations: the stronger the Si iv (increasing for violet, blue, red to green), the weaker the Mg ii h & k. Conversely, the orange sampling, which has been selected specifically to show the PMJ Mg ii h & k response, shows nothing but noise at the rest-wavelengths of both Si iv lines. Compared to the quiescent profile, both Mg ii lines increase in intensity only in the k2V/R and h2V/R peaks; the k3/h3 cores appear in fact darker at this sampling location than the average profile. Although both lines get broadened, the effect is not as strong as for Si iv.
4. Discussion and Conclusions
We have presented a study of the transition region signature of penumbral microjets in coordinated observations of a sunspot by the SST and IRIS on September 5–6, 2014. Our key finding is the progressive visibility of PMJs in chromospheric and transition region diagnostics along their extent: from base to top the jets are mainly visible in Ca ii H, Mg ii k and Si iv/C ii. These results support the suggestion by Katsukawa et al. (2007) that PMJs may have a transition region component.
The time delay between visibility in these diagnostics is close to negligible, differing at most by about 10 s. Given the characteristic formation temperatures of these lines (104.0 K for Mg ii k, 104.3 K for C ii and 104.8 K for Si iv), as well as the spatial offsets along the jet direction (typically at least 500–1000 km), there is likely to be an intrinsic time delay in the diagnostic visibility, however the current cadence does not allow disentangling these conclusively.
The PMJ-related signal in Mg ii k and Si iv/C ii generally follows the extension set by the Ca ii H jet; of all 147 cases considered, only two showed some curvature of their path. Such behavior was already reported by Jurčák & Katsukawa (2008), who found a small angle between the initial and final orientation of a PMJ in consecutive frames. Even though many PMJs appear slender throughout, we find that some jets may broaden up to about 500 km towards the top. The maximum extents (i.e., combining Ca ii H, Mg ii k and Si iv signal) that we find are of the order of the values reported for Ca ii H alone by Katsukawa et al. (2007), while the Ca ii H lengths in our samples appear to be much shorter (about 0.5–1 Mm, comparable to the values found for Ca ii 8542 Å PMJs by Drews (2014)).
Recently, Tian et al. (2014) reported on IRIS observations of bright dots in sunspots, the majority of which were observed in the penumbrae. The dot-like brightenings in their Si iv slit-jaw images appear to have properties similar to the PMJs in our data: they have similar small, round shapes, lifetimes on the order of a minute and those that show proper motion, have comparable speeds of 10–40 km s-1 (our PMJs fall on the lower end of that range). The IRIS response is also comparable in the enhancement of the Si iv 1402.77 Å and C ii 1334.53 Å lines, the weak Mg ii k 2796.35 Å response, and the absence of significant continuum enhancement and O iv 1401.16 Å signature. Tian and co-workers suggested that some of these dots could be related to PMJs, given the weak but present Mg ii k signal, but that many were likely related to energy releases at loop footpoints (in particular those with counterpart signal in the coronal channels of the Solar Dynamics Observatory’s Atmospheric Imaging Assembly (Lemen et al. 2012)). Considering our findings, we speculate that indeed a large number of their moving bright dots may have been PMJ tops.
The Ca ii 8542 Å spectra from the base of the PMJs generally show a blue-over-red asymmetry peaking at some 15 km s-1, in accordance with literature values (Reardon et al. 2013; Drews (2014)). The interpretation of such profile is not straightforward, as was already pointed out by Reardon et al. (2013). The peak may represent an actual Doppler component at that velocity, but could also merely be a result of the overlying canopy, as for instance for Ellerman bombs (Watanabe et al. 2011; Vissers et al. 2013). In at least one example (i.e., the blue profiles), the latter appears to be the case. On the other hand, a few examples of a similar, co-temporal blue-shift velocity in both Si iv lines and the Ca ii 8542 Å line are found, suggesting a persistent Doppler shift throughout the PMJ. Whether these are representative, however, is difficult to say without a larger statistical sample of IRIS spectra. Although the Ca ii 8542 Å PMJ profiles are comparable to those of Ellerman bombs, the enhancements in the Si iv, C ii, and Mg ii h & k lines are no stronger than the weakest IRIS Ellerman bomb profiles reported in Vissers et al. (2015); more often than not they are much weaker than those.
In conclusion, penumbral microjets have a clear corresponding signature in the IRIS upper chromosphere and transition region diagnostics. The progressive visibility in Mg ii k and Si iv/C ii following the initial jet in Ca ii H and Ca ii 8542 Å, combined with the enhanced and broadened Si iv lines, suggest heating of plasma to transition region temperatures as it extends upwards (while also slightly expanding, likely following the expanding canopy fields). A natural next step would be to expand this study statistically, preferably by sampling a larger part of the penumbra with the IRIS raster than was done in these data sets, as well as doing so at a higher cadence to better disentangle their time evolution.
References
- de la Cruz Rodríguez et al. (2015) de la Cruz Rodríguez, J., Löfdahl, M. G., Sütterlin, P., Hillberg, T., & Rouppe van der Voort, L. 2015, A&A, 573, A40 ADS
- De Pontieu et al. (2014) De Pontieu, B., Title, A. M., Lemen, J. R., et al. 2014, Sol. Phys., 289, 2733 ADS
- Drews (2014) Drews, A. 2014, Chromospheric Microjets in the Penumbra of a Sunspot. Master Thesis, University of Oslo. Available from: http://urn.nb.no/URN:NBN:no-46622
- Jurčák & Katsukawa (2008) Jurčák, J., & Katsukawa, Y. 2008, A&A, 488, L33 ADS
- Jurčák & Katsukawa (2010) —. 2010, A&A, 524, A21 ADS
- Katsukawa & Jurčák (2010) Katsukawa, Y., & Jurčák, J. 2010, A&A, 524, A20 ADS
- Katsukawa et al. (2007) Katsukawa, Y., Berger, T. E., Ichimoto, K., et al. 2007, Science, 318, 1594 ADS
- Kosugi et al. (2007) Kosugi, T., Matsuzaki, K., Sakao, T., et al. 2007, Sol. Phys., 243, 3 ADS
- Langhans et al. (2005) Langhans, K., Scharmer, G. B., Kiselman, D., Löfdahl, M. G., & Berger, T. E. 2005, A&A, 436, 1087 ADS
- Lemen et al. (2012) Lemen, J. R., Title, A. M., Akin, D. J., et al. 2012, Sol. Phys., 275, 17 ADS
- Peter et al. (2014) Peter, H., Tian, H., Curdt, W., et al. 2014, Science, 346, 1255726
- Reardon et al. (2013) Reardon, K., Tritschler, A., & Katsukawa, Y. 2013, ApJ, 779, 143 ADS
- Scharmer et al. (2003) Scharmer, G. B., Bjelksjo, K., Korhonen, T. K., Lindberg, B., & Petterson, B. 2003, in Society of Photo-Optical Instrumentation Engineers (SPIE) Conference Series, Vol. 4853, Innovative Telescopes and Instrumentation for Solar Astrophysics, ed. S. L. Keil & S. V. Avakyan, 341–350 ADS
- Scharmer et al. (2008) Scharmer, G. B., Narayan, G., Hillberg, T., et al. 2008, ApJ, 689, L69 ADS
- Shine et al. (1994) Shine, R. A., Title, A. M., Tarbell, T. D., et al. 1994, ApJ, 430, 413 ADS
- Tian et al. (2014) Tian, H., Kleint, L., Peter, H., et al. 2014, ApJ, 790, L29 ADS
- Tsuneta et al. (2008) Tsuneta, S., Ichimoto, K., Katsukawa, Y., et al. 2008, Sol. Phys., 249, 167 ADS
- van Noort et al. (2005) van Noort, M., Rouppe van der Voort, L., & Löfdahl, M. G. 2005, Sol. Phys., 228, 191 ADS
- Vissers & Rouppe van der Voort (2012) Vissers, G., & Rouppe van der Voort, L. 2012, ApJ, 750, 22 ADS
- Vissers et al. (2013) Vissers, G. J. M., Rouppe van der Voort, L. H. M., & Rutten, R. J. 2013, ApJ, 774, 32 ADS
- Vissers et al. (2015) Vissers, G. J. M., Rouppe van der Voort, L. H. M., Rutten, R. J., Carlsson, M., & De Pontieu, B. 2015, ArXiv e-prints, 1507.00435 ADS
- Watanabe et al. (2011) Watanabe, H., Vissers, G., Kitai, R., Rouppe van der Voort, L., & Rutten, R. J. 2011, ApJ, 736, 71 ADS