Enhanced Microfluidic Mixing via a Tricritical Spiral Vortex Instability
Abstract
Experimental measurements and numerical simulations are made on fluid flow through cross-slot devices with a range of aspect (depth:width) ratios, . For low Reynolds numbers Re, the flow is symmetric and a sharp boundary exists between fluid streams entering the cross-slot from opposite directions. Above an -dependent critical value , the flow undergoes a symmetry-breaking bifurcation (though remains steady and laminar) and a spiral vortex structure develops about the central axis of the outflow channel. An order parameter characterizing the instability grows according to a sixth-order Landau potential, and shows a progression from second order to first order transitions as increases. A tricritical point occurs for . The spiral vortex acts as a mixing region in the flow field and this phenomenon can be used to drive enhanced mixing in microfluidic devices.
pacs:
05.70.Fh, 47.20.Ky, 47.61.Ne, 64.60.KwThe ability of fluids to mix is greatly enhanced by turbulence, which occurs at large values of the Reynolds number , where and are characteristic velocity and length scales respectively and is the kinematic viscosity of the fluid. Small length scales tend to suppress Re, making it difficult to develop turbulent mixing in microfluidic devices. Achieving efficient mixing via diffusion dominated processes presents a major technological challenge to the expanding field of lab-on-a-chip development.
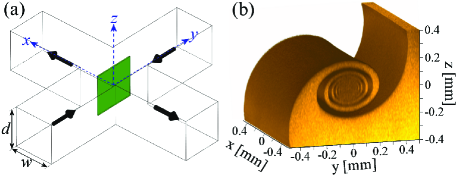
The cross-slot device is emerging as a promising platform for enhancing mixing of fluids in micro-scale geometries Ait Mouheb et al. (2011, 2012). The planar elongational flow field generated by the cross-slot geometry (Fig. 1(a)) has found applications in many research areas including for studies of macromolecular dynamics Odell and Keller (1986); Perkins et al. (1997); Schroeder et al. (2003), extensional rheometry and elastic instabilities of viscoelastic fluids Arratia et al. (2006); Poole et al. (2007); Haward and McKinley (2013); Haward et al. (2012), hydrodynamic trapping Tanyeri and Schroeder (2013), and imposing controlled deformations to complex biological structures Kantsler et al. (2008); Dylla-Spears et al. (2010); Kantsler and Goldstein (2012); Gossett et al. (2012). It has been known since the early 1990’s that such intersecting flows are prone to instability beyond a modest critical Reynolds number . In very deep cross-slot flow channels the observed instability takes the form of a stack of three-dimensional vortical structures that appear in the central cross-over region Kalashnikov and Tsiklauri (1991, 1993), while in the related 4-roll mill apparatus a flow field incorporating a single helical region has been observed Lagnado and Leal (1990). In this work, with cross-slots of modest aspect ratios typical of microfluidic devices (depth to width ratios between 0.4 and 3.87), we have found that the instability occurs above an aspect ratio-dependent value of and results in a simple straight vortex that extends downstream along the outlet channels, see Fig. 1(b). This flow instability has been shown to promote mechanical scission of polymer chains Vanapalli et al. (2006), and has more recently been demonstrated to enhance mixing between the two incoming fluid streams in micro-sized devices Ait Mouheb et al. (2011, 2012). Numerical simulations have shown that the mixing quality is higher and is lower in the cross-slots than in the more well-known T-shaped mixing device with equivalent channel dimensions Ait Mouheb et al. (2012).
In this Letter, we report the results of detailed experimental and numerical studies of the spiral vortex flow instability in cross-slots with a range of aspect ratios and over a wide range of Re. In contrast to previous studies Kalashnikov and Tsiklauri (1991, 1993); Ait Mouheb et al. (2012), we identify appropriate order parameters that characterize the instability as a function of Re in each case. In particular, we present a systematic analysis in terms of bifurcation theory analogous to the Landau theory of phase transitions. The observed phenomena are well described by a Landau-type sixth-order polynomial potential Landau (1937); Aitta et al. (1985); Aitta (1986), with parameters that show the transition develops from second order to first order as increases, passing through a tricritical point for . These data can be fully described by scaling theory, and the universal scaling function and behavior are measured near the tricritical point. Improved understanding and characterization of stability conditions for flows through intersecting geometries is vital for the optimization of many laboratory microfluidic experiments and also practical lab-on-a-chip designs, including for the specific goal of enhancing the mixing of fluids in channels with small dimensions operating at low Re.
The cross-slot device (Fig. 1(a)) consists of two bisecting rectangular channels of width and depth , with the aspect ratio defined by . In the experiments four devices are utilized, all with but with varied in order to provide . An inlet length of at least 12.5 ensures a fully-developed flow before the fluid reaches the central region of each device. Newtonian fluid (water) is pumped into two opposing channels (along the -direction) and exits through the two opposing outlet channels (along the direction). One of the incoming fluid streams is fluorescently-dyed with rhodamine B (concentration = 10 M, Sigma) and a laser-scanning confocal microscope (Zeiss LSM 780) is employed to examine the interface between fluid streams where they meet in the central cross-over region. Imaging in closely-spaced planes through the depth of the flow cell () allows accurate reconstruction of an image in the plane, see (green) shaded area in Fig. 1(a). Experiments are performed at 24∘C over a range of , with the fluid density and the dynamic viscosity . The average flow velocity within each channel of the cross-slot is controlled using a precision dual syringe pump (Harvard PHD Ultra). While for low Re the interface between fluid streams is sharp and vertical over the plane, beyond a fairly moderate critical value the flow bifurcates and breaks symmetry (but remains steady and laminar) and intricate spiral vortex structures develop, see Fig. 1(b) and Movie M1 ESI .
The numerical method solves the equations of motion and mass conservation , for laminar flow of a Newtonian incompressible fluid by using a fully-implicit, second-order finite volume method Poole et al. (2007, 2014); Cruz et al. (2014). For the inertial flows considered here, relevant features of the method are the treatment of the partial time derivative using the three time-level pressure correction algorithm Oliveira (2001) and the treatment of the convective term , which is discretized using the 3rd order high-resolution CUBISTA scheme Alves et al. (2003). In this way we maintain 2nd-order accuracy in space and time.
Non-uniform orthogonal meshes are deployed on the 3D cross-slot geometry of Fig. 1(a), with the central cube (for ) having uniform control volumes (CV’s) on the base mesh, and or CV’s on more refined meshes. The CV size expands slowly towards the two inlets, along the channel aligned with the -axis, and towards the two outlets, along the -axis (see Fig. S1 ESI ). Theoretical White (1991) 2D fully-developed velocity () profiles are applied at the inlets, while at the outlets zero axial gradients are assumed for velocity components (), pressure is linearly extrapolated and the total flow rate is forced to satisfy overall mass conservation (, where for each inlet section). Note that we do not force the flow rate entering via each inlet to divide equally between each outlet, but only that the flow rate through each outlet is equal, as in the experiments. The numerical simulations explore devices with aspect ratios set equal to the four experimental devices as well as additional values of aspect ratio near to the tricritical value.
Great care is exercised to guarantee that the numerical results are well converged and do not significantly with the computational mesh. In Fig. S1 ESI , we illustrate the various meshes employed and compare the results obtained for a cross-slot with , showing good accuracy.
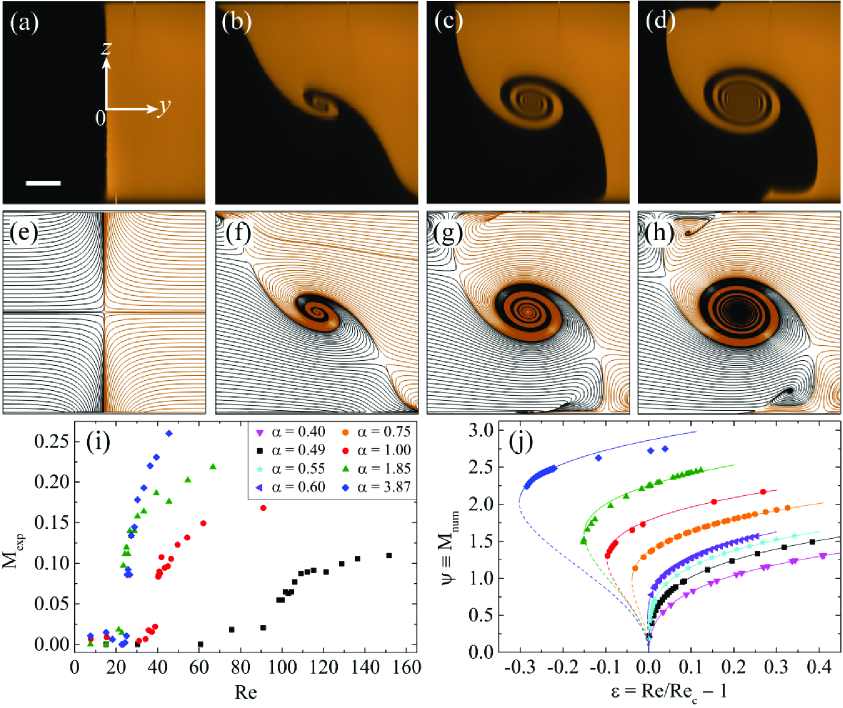
In Fig. 2(a–d) we present reconstructed confocal images of the plane (spanning , ) for the cross-slot device with = 1, which show the evolution of the vortical structure as Re increases. Qualitatively similar behavior is observed in all four geometries (see Fig. S2 and Movies M2–M5 ESI ): at low Re the interface between fluid streams is sharp and vertical as expected, however as Re increases above a critical value the spiral vortex forms abruptly about the -axis. With further increases in Re, the spatial extent of the spiral expands, as does the number of turns of the arms. The value of the critical Reynolds number for the appearance of the spiral in the experiments depends on the aspect ratio, but is broadly consistent with values reported previously in related experiments Kalashnikov and Tsiklauri (1991, 1993); Ait Mouheb et al. (2012); Lagnado and Leal (1990) ( 100, 40, 24 and 26 for 0.49, 1.00, 1.85 and 3.87, respectively). In each of the four devices the central vortex forms with a favored orientation about the -axis (anticlockwise for and and clockwise for and , see Fig. S2). The orientation is presumably biased by some minor geometrical imperfections in the devices and causes the bifurcation to follow a favored branch. In only a few instances in the cross-slots with and at higher Re did we observe the vortex to form in the unfavored sense (see Fig. S3 ESI for examples). The vortex structures observed in the plane can be well-fitted by elliptical logarithmic spirals (see Fig. S4 ESI ).
Numerical simulations result in remarkably good agreement with the experiment, as shown by the streamline plots in Fig. 2(e–h) that can be directly compared with the experimental results in Fig. 2(a–d). Note that in the numerical simulations at there is hysteresis in the transition and both symmetric and asymmetric steady solutions can be obtained for (Fig. 2(f)), depending on whether Re is quasistatically increased or decreased from below or above the transition, respectively. Both possible solutions are presented in Fig. S5 ESI . Additional numerical plots of velocity vector fields at various Re spanning the transition for the case of are provided in Fig. S6 ESI . Our experimental method is not amenable to a genuinely quasistatic variation of Re since the flow is necessarily interrupted between image acquisition at each Re in order to refill the syringes with fluid. Therefore our experiment can not resolve the hysteresis in the transition.
We treat our experimental data following the approach suggested by Stroock et al. Stroock et al. (2002) in order to assess the degree of mixing between the incoming fluid streams, . This parameter is computed using the standard deviation of the pixel intensity evaluated over images such as those shown in Fig. 2(a–d) and Fig. S2 ESI :
| (1) |
where is the grayscale pixel value (normalized between 0 and 1, corresponding to the minimum and maximum grayscale intensities in the images) and indicates an average over all pixels in the field of view. For completely segregated fluid streams, there is a binary distribution of pixel intensities, the standard deviation and hence ; this is essentially the case illustrated in Fig. 2(a). Complete mixing between the fluid streams would mean a uniform pixel intensity of over the entire field of view, therefore a standard deviation of zero and hence In Fig. 2(i), we plot the mixing parameter, , as a function of the Reynolds number for all four experimental aspect ratios. Fig. 2(i) shows a general reduction in and an increasingly large and rapid increase in as increases. We also note that the transition is imperfect; there is a small but distinct curvature in near the onset, which is consistent with the presence of their being a favored branch for the transition (clockwise or anticlockwise spirals). We treat the favored branch as the positive branch regardless of the spiral orientation.
In the case of the numerical simulations, we find the growth of the instability is best described by the following parameter:
| (2) |
where is the maximum value of the -component of the velocity measured along the -axis at each Re (for a symmetric flow ). A pictorial description of is given in Fig. S6 ESI . Fig. 2(j) shows a plot of as a function of the control parameter for various aspect ratio cross-slot devices. The data in Fig. 2(j) is fitted using a Landau-type model with ”free energy” , given by:
| (3) |
where the order parameter , in the numerical case. Even terms are included in Eq. (3) since for a perfect system should be independent of the sign of (i.e. the handedness of the spiral). The lowest order asymmetric “field” term () can account for imperfections that bias the handedness. In the numerical simulations the vortex can form in the clockwise or anticlockwise orientation with similar probablity, hence (for all aspect ratios). For given values of the parameters , , and , the value of corresponds to the extrema of , , giving:
| (4) |
The ratio of the coefficients for (corresponding to a forward bifurcation or a second-order transition) and decreases monotonically with increasing , turning negative for at which point the bifurcation becomes backwards, or first order and an increasing large hysteresis loop grows as increases. The numerical data obtained for are well-fitted by Eq. (4) with , (cyan) stars in Fig. 2(j), and thus corresponds to a tricritical transition. Fitting of the numerical data with Eq. (4) provides the values of shown in Fig. S7 ESI . For , due to the hysteresis loop we can find two values of the critical Reynolds number: denotes the value found for quasistatic increases in Re from below, while denotes the value found for quasistatic decreases in Re from above the onset. The numerically predicted hysteresis loops for can not be observed experimentally, however we find that our experimental critical Reynolds numbers () agree very well (within approx. ) with the numerical values of (Fig. S7).
In Fig. 3(a) we fit our experimental mixing parameter with Eq. (4), setting the order parameter and fixing to the value determined numerically for each aspect ratio device. We introduce a small coefficient into Eq. (4) that accounts for geometrical imperfections in the experimental devices. In general we find that our experimental order parameter is well described by the same sextic Landau potential that describes the numerical data.
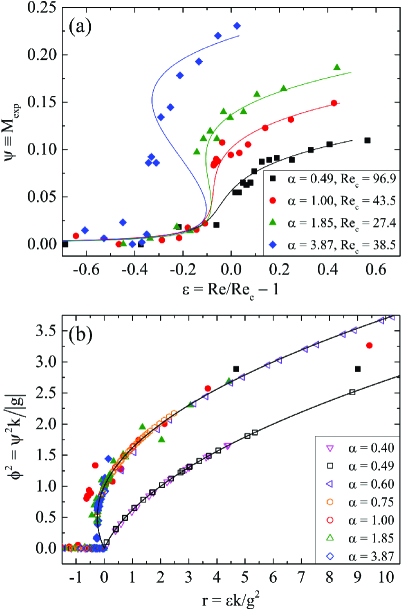
The theory for tricritical points Goldenfeld (1992) predicts a universal scaling form for the canonical order parameter in terms of the control parameter , showing data collapse in the form:
| (5) |
In Fig. 3(b), we have plotted both the experimental and numerical results in scaled form and show the comparison with the data collapse prediction. The agreement is excellent and confirms our identification of the mixing transition as a tricritical one.
In summary, we have demonstrated that the spiral instability observed for Newtonian flow in the cross-slot device driven far from equilibrium above a critical Reynolds number, can be well-described by a Landau model analogous to that used near equilibrium tricritical points. We note a certain similarity of our results with those presented for flow in low-aspect ratio Taylor-Couette devices above a critical angular velocity (e.g. Aitta et al. (1985); Aitta (1986); Benjamin and Mullin (1981)), however the instability in the cross-slot geometry can be harnessed to promote mixing of Newtonian fluids at the quite modest Reynolds numbers accessible in microfluidic devices. Such improved mixing could benefit the efficiency of lab-on-a-chip applications such as chemical synthesis, antibody antigen binding reactions and bioassay. It is likely that bifurcation phenomena reported in related flow geometries (such as in the T-shaped micromixer, for example Ait Mouheb et al. (2012); Poole et al. (2013)) could also be characterized by the tricritical point formalism presented here.
Acknowledgements: SJH and AQS gratefully acknowledge the support of the Micro/Bio/Nanofluidics Unit of the Okinawa Institute of Science and Technology Graduate University. MAA acknowledges financial support from the European Research Council (Grant Agreement No. 307 499). We are indebted to Professors Helmut Brand and Gregory Falkovich for helpful discussions.
References
- Ait Mouheb et al. (2011) N. Ait Mouheb, A. Montillet, C. Solliec, J. Havlika, P. Legentilhomme, J. Comiti, and J. Tihon, Microfluid. Nanofluid. 10, 1185 (2011).
- Ait Mouheb et al. (2012) N. Ait Mouheb, D. Malsch, A. Montillet, C. Solliec, and T. Henkel, Chem. Eng. Sci. 68, 278 (2012).
- Odell and Keller (1986) J. A. Odell and A. Keller, J. Polym. Sci., Polym. Phys. Ed. 24, 1889 (1986).
- Perkins et al. (1997) T. T. Perkins, D. E. Smith, and S. Chu, Science 276, 2016 (1997).
- Schroeder et al. (2003) C. M. Schroeder, H. P. Babcock, E. Shaqfeh, and S. Chu, Science 301, 1515 (2003).
- Arratia et al. (2006) P. E. Arratia, C. C. Thomas, J. Diorio, and J. P. Gollub, Phys. Rev. Lett. 96, 144502 (2006).
- Poole et al. (2007) R. J. Poole, M. A. Alves, and P. J. Oliveira, Phys. Rev. Lett. 99, 164503 (2007).
- Haward and McKinley (2013) S. J. Haward and G. H. McKinley, Phys. Fluids 25, 083104 (2013).
- Haward et al. (2012) S. J. Haward, M. S. N. Oliveira, M. A. Alves, and G. H. McKinley, Phys. Rev. Lett. 109, 128301 (2012).
- Tanyeri and Schroeder (2013) M. Tanyeri and C. M. Schroeder, Nano Lett. 13, 2357 (2013).
- Kantsler et al. (2008) V. Kantsler, E. Segre, and V. Steinberg, Phys. Rev. Lett. 101, 048101 (2008).
- Dylla-Spears et al. (2010) R. Dylla-Spears, J. E. Townsend, L. Jen-Jacobson, L. L. Sohn, and S. J. Muller, Lab Chip 10, 1543 (2010).
- Kantsler and Goldstein (2012) V. Kantsler and R. E. Goldstein, Phys. Rev. Lett. 108, 038103 (2012).
- Gossett et al. (2012) D. R. Gossett, H. T. K. Tse, S. A. Lee, Y. Ying, A. G. Lindgren, O. O. Yang, J. Rao, A. T. Clark, and D. Di Carlo, Proc. Natl. Acad. Sci. U.S.A. 109, 7630 (2012).
- Kalashnikov and Tsiklauri (1991) V. N. Kalashnikov and M. G. Tsiklauri, Fluid Dynamics 26, 161 (1991).
- Kalashnikov and Tsiklauri (1993) V. N. Kalashnikov and M. G. Tsiklauri, J. Non-Newtonian Fluid Mech. 48, 215 (1993).
- Lagnado and Leal (1990) R. R. Lagnado and L. G. Leal, Exp. Fluids 9, 25 (1990).
- Vanapalli et al. (2006) S. A. Vanapalli, S. L. Ceccio, and M. J. Solomon, P. Natl. Acad. Sci. USA 103, 16660 (2006).
- (19) See Supplemental Material at http://link.aps.org/ supplemental/?? for the following information. Fig. S1 illustrates the numerical meshes and test of the numerical accuracy. Fig. S2 presents confocal microscopy images from all four experimental flow cells over a range of Re. Fig. S3 provides experimental evidence of clockwise and anticlockwise vortex formation in some of the devices. Fig. S4 shows some vortices fitted with elliptical logarithmic spirals. Fig. S5 presents numerical streamline images including in the hysteretic region. Fig. S6 illustrates the definition of the numerical order parameter. Fig. S7 shows a plot of the critcal Re versus cross-slot aspect ratio. Movie M1.mov shows a three-dimensional rendering of a spiral vortex. Movie M2.mov shows the development of the vortex with increasing Re in the cross-slot with aspect ratio = 0.49. Movie M3.mov shows the development of the vortex with increasing Re in the cross-slot with aspect ratio = 1. Movie M4.mov shows the development of the vortex with increasing Re in the cross-slot with aspect ratio = 1.85. Movie M5.mov shows the development of the vortex with increasing Re in the cross-slot with aspect ratio = 3.87.
- Landau (1937) L. Landau, Phys. Z. Sowjetunion 11, 26 (1937).
- Aitta et al. (1985) A. Aitta, G. Ahlers, and D. S. Cannell, Phys. Rev. Lett. 54, 673 (1985).
- Aitta (1986) A. Aitta, Phys. Rev. A 34, 2086 (1986).
- Poole et al. (2014) R. J. Poole, G. N. Rocha, and P. J. Oliveira, Comput. Fluids 93, 91 (2014).
- Cruz et al. (2014) F. A. Cruz, R. J. Poole, A. A. Afonso, F. T. Pinho, P. J. Oliveira, and M. A. Alves, J. Non-Newtonian Fluid Mech. 214, 57 (2014).
- Oliveira (2001) P. J. Oliveira, J. Non-Newtonian Fluid Mech. 101, 113 (2001).
- Alves et al. (2003) M. A. Alves, P. J. Oliveira, and F. T. Pinho, Int. J. Numer. Meth. Fluids 41, 47 (2003).
- White (1991) F. M. White, Viscous Fluid Flow (McGraw Hill, New York, 1991).
- Stroock et al. (2002) A. D. Stroock, S. K. W. Dertinger, A. Ajdari, I. Mezic, H. A. Stone, and G. M. Whitesides, Science 295, 647 (2002).
- Goldenfeld (1992) N. Goldenfeld, Lectures on phase transitions and the renormalization group (Addison-Wesley, Advanced Book Program, Reading, 1992).
- Benjamin and Mullin (1981) T. B. Benjamin and T. Mullin, Proc. Roy. Soc. London A 377, 221 (1981).
- Poole et al. (2013) R. J. Poole, M. Alfateh, and A. P. Gauntlett, Chem. Eng. Sci. 104, 839 (2013).