Nonequilibrium Structure of Colloidal Dumbbells under Oscillatory Shear
Abstract
We investigate the nonequilibrium behavior of dense, plastic-crystalline suspensions of mildly anisotropic colloidal hard dumbbells under the action of an oscillatory shear field by employing Brownian dynamics computer simulations. In particular, we extend previous investigations, where we uncovered novel nonequilibrium phase transitions, to other aspect ratios and to a larger nonequilibrium parameter space, that is, a wider range of strains and shear frequencies. We compare and discuss selected results in the context of novel scattering and rheological experiments. Both simulations and experiments demonstrate that the previously found transitions from the plastic crystal phase with increasing shear strain also occur at other aspect ratios. We explore the transition behavior in the strain-frequency phase and summarize it in a nonequilibrium phase diagram. Additionally, the experimental rheology results hint at a slowing down of the colloidal dynamics with higher aspect ratio.
I Introduction
The equilibrium and nonequilibrium behavior of colloidal hard-sphere suspensions has been investigated extensively Pusey et al. (1989); Ackerson (1991, 1990a); Ackerson and Clark (1983) as it constitutes the simplest model system to gain a better understanding of the structure and phase behavior of colloidal suspensions in some of their fundamental aspects. Notwithstanding that the particles interact isotropically by excluded volume only, hard sphere colloids show a nontrivial phase diagram already in equilibrium and glassy behavior above a certain volume fraction Pusey and van Megen (1986); Pusey et al. (1989, 2009). Regarding their nonequilibrium behavior, hard sphere suspensions subjected to shear have been of particular interest, since shear is one of the most common external fields Besseling et al. (2012); Ackerson and Pusey (1988). Here, many interesting forms of order-disorder transitions have been observed in experiments and simulations under various shear conditions Besseling et al. (2012); Ackerson and Pusey (1988). These include steady shear (constant rate) Ackerson and Pusey (1988), oscillatory shear (fixed strain amplitude and frequency) Ackerson and Pusey (1988); Besseling et al. (2012), and oscillatory fixed shear rate protocols Ackerson (1990b).
In particular, various nonequilibrium states have been identified in spherical colloids under shear and have been well characterized up to now using a combination of scattering methods Ackerson and Pusey (1988), optical techniques Haw et al. (1998); Besseling et al. (2012), simulations Besseling et al. (2012) and theoretical models Loose and Ackerson (1994). Similar order-disorder transitions of colloids under shear have been reported for clusters of soft spheres Nikoubashman et al. (2012) and highly charged spheres Yan et al. (1994); Biehl and Palberg (2004); Palberg and Biehl (2002). Most recently, Besseling et al. combined confocal microscopy and Brownian dynamics (BD) simulations to explore the nonequilibrium behavior of colloidal hard spheres under oscillatory shear Besseling et al. (2012). Here, for small strains a face-centered cubic (FCC) twin is found to be stable corroborating with the classical results Ackerson and Pusey (1988). At high strains the predominant structure is found to be registered sliding of hexagonal close packed (HCP) layers. Moreover, a dense direction of the HCP layer prefers to be parallel to the velocity at high strain amplitudes, whereas at low strains a dense direction is parallel to the flow direction. This behavior results in a turn in the scattering pattern Haw et al. (1998). The corresponding diffraction patterns Ackerson (1990b); Ackerson and Pusey (1988) show three-fold symmetries. Besseling et al. have calculated an extensive nonequilibrium state diagram for hard spheres under oscillatory strain, which categorizes further high-strain structures.
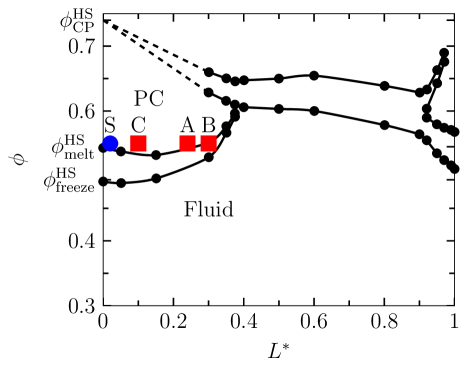
In general, however, colloids are anisotropic and as such there is a rising interest in the behavior of suspensions of non-spherical particles for fundamental understanding van Blaaderen (2006); Hansen-Goos and Mecke (2010); Eisenriegler and Bringer (2005) or applications, such as constituents for novel materials Glotzer and Solomon (2007) or photonics Demirörs et al. (2010); Liu et al. (2014); Hosein et al. (2010). Desirable on a fundamental level are hard particles with slight anisotropy that weakly perturb the isotropic interactions of spherical reference systems. One popular experimental realization is a system of steeply repulsive ’dumbbells’, that is a colloidal dimer made up by two fused equally-sized hard spheres Mock and Zukoski (2007a, b). The equilibrium phase diagram and the stability and nucleation processes of (plastic) crystal phases of hard dumbbells have been mapped out comprehensively by means of Monte Carlo (MC) simulations Vega et al. (1992a); Vega and Monson (1997); Marechal and Dijkstra (2008); Ni and Dijkstra (2011). Plastic crystal phases are characterized by a crystalline center of mass order and a lack of long-range order of the particles’ orientations Wojciechowski et al. (1991); Frenkel et al. (1984); Lynden-Bell and Michel (1994), in which the latter is the distinguishing attribute in comparison to a fully ordered crystal. For the convenience of the reader the relevant parts of the phase diagram are replotted in Fig. 1.
Out of equilibrium, the impact of the weak anisotropy and its accompanying translational-rotational coupling Lynden-Bell and Michel (1994) on the rheology and the structure of dispersions under shear has been of keen interest. This aspect has been investigated by means of mode-coupling theory Zhang and Schweizer (2009, 2012), neutron scattering Mock and Zukoski (2007a) and rheological experiments Kramb et al. (2010); Kramb and Zukoski (2011). A few years ago, we have presented a very neat experimental realization Chu et al. (2012) of monodisperse hard dumbbells (aspect ratios and ), which matches the plastic crystal phase boundaries well in the estimated phase diagram (Fig. 1). Employing this well-defined experimental model system, we have, in fact, very recently shown by a combination of rheology-scattering (rheo-SANS) and Brownian dynamics (BD) simulations that hard plastic-crystalline dumbbells undergo nonequilibrium transitions under oscillatory shear similar than hard spheres but the nature of the transition differs strikingly Chu et al. (2015). In particular, we observed a finite orientational correlation arising on increasing strain amplitudes Chu et al. (2015) and a more vigorous transition with large implications on rheology and the yielding behavior.
In this work, we follow up on our previous work and extend our computational work to other aspect ratios and a wider frequency range. Our focus is thus the region of small to moderate elongations (aspect ratios ) and high volume fractions where the plastic crystal (PC) phase predominates Vega et al. (1992b). Furthermore, kinetics properties of the suspensions are investigated by our simulations. We also present new rheology experiments on a second aspect ratio (). We note that the aspect ratio of represents an anisotropy very close to that of a nitrogen molecule, that also features a plastic crystal phase Mills et al. (1975, 1986), referred to as -phase, so one could consider our system as colloidal nitrogen.
II Methods
II.1 Brownian Dynamics
The BD simulations are carried out using Ermak’s Ermak (1975) method for interacting particles in solution with an additional term to account for the oscillatory shear force. We neglect hydrodynamic interactions among the particles as the systems under consideration are disturbed in a regime where the driving forces are in the order of the viscous forces, i.e., the Péclet numbers are small, see also related work Besseling et al. (2012). The dumbbell particles are represented by a two-segment Yukawa model, in which the particles interact via two spherical beads constraint at the constant distance with a steep Yukawa potential (decay length ) defined by
| (1) |
where and set the energy and length scales, respectively, and denotes the center-to-center distance between two beads. The parameter tunes the softness of the interaction and is chosen to maintain computational performance and resemble hard particle behavior. We employ a forward Euler scheme in order to integrate the equations of motion Ermak (1975); Löwen (1994). The time scale is set to the Brownian time of a single bead of diameter and diffusivity with a solvent viscosity . The parallel and perpendicular center of mass (COM) coordinates are updated according to
| (2) | ||||
| (3) | ||||
| (4) |
The shear flow only affects the COM transport in -direction through the last term in equation (Eq. (4)). The directors are updated following
| (5) |
where is the total torque exerted on particle at time . The single-particle diffusion coefficients parallel , perpendicular to the long axis and for the rotation about the short axis depend on the particle geometry, their respective values are listed below (Table 1). The torque is comprised of the inter-particle and background-flow contributions, via
| (6) |
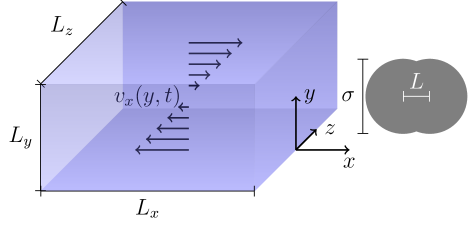
We impose a time-dependent linear shear flow in the -direction, such that the shear gradient is parallel to and the vorticity is in -direction. As the flow velocity vanishes at and depends linearly on , the velocity-vorticity plane is the plane of (spatially) constant flow velocity. Hence, the sheared system retains symmetry in this particular plane, cf. Fig. 2. Mathematically, the shear flow is thus described by the rate-of-strain tensor
| (7) |
which may be written as a sum of symmetric and anti-symmetric tensors, i.e., the shear and vorticity tensors
| (8) | ||||
| (9) |
The symmetric part describes the pure elongational flow, while the anti-symmetric part describes the vorticity of the flow. The vorticity is spatially uniform and quantifies the solvent contribution to the rotation of the particles. The time-dependent strain with the dimensionless amplitude imposed by the flow field on the suspension is thus given by
| (10) |
Hence, the linear solvent velocity profile is
| (11) |
In order to compare the driving force to the intrinsic viscous forces, we define the Péclet numbers
| (12) | |||
| (13) |
where the latter is a definition respecting the time scale set by the rotational Brownian motion. The maximum shear rate sets the time scale of the driving force exerted by the shear flow.
In order to compare the results of our simulations, the time scales set by the diffusion constants and sizes of the particles are important. For dumbbells with the parallel (), perpendicular () and rotational () diffusivities have been obtained by the shell bead model method (SHM) and matched to the experimental data described in our previous work Chu et al. (2012). In Table 1 the reader may find the exact parameters used for the respective systems. Thus, the rotational Brownian time scale is in this case. In length and time units of and the translational Péclet number is defined as , where is the hydrodynamic radius of a sphere in the experimental frame of reference.
| 0.02 (S) | 0.99 | 0.99 | 0.97 |
| 0.10 (C) | 0.97 | 0.95 | 0.85 |
| 0.24 (A) | 0.93 | 0.89 | 0.69 |
| 0.30 (B) | 0.91 | 0.87 | 0.63 |
We simulate dumbbell particles subjected to Lees-Edwards Lees and Edwards (1972) periodic boundary conditions. The systems are initialized in a crystalline state and run for , at the frequencies , and . The averages are calculated over and strain cycles in the steady state respectively. Figure 3 shows the parameters we have investigated in oscillatory shear conditions and the states we have identified. For a summary of the equilibrium state points under consideration the reader is referred to Fig. 1. The respective results are detailed in the Results section III.
II.2 Trajectory analysis
Structure factors
The static structure factor is evaluated in the velocity-vorticity plane at . This reciprocal plane corresponds to a neutron experiment where the incident beam is parallel to the gradient direction of the shear flow. We calculate the structure factor directly from the COM coordinates of the dumbbells as
| (14) |
where the angle brackets denote the trajectory average, which is taken in the steady state.
Scattering intensity
The scattering intensity of the suspension is the convolution of the COM structure and the distribution of scattering centers within each particle. The scattering amplitude describes the scattering of a single particle with orientation and constant internal density at the scattering vector . Averaging the scattering amplitudes over all possible orientations yields the form factor . The total scattering intensity is calculated as
| (15) |
where the scattering amplitude of a homogeneous dumbbell tilted by the angle with respect to the scattering vector is given by Kaya (2004)
| (16) |
Orientation
In order to analyze the orientational behavior of the particles, a measure of the orientation respecting the geometry of the system given is used. We plot the mean orientation with respect to the Cartesian axes, which coincide with the velocity, shear gradient and vorticity axes, as
| (17) |
where denotes the coordinates and the corresponding instantaneous angles. The average denotes sampling all time steps with the imposed strain state .
The orientational correlations with respect to the time are investigated in terms of directional auto-correlation functions (DACFs) in the assumed steady state. Linearizing the equation of motion of the directors at some stationary state allows to define an effective rotational diffusion coefficient Lenstra et al. (2001). The DACFs , with being the order of the Legendre polynomial , may be approximated by
| (18) |
Center of mass order parameters
In order to distinguish crystalline structures, we use the local bond order analysis proposed by Steinhardt et al. (1983). For each particle a vector is defined by the components
| (19) |
where are the spherical harmonics for the normalized separation vectors , and is the number of the -th particle’s neighbors.
| (20) |
| (21) | ||||
where the second sum runs over all fulfilling .
We define the ensemble averaged order parameters as
| (22) | ||||
| (23) |
where the angle brackets denote the time average in the steady state. In this work the COM order is monitored in terms of averaged local order parameters and . These order parameters are sensitive to the configurations of the neighborhoods of solid-like particles. In particular, FCC and hexagonal close packed (HCP) structures are separated by a change of the sign of .
Radial distribution function and Enskog collision rate
The radial distribution function (RDF) of the beads is defined as
| (24) |
In a homogeneous and isotropic system the RDF depends only on the distance .
From a structural point of view, it is interesting to investigate the collision probability (or rate) during the shear and the phase transitions. It gives a rough picture of the average configurational freedom of the dumbbells under shear. The Enskog collision rate for hard spheres with diameter is given by Hansen and McDonald (2006)
| (25) |
where is the contact value of the RDF, and is the collision frequency in the dilute gas which is the ratio of the mean velocity and the free path in a suspension of hard spheres. In the Enskog approximation, which neglects correlated collisions, the self-diffusion coefficient is inverse proportional to the contact value
| (26) |
for a particle of mass . Since our particles have smooth potentials, the RDF does not have its first maximum exactly at . Therefore, we take the height of the first maximum as a measure for the collision rate.
III Results and Discussion
III.1 Steady-state structures and transitions
We start with the discussion of BD simulated scattering intensities for selected state points. In Fig. 4 the scattering intensities including the scattering amplitude calculated as defined in equations Eq. (15) and Eq. (16) are shown in the velocity-vorticity plane. The data corresponds to state point B, cf. Fig. 1, at a frequency of for selected strains.
The intensity plots illustrate the transition from the low strain twinned crystal state (I) to the high strain sliding layer state (III), corroborating with earlier results on a smaller aspect ratio Chu et al. (2015). In all ordered states a hexagonally ordered plane is parallel to the velocity-vorticity plane in the shear flow framework. A common feature of the scattering plots is the fact that the maxima may be seen on rings of constant scattering vector magnitude. At low strain amplitudes (Fig. 4a,b) a shear twinned FCC crystal is stable, which has a densely packed direction perpendicular to the velocity direction, while at high strains (Fig. 4d-f) a dense direction parallel to the velocity is favorable. Here, the fully ordered systems tend to form two-dimensional HCP layers in the velocity-vorticity plane. These planes are the most densely packed crystallographic planes for FCC and HCP crystal structures and their stacking sequence determines the crystallographic type.
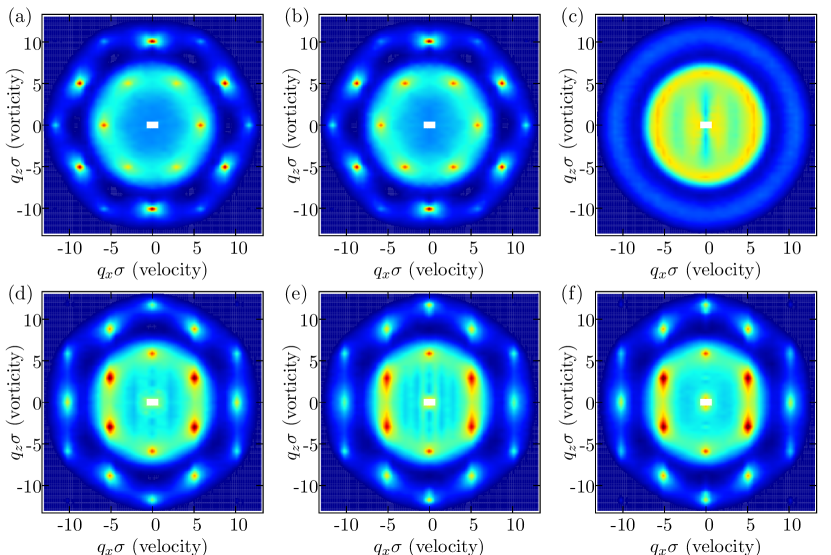
Similar transitions had been observed in spherical systems Ackerson and Pusey (1988); Loose and Ackerson (1994); Besseling et al. (2012). However, slightly anisotropic dumbbells introduce an additional, orientational degree of freedom, and, although weak, it leads to a more abrupt transition compared to the spherical case, as we have previously demonstrated for a smaller aspect ratio Chu et al. (2015). In equilibrium terms it could be said the mild anisotropy qualitatively change the transition from being continuous to discontinuous. This phenomenon is already present in the series of scattering intensities, as we observe a fully molten state for intermediate states, cf. Fig. 4c. In contrast, for the hard spherical reference case, we always detect order in form of crystalline hybrids Chu et al. (2015). At a strain amplitude about the system does not show long-range correlation and is nearly isotropic (Fig. 4c). Close to this transition an anisotropy may be observed at very small scattering vectors in the reciprocal velocity-vorticity plane. Above this isotropic state hexagonal layers perform a zig-zag trajectory, which is indicated by a tilt of the scattering pattern. In the present case we conclude from comparison to the idealized picture and from the reasoning concerning the volume fractions given by Ackerson (1990b) that the COM motion of the dumbbells follow strongly registered trajectories while maintaining two-dimensional hexagonal in-plane order.
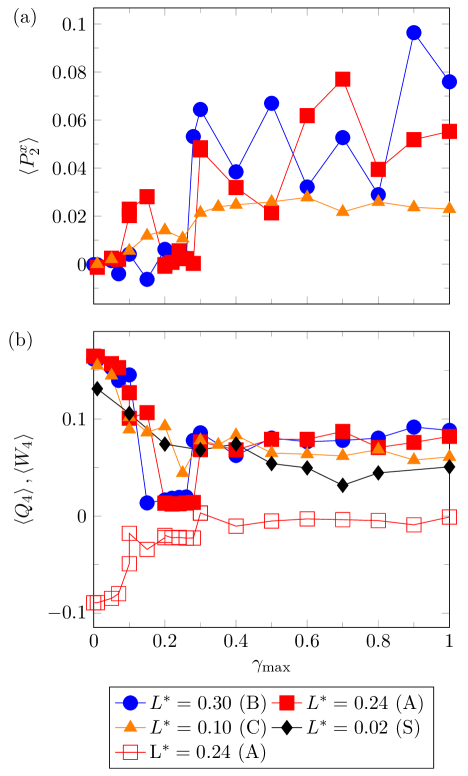
In the following, we investigate the particles’ orientational and translational structure under the action of shear. Figure 5 summarizes the structural information in terms of averaged order parameters for state points A and B, cf. Fig. 1, at a frequency of . Figure 5a shows that the average , quantifying the average dumbbell orientation along the flow direction, is slightly increasing with strain for both aspect ratios in the FCC state until it drops to zero in the disordered state and is non-zero again in the high-strain regime. In Fig. 5b the translations order, described by , is shown for the dumbbells compared to the nearly hard sphere reference case (S). Thus, the non-monotonicity of the orientational measure with respect to the strain amplitude is due to the loss of long-range order. The latter is not preserved in the transition region for sufficiently high aspect ratios, at which neighboring layers of different orientation cannot pass smoothly any more. The behavior at the transition shows clearly that the orientational and translational order changes abruptly in a discontinuous fashion for dumbbells, while, in contrast, the transition in suspension of hard spheres has a continuous character. This behavior is retained for dumbbells with a slender elongation of (system C), which show a ordered state at all investigated strain amplitudes. The average for state point C shows a slight increase at low strain amplitudes as well approaching a plateau value of about in a rather monotonous fashion beyond . This corresponds well to our previous finding that long-time stress correlations due become important for dumbbells above approximately Heptner and Dzubiella (2015). Additionally, the negative in state I indicates FCC dominated structure, in state III this parameter is vanishes on average indicating loss of FCC order.
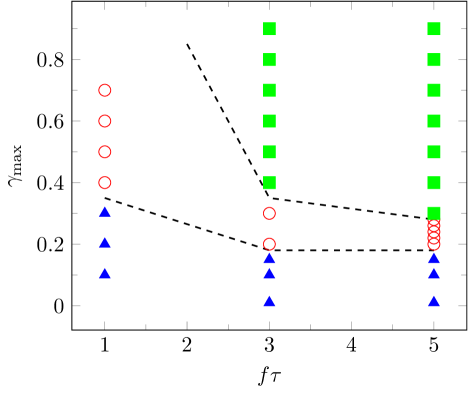
Moreover, the steady state structures and transitions depend on the shear frequency, which is summarized in the nonequilibrium phase diagram in Fig. 3. The diagram shows the phases depicted for various strain amplitudes versus frequency for state point A. In our simulations, state III does not appear at whereas state I is stable up to . For higher frequencies and we observe the ordered state III above an amplitude of approximately , moving slightly to lower strains on increasing frequencies, which is sketched by the dashed lines in Fig. 3.
Let us now characterize the respective nonequilibrium states in more structural detail.
Twinned-FCC regime (I):
At low strain amplitudes a shear-twinned FCC dominated structure is observed in the steady state.
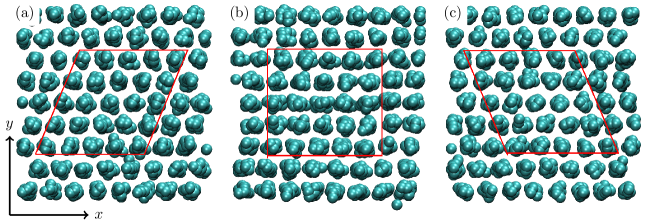
Figure 6 shows a series of snapshots taken at distinctive points in the strain cycle at which the instantaneous strain is minimal (), zero () or maximal respectively.
In this state, particles may follow the oscillatory flow and transfer between the triangular voids offered by neighboring layers.
These void spaces are accessible in the vicinity of the extrema of the strain cycle, in between the particles are forced to pass particles of adjacent layers closely, which is referred to as bridge-stacking.
This behavior finds expression in the transient orientation which is subtly coupled to the strain cycle through particle interaction.
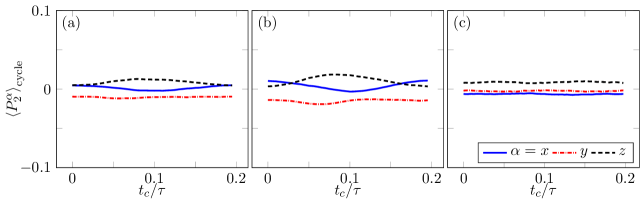
At these low strain amplitudes, , the orientation shows a subtle interplay between the velocity and the vorticity axes while the amplitude in both is very small. This is exemplified in Fig. 7a, where we show the time-resolved orientation in one shear cycle.
In approaching the transition to the high strain state, , a slight separation of the velocity axis is observed, cf. Fig. 7c, while the amplitudes of the and are still in the order of the average.
The shear twinned FCC has a signature in the structure factor, see Fig. 4a,b: the inner peaks are forbidden for equilibrium FCC crystals, in the present case we clearly observe non-vanishing peaks on the first ring and we see that their magnitude grows on increasing strain.
Additionally, let it be noted, that the peaks on the velocity axis () are the first to rise at very low strain amplitudes.
Although the shear twin is not fully developed at strains less than , the scattering intensity reveals that the equilibrium crystal is disturbed sufficiently from .
Let it be noted that the present very dense systems are crystalline in equilibrium and it has been shown that the crystalline state becomes stable for lower amplitudes on increasing density Ackerson (1990b).
Intermediate disordered state (II):
While for suspensions of hard spheres a disordered state in between the low-strain twinned-FCC (I) and high-strain sliding layer (III) regimes is not observed, in fact, we find stable hybrid structures on reduction of the anisotropy, for sufficiently elongated dumbbells the low-strain structure always melts fully at intermediate strain amplitudes.
We find neither long-ranged translational order nor any orientational correlations whatsoever, which is confirmed considering the scattering intensities in Fig. 4c.
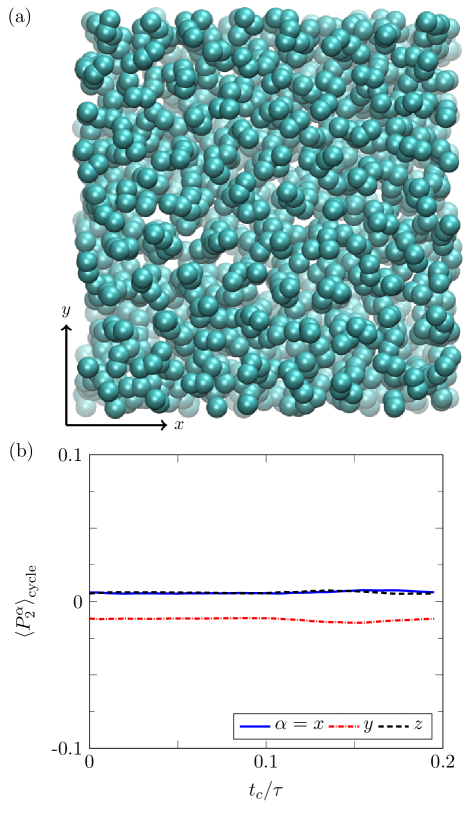
A representative snapshot and cycle-averaged orientations are shown in Fig. 8, clearly demonstrating disorder.
Evidently, this is a distinctive behavior introduced by the orientational degree of freedom of the particles with a sufficient elongation.
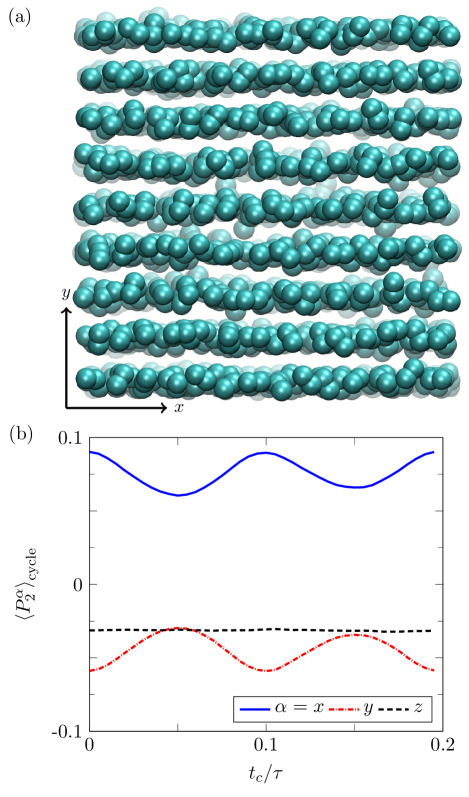
Sliding layer regime (III): While the centers of masses perform a zig-zag motion, a tendency of the particles’ orientation towards the velocity axis is observed, directly after reaching the critical strain to assemble into velocity oriented layers. Figure 9 shows the cycle averaged orientation in the high strain regime, where a dense direction of each layer is aligned with the velocity direction. Here, the velocity and gradient directions of the directors are clearly modulated by the shear cycle, while the vorticity direction is essentially flat. In this case, the modulus of the cycle average is maximal at times, when the instantaneous strain vanishes (), and its amplitude is about and the average . On average the directors slightly tend to be parallel to the velocity and perpendicular to the gradient. This coincides with a decoupling of the orientation from the imposed strain , where the amplitudes of the are significantly smaller than their respective averages.
III.2 Kinetic properties
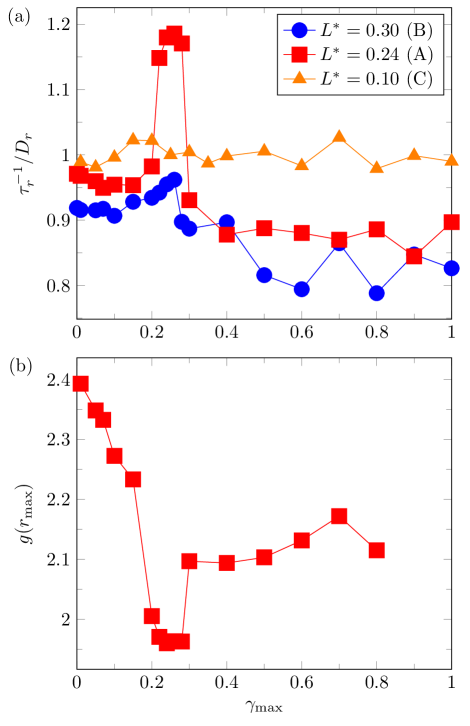
Let us now turn our focus to rotational relaxation properties and particle collision rates. Figure 10a shows the inverse relaxation constant obtained from the exponential decays of the orientational autocorrelation functions according to Eq. (18) normalized by their short-time values at infinite dilution in absence of any external field. The effective rotational decay is enhanced in the disordered state while it is similar to the equilibrium case in the low strain regime and a significant slowing down is observed in the high strain state. At small strain amplitudes the values are slightly smaller than unity as we expect from the analysis of the equilibrium behavior with respect to volume fraction and elongation Heptner and Dzubiella (2015). In the regularly structured twinned FCC regime (I) the diffusion is basically constant with increasing strain amplitude. In the transition region we observe an elevated orientational diffusion where it is steeply curved with respect to the strain amplitude. On entering the high strain regime it jumps back to a value close to its initial value at rest. With increasing strain amplitude the orientational diffusion then slightly decreases. In the high strain regime we observe a state showing enhanced coupling of the dumbbells’ orientations in space and time. For the higher aspect ratio (system B) we observe similar behavior, while the peak in the disordered state (II) at about is much less pronounced. Also, on increasing the elongation, the normalized inverse time scales are smaller than in the former system (A). This can be explained considering the packing effect from our previous study Heptner and Dzubiella (2015), where we show that packing gets important for long-time relaxation from . At the low aspect ratio of state point C, which does not show a fully disordered state, we observe essentially unhindered rotational relaxation and virtually no influence of the shear amplitude.
The transition behavior of the rotational diffusion corresponds well to the contact value analysis, allowing us to connect structure and kinetics. Figure 10b shows the values of the RDF at contact of system A with . On approaching the melting strain at about the contact value rises slightly. At the transition from the ordered shear twinned system (I) to the disordered state (II) the contact value shows a distinct jump of about . A smaller jump is observed at the transition to the ordered high strain regime where the contact value is less than in in the disordered state and reaches a plateau at about . Following the inverse relationship of diffusion and contact value in the Enskog approximation Eq. (26), thus the diffusivity increases drastically in the transition region (II).
III.3 Comparison to experiments
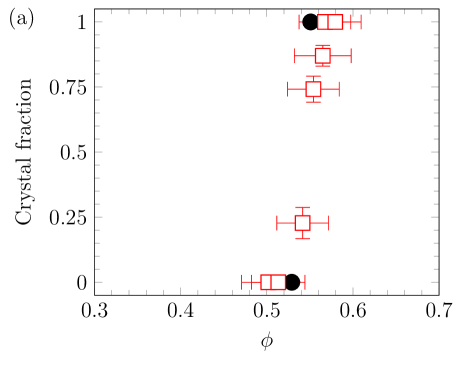
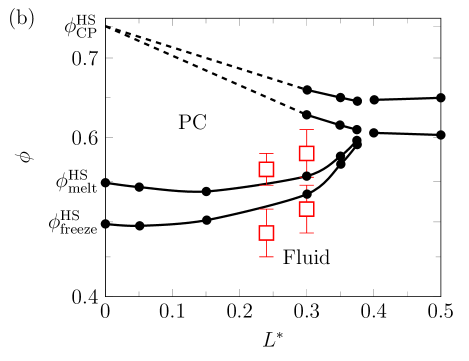
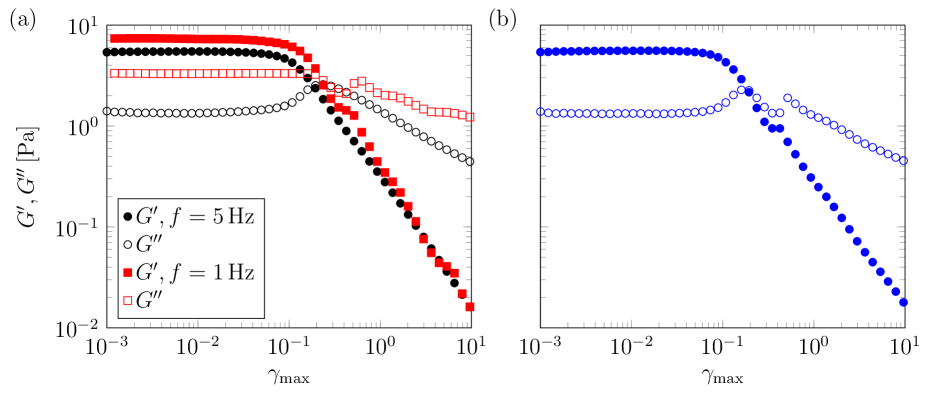
In the following we introduce novel experiments on the rheology for the ’colloidal nitrogen’ case at (B). The details on the experimental and synthesis procedures may be obtained from our previous papers Chu et al. (2012, 2015). Comparison to the prediction of the phase diagram in Fig. 11b shows that the coexistence region (fluid/PC) shrinks on increasing elongation and the phase boundaries of the experimental systems fit very well. A glance at Fig. 11a also confirms that the fraction of crystalline sample in biphasic region is linear in concentration, and, thus, the equilibrium properties of the experimental correspondent of system B are well-defined. The yielding behavior of the hard dumbbells with in the plastic crystalline phase is displayed in Fig. 12a. The experimental data indicate kinetic differences as the rheology of the system A is retained by either the frequency or the number of shear cycles per point: While the yielding behavior of hard dumbbells with in the plastic crystalline phase displayed in Fig. 12a exhibits one event under oscillatory shear at there are two yielding events at . Compared with the former frequency, the number of applied shear cycles is increased by five times within the same measurement time for the experiment at . It is necessary to mention that the double yielding event is observed in the oscillatory shear field with as well when the measurement time is prolonged by five times as shown in Fig. 12b. Based on these three sets of experiments, it is concluded that the hard dumbbells with in the plastic crystalline phase can show the same double yielding behavior as the hard dumbbells with , but the former needs more or faster oscillations to achieve the steady state. The system of hard dumbbells with (B) is closer to the glassy state predicted by Zhang and Schweizer than that with (A) at the same volume fraction of . Due to the expected slowdown of the dynamics in the vicinity of the glass transition in the former case, stronger and longer oscillations are required to induce the same structural change as that with .
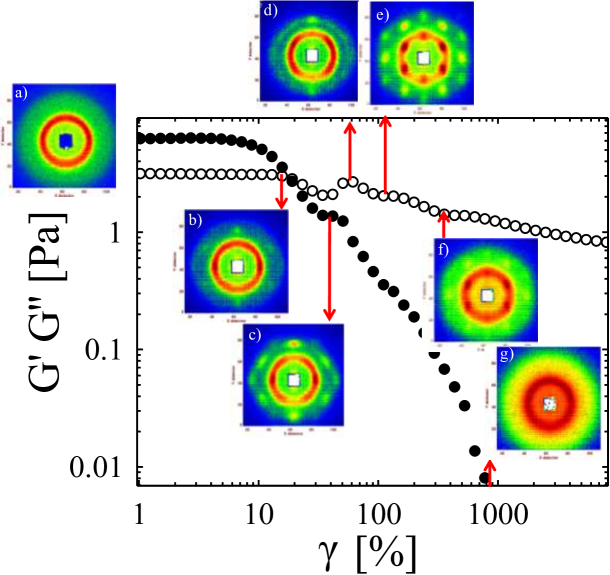
As detailed above, in the BD simulations at constant frequency () (Fig. 5) we observe the transition at nearly the same strain amplitude for systems A and B, while for both cases this transition clearly occurs at lower amplitudes. Moreover, rheo-SANS experiments have been carried out to investigate the underlying shear-induced structural evolution that corresponds to the double yielding behavior. For a direct compilation of scattering data and rheology see Fig. A1 in the appendix. The rheo-SANS experiments clearly demonstrate that the longer dumbbells (B) undergo the same structural evolution to those with (A), corresponding to the simulation results. With the increasing applied shear strains, fully crystallized longer dumbbells undergo the phase transition from twinned FCC (I) to the partially orientated sliding layer state (III), while being disordered in between (II). The main difference in the experimental realization is that the longer dumbbells need larger Péclet numbers to induce the same nonequilibrium states as compared with hard dumbbells with , which we summarize in Table 2. It should be noted that the simulated frequencies and, thus, the Péclet numbers are approximately five times as high as the experimental parameters. In our simulations, the transition from II to III, occurs nearly at the same values and for systems A and B, respectively.
![[Uncaptioned image]](/html/1509.00697/assets/x14.png)
IV Conclusions
Following up on our previous study Chu et al. (2015), we have here provided more evidence that the mild anisotropy of dumbbell-shaped particles leads to qualitative changes in the nature of the nonequilibrium phase transitions of plastic crystals of spherical colloids under oscillatory shear, in particular that the continuous transition observed in spherical systems transforms into a discontinuous one. The latter phenomenon must be attributed to rotational-translational couplings Lynden-Bell and Michel (1994), absent in nearly spherical systems that apparently lead to dramatic changes in the structural and stress relaxation behavior. In fact, we recently showed by equilibrium BD simulations that plastic dumbbells crystals exhibit a dramatic increase of the linear shear response for high packing fractions above a critical aspect ratio of about Heptner and Dzubiella (2015). With respect to the sequence of shear-induced states, the type and the dynamics of the equilibrium to twinned crystal transition remains an interesting issue, which may stimulate a future study. The observed strong transitions have substantial implications for rheology and the yielding behavior of anisotropic colloidal crystals, as detailed by Chu et al. Chu et al. (2015). The new experimental results also show a frequency and time dependency of the rheology, which we attribute to a dynamical slowing down. The present results also demonstrate that the thermosensitive dumbbell particles introduced before Chu et al. (2012) serve as an excellent and versatile model system for mildly anisotropic colloids to study their equilibrium and nonequilibrium structural and phase behavior.
Appendix A Compilation of Rheology and Scattering
References
- Pusey et al. (1989) P. N. Pusey, W. van Megen, P. Bartlett, B. J. Ackerson, J. G. Rarity, and S. M. Underwood, Phys. Rev. Lett. 63, 2753 (1989).
- Ackerson (1991) B. Ackerson, Physica A 174, 15 (1991).
- Ackerson (1990a) B. Ackerson, J. Phys.: Condens. Matter 2, SA389 (1990a).
- Ackerson and Clark (1983) B. Ackerson and N. Clark, Physica A 118, 221 (1983).
- Pusey and van Megen (1986) P. N. Pusey and W. van Megen, Nature 320, 340 (1986).
- Pusey et al. (2009) P. N. Pusey, E. Zaccarelli, C. Valeriani, E. Sanz, W. C. K. Poon, and M. E. Cates, Phil. Trans. R. Soc. A 367, 4993 (2009).
- Besseling et al. (2012) T. H. Besseling, M. Hermes, A. Fortini, M. Dijkstra, A. Imhof, and A. van Blaaderen, Soft Matter 8, 6931 (2012).
- Ackerson and Pusey (1988) B. J. Ackerson and P. N. Pusey, Phys. Rev. Lett. 61, 1033 (1988).
- Ackerson (1990b) B. J. Ackerson, J. Rheol. 34, 553 (1990b).
- Haw et al. (1998) M. D. Haw, W. C. K. Poon, and P. N. Pusey, Phys. Rev. E 57, 6859 (1998).
- Loose and Ackerson (1994) W. Loose and B. J. Ackerson, J. Chem. Phys. 101, 7211 (1994).
- Nikoubashman et al. (2012) A. Nikoubashman, G. Kahl, and C. N. Likos, Soft Matter 8, 4121 (2012).
- Yan et al. (1994) Y. Yan, J. Dhont, C. Smits, and H. Lekkerkerker, Physica A 202, 68 (1994).
- Biehl and Palberg (2004) R. Biehl and T. Palberg, Europhys. Lett. 66, 291 (2004).
- Palberg and Biehl (2002) T. Palberg and R. Biehl, Faraday Discuss. 123, 133 (2002).
- van Blaaderen (2006) A. van Blaaderen, Nature 439, 545 (2006).
- Hansen-Goos and Mecke (2010) H. Hansen-Goos and K. Mecke, J. Phys.: Condens. Matter 22, 364107 (2010).
- Eisenriegler and Bringer (2005) E. Eisenriegler and A. Bringer, J. Phys.: Condens. Matter 17, S1711 (2005).
- Glotzer and Solomon (2007) S. C. Glotzer and M. J. Solomon, Nat. Mater. 6, 557 (2007).
- Demirörs et al. (2010) A. F. Demirörs, P. M. Johnson, C. M. van Kats, A. van Blaaderen, and A. Imhof, Langmuir 26, 14466 (2010).
- Liu et al. (2014) B. Liu, T. H. Besseling, M. Hermes, A. F. Demirörs, A. Imhof, and A. van Blaaderen, Nature Commun. 5, 3092 (2014).
- Hosein et al. (2010) I. D. Hosein, S. H. Lee, and C. M. Liddell, Adv. Funct. Mater. 20, 3085 (2010).
- Mock and Zukoski (2007a) E. B. Mock and C. F. Zukoski, J. Rheol. 51, 541 (2007a).
- Mock and Zukoski (2007b) E. B. Mock and C. F. Zukoski, Langmuir 23, 8760 (2007b).
- Vega et al. (1992a) C. Vega, E. P. A. Paras, and P. A. Monson, J. Chem. Phys. 96, 9060 (1992a).
- Vega and Monson (1997) C. Vega and P. A. Monson, J. Chem. Phys. 107, 2696 (1997).
- Marechal and Dijkstra (2008) M. Marechal and M. Dijkstra, Phys. Rev. E 77, 061405 (2008).
- Ni and Dijkstra (2011) R. Ni and M. Dijkstra, J. Chem. Phys. 134, 034501 (2011).
- Wojciechowski et al. (1991) K. W. Wojciechowski, D. Frenkel, and A. C. Brańka, Phys. Rev. Lett. 66, 3168 (1991).
- Frenkel et al. (1984) D. Frenkel, B. M. Mulder, and J. P. McTague, Phys. Rev. Lett. 52, 287 (1984).
- Lynden-Bell and Michel (1994) R. M. Lynden-Bell and K. H. Michel, Rev. Mod. Phys. 66, 721 (1994).
- Zhang and Schweizer (2009) R. Zhang and K. S. Schweizer, Phys. Rev. E 80, 011502 (2009).
- Zhang and Schweizer (2012) R. Zhang and K. S. Schweizer, J. Chem. Phys. 136, 154902 (2012).
- Kramb et al. (2010) R. C. Kramb, R. Zhang, K. S. Schweizer, and C. F. Zukoski, Phys. Rev. Lett. 105, 055702 (2010).
- Kramb and Zukoski (2011) R. C. Kramb and C. F. Zukoski, J. Rheol. 55, 1069 (2011).
- Chu et al. (2012) F. Chu, M. Siebenbürger, F. Polzer, C. Stolze, J. Kaiser, M. Hoffmann, N. Heptner, J. Dzubiella, M. Drechsler, Y. Lu, and M. Ballauff, Macromol. Rapid Commun. 33, 1042 (2012).
- Chu et al. (2015) F. Chu, N. Heptner, Y. Lu, M. Siebenbürger, P. Lindner, J. Dzubiella, and M. Ballauff, Langmuir 31, 5992 (2015).
- Vega et al. (1992b) C. Vega, E. P. A. Paras, and P. A. Monson, J. Chem. Phys. 97, 8543 (1992b).
- Mills et al. (1975) R. L. Mills, D. H. Liebenberg, and J. C. Bronson, J. Chem. Phys. 63, 4026 (1975).
- Mills et al. (1986) R. L. Mills, B. Olinger, and D. T. Cromer, J. Chem. Phys. 84, 2837 (1986).
- Ermak (1975) D. L. Ermak, J. Chem. Phys. 62, 4189 (1975).
- Löwen (1994) H. Löwen, Phys. Rev. E 50, 1232 (1994).
- Lees and Edwards (1972) A. W. Lees and S. F. Edwards, J. Phys. C: Solid State Phys. 5, 1921 (1972).
- Kaya (2004) H. Kaya, J. Appl. Crystallogr. 37, 223 (2004).
- Lenstra et al. (2001) T. A. J. Lenstra, Z. Dogic, and J. K. G. Dhont, J. Chem. Phys. 114, 10151 (2001).
- Steinhardt et al. (1983) P. J. Steinhardt, D. R. Nelson, and M. Ronchetti, Phys. Rev. B 28, 784 (1983).
- Hansen and McDonald (2006) J. Hansen and I. McDonald, Theory of Simple Liquids, 3rd ed. (Academic Press, 2006).
- Heptner and Dzubiella (2015) N. Heptner and J. Dzubiella, Mol. Phys. 113, 2523 (2015).