Coordinated X-ray and Optical observations of Star-Planet Interaction in HD 17156
Abstract
The large number of close-in Jupiter-size exoplanets prompts the question whether star–planet interaction (SPI) effects can be detected. We focused our attention on the system HD 17156, having a Jupiter-mass planet in a very eccentric orbit. Here we present results of the XMM-Newton observations and of a five months coordinated optical campaign with the HARPS-N spectrograph111Based on observations collected at the Italian Telescopio Nazionale Galileo (TNG), operated on the island of La Palma by the Fundanción Galileo Galilei of the INAF (Istituto Nazionale di Astrofisica), in the frame of the programme Global Architecture of Planetary Systems (GAPS).. We observed HD 17156 with XMM-Newton when the planet was approaching the apoastron and then at the following periastron passage, quasi simultaneously with HARPS-N. We obtained a clear () X-ray detection only at the periastron visit, accompanied by a significant increase of the chromospheric index. We discuss two possible scenarios for the activity enhancement: magnetic reconnection and flaring or accretion onto the star of material tidally stripped from the planet. In any case, this is possibly the first evidence of a magnetic SPI effect caught in action.
Subject headings:
stars: individual (HD 17156) — stars: activity — stars: coronae — stars: late-type — X-rays: stars1. Introduction
The discovery of new extrasolar planetary systems is today routinely carried out with a wealth of space-based and ground-based observational facilities, and our knowledge frontier has already moved on from their mere search to the determination of stellar and planetary properties which are relevant to understand the evolution of these bodies during stellar lifetime. In particular, one of the open issues is the extent of magnetic star–planet interaction (SPI) and its detectable effects in systems with close-in massive planets (so called “hot Jupiters”). This phenomenon is astrophysically important for the characterization of planetary magnetospheres, and as a mechanism of energy and angular momentum transfer between the host star and its planet(s) (Cuntz et al. 2000).
Observations of variable chromospheric emission signatures, such as the Ca II H&K lines cores, were reported for a few stars, with a modulation period close to the orbital period of the planet (Shkolnik et al. 2005, 2008), and interpreted as evidence of SPI of magnetic origin. In fact, a tidally induced effect can be excluded because – for low-eccentricity orbits – the periodic modulation is expected twice per orbital period, due to the two tidal bulges on the opposite sides of the stellar surface. Conversely, a purely stellar activity effect is unlikely because the relevant time scale should be the stellar rotation period rather than the planetary orbital period.
However, significant chromospheric variability is visible only at some epochs, and the existence of detectable SPI signatures at X-ray wavelengths is a matter of debate. Kashyap et al. (2008) showed that stars with hot Jupiters are statistically brighter in X-rays than stars without hot Jupiters, and Scharf (2010) claimed a correlation between the X-ray luminosity of the host star and the planetary mass which he ascribed to the same phenomenon. Detailed statistical studies by Poppenhaeger et al. (2010) and Poppenhaeger & Schmitt (2011), reached instead the conclusion that the above results can be affected by observational biases, and that SPI induces quite small effects in most cases, which become important and measurable only in peculiar systems.
Recently, Pillitteri et al. (2010) and Poppenhaeger & Wolk (2014) pinpointed the case of two wide binaries where the planet-hosting primary component is much brighter in X-rays than expected by considering the activity level of the coeval companion. This finding suggests that SPI, by acting through transfer of angular momentum from the planet to the star and increasing thus the stellar rotation and activity, may lead to enhanced X-ray emission and thus “rejuvenating” the star.
Detailed studies of individual systems were also performed, leading to different results: the occurrence of repeated flaring events in HD 189733 A just after egress from planet occultation, observed with XMM-Newton (Pillitteri et al. 2011, 2014, 2015), suggests a systematic SPI that leads to X-ray and FUV variability phased with the planetary motion; instead, a long XMM-Newton monitoring program of HD 179949 (Scandariato et al. 2013), showed evidence of chromospheric and coronal variability most likely due to stellar rotation and to intrinsic short-term activity evolution, but no clear signature related to the orbital motion of the planet.
| Date | Orbital | |||
|---|---|---|---|---|
| (2014) | Phase | [s] | ||
| XMM-NewtonObservations | ||||
| Sep 5 | 56905.02595 | 0.267–0.285 | 32,100 | |
| Sep 20b | 56920.96779 | 0.018–0.037 | 32,900 | |
| HARPS-N Observations | ||||
| Aug 5 | 56874.23161 | 0.815 | 900 | |
| Aug 7 | 56876.23117 | 0.909 | 900 | |
| Aug 8 | 56877.21796 | 0.956 | 900 | |
| Aug 9 | 56878.23348 | 0.004 | 900 | |
| Aug 21c | 56890.24703 | 0.570 | 900 | |
| Sep 9 | 56909.07199 | 0.457 | 10,800 | |
| Sep 21b | 56921.20339 | 0.029 | 7,200 | |
| Nov 10 | 56971.08149 | 0.380 | 7,200 | |
| Nov 25 | 56986.07491 | 0.087 | 900 | |
| Dec 7 | 56998.03466 | 0.650 | 900 | |
| Dec 14 | 57005.08871 | 0.983 | 7,200 | |
Note. — : . : simultaneous observations. c High umidity night (%).
From a theoretical point of view, analytical models were developed to explain the periodic chromospheric enhancements as due to flare-like magnetic reconnection events (e.g., Lanza 2009), with an expected dependence on the relative velocity between the coronal and planetary magnetic fields. Another key parameter is given by the relative strength of planetary and stellar magnetic fields, which determines the level of intersection of the respective Alfvénic surfaces, as investigated by Cohen et al. (2009) and Lanza (2012). Sophisticated MHD simulations by Cohen et al. (2009) confirm that the interaction of stellar and planetary magnetospheres lead to magnetic stresses that may result in reconnection and reconfiguration events where energy is eventually dissipated by high-energy radiation.
As a possible test of this scenario we focused our attention on HD 17156 (catalog ), a system with a Jupiter-mass planet in an eccentric orbit. In fact, SPI is expected to have a strong dependence on the star–planet separation (Cuntz et al. 2000), and in systems with elongated orbits it must occur preferentially or exclusively in proximity of periastron, when the stellar and planetary magnetospheres are close enough to interact.
2. Target and Observations
The system is composed by a G0 primary () at 75 pc from the Sun and a transiting planet () on a 21.2 days period orbit with eccentricity , and periastron and apoastron distances of 7.4 R∗ and 39.1 R∗, respectively (semimajor axis AU, Barbieri et al. 2009). The host star is characterized by a chromospheric activity index ranging from to (Pace 2013), typical of middle-aged solar-type stars.
3. Coordinated X-ray and optical campaign
We observed HD 17156 with the EPIC camera on board XMM-Newton in two visits of ks each, on September 5 and September 20 2014. The aim was to observe the star with the planet at the periastron passage and far from periastron in order to seek phase-related X-ray variability which could be ascribed to SPI.
The Observation Data Files (ODF) were reduced with SAS ver. 13.5 and the latest set of calibration files (CCF). For each exposure, we obtained tables of the events calibrated in detector positions, arrival time, energy, event PATTERN and quality flag. We filtered the events for the recommended flags and patterns (FLAG=0, PATTERN ), with energies in the broad band 0.3–8.0 keV, and in a soft band 0.3–1.5 keV. Since a soft spectrum is expected for low-activity stars like HD 17156, we preferred the soft band for source detection in the EPIC images, as already experimented with the observations of HD 189733, having the bulk of X-ray emission below 1.5 keV (Pillitteri et al. 2014).
For the detection of the star and for estimating significance and rate, or upper limits, we used a code based on a multi-scale wavelet convolution (Damiani et al. 1997a, b).
HD 17156 was also observed with the HARPS-N spectrograph (Cosentino et al. 2012) at the Italian 3.6m Telescopio Nazionale Galileo. In this paper we present data acquired between 2014 August and December, in preparation and as a follow-up of the XMM-Newton program. The full observation log is shown in Tab. 1. Note in particular two HARPS-N observations coordinated with XMM-Newton, on 2014 September 9 and 21, the latter effectively simultaneous with XMM-Newton while the planet was at periastron.
Optical spectra were acquired with different exposure times, for different aims: short exposures (15 minutes each) belong to a long-term series aimed to precise radial velocity measurements, while long exposures (120 or 180 minutes) were optimized for high-resolution spectroscopy of the Ca II H&K 3968.5, 3933.7 Å chromospheric emission lines. In order to avoid saturation at longer wavelengths, the long exposures were always split in a number of 15 minutes sub-exposures, and the raw images were combined a posteriori to compute an average spectrum using the standard HARPS-N pipeline. In this respect, we have followed the same observation strategy and data reduction and analysis detailed in Borsa et al. (2015).
These data were employed to update the orbital parameters. Adopting the transit timing reported in Nutzman et al. (2011), we obtained the following ephemeris () for the passage at periastron:
| (1) |
The orbital phases at the start of each observation are reported in Tab.1.
4. Results
4.1. X-Ray Emission Switching On
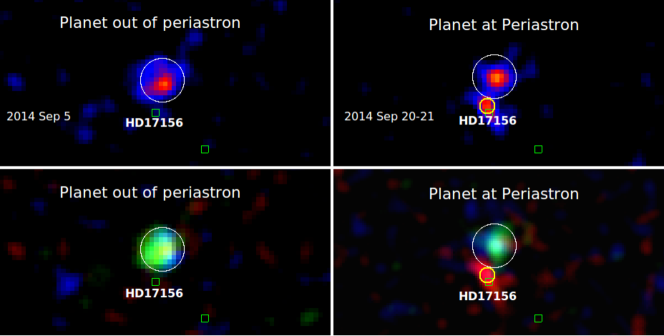
In Fig. 1 we show the field of view around HD 17156 in the two XMM-Newton exposures. The brightest source visible in both images is an unidentified background source, at from the optical position of our target. HD 17156 was not detected while the planet was approaching the apoastron (September 5), at a level of of the local background, while it was detected in the visibility window that started 9 hr after periastron (September 20) and lasted for about 10 hr. Employing the pn and MOS 2 data222MOS 1 data were discarded because of the presence of a CCD gap near the target location., we obtained a significance level in the soft band, with a pn-equivalent count rate of cts s using a maximum wavelet spatial scale of . About photons were collected in total in the two EPIC detectors, and their time distribution is compatible with a constant source (Kolmogorov–Smirnov test probability %).
The evaluation of the target X-ray flux is hampered by the presence of the contaminating background source, detected in the first observation with a count rate % higher than in the second observation. However, this source is quite hard and highly absorbed: in fact, its spectrum can be described as a thermal source with keV attenuated by a hydrogen column density cm-2 . Hence, we employed only the events collected with the pn detector in the soft band (0.3-1.5 keV) already used for the source detection process. Taking into account the Encircled Energy Fraction for a point source within a radius, we obtain a count rate of cts/s for HD 17156. We estimated the source X-ray flux assuming optically thin emission from a thermal plasma with solar composition and MK, as appropriate for a solar-type corona, thus obtaining erg cm-2 s-1 . A similar procedure yielded an upper limit erg cm-2 s-1 for the source emission far from the periastron.
In order to evaluate the intrinsic source X-ray luminosity, we estimated the interstellar absorption starting from the stellar effective temperature K (Gilliland et al. 2011), which implies an unreddened color (Sekiguchi & Fukugita 2000), and a color excess , yielding an optical extinction , and hence cm-2 (Güver & Özel 2009). From this value of absorption and the thermal emission model assumed above, we obtain an unabsorbed flux of erg cm-2 s-1 , and a corresponding X-ray luminosity of erg s-1 close to periastron. Similarly, far from periastron the upper limit is erg s-1 . We note however that these estimates are very sensitive to the assumed plasma temperature. For example, a 1 MK plasma would imply X-ray luminosities 6 times larger than reported above.
4.2. Chromospheric emission
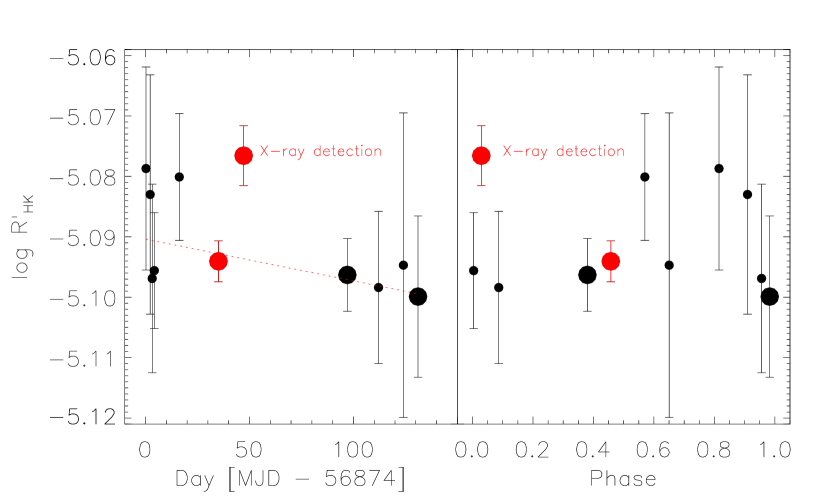
The Mount Wilson index was computed by the HARPS-N pipeline following the recipe of Lovis et al. (2011). We recall that this is a measure of the chromospheric emission in the Ca II H&K lines, corrected for a basal level depending on the stellar color, and normalized to the stellar bolometric luminosity. In Fig. 2 we show the variation of vs. time, from 2014 August to December, and vs. orbital phase. In the 5 months considered, the data suggest a chromospheric activity level essentially flat within the uncertainties of the measures. Most remarkable is the significantly higher () value of measured simultaneously with the X-ray detection of our target. In fact, we observed a 4% increase of the chromospheric emission at phase 0.03 (just after periastron) with respect to the previous measurement taken at phase 0.46 (approaching apoastron). High values apparently occurred also on other dates in 2014 August, but these measurements are affected by relatively large uncertainties because they were derived from observations with short exposures. Some low-level variability could also be due to residual systematics in the reduction of the HARPS-N data (Lovis et al. 2011).
5. Discussion and conclusions
HD 17156 showed enhanced chromospheric and coronal emission a few hours after the passage of the planet at the periastron. Both the X-ray luminosity and the index indicate a star with a magnetic activity level lower than expected. In fact, modeling of the Rossiter–McLaughlin effect yields a rotational velocity of km s (Narita et al. 2009), and the computed rotation period days leads to a presumed X-ray luminosity – erg s-1 , adopting the activity–rotation relations by Pizzolato et al. (2003). Starting from a stellar age of Gyr, based on transit and asteroseismic observations by Nutzman et al. (2011), we also derive and in the range from the activity–age relations by Mamajek & Hillenbrand (2008). Our observed chromospheric and coronal emission levels are, respectively, a factor and lower than the values above. On the other hand, the measured chromospheric index indicates an X-ray luminosity 1–2 erg s-1 , in agreement with the XMM-Newtonobservations. We conclude that HD 17156 was in a low-activity state, with a “quiescent” X-ray luminosity just below the detection sensitivity of the Sept 5 XMM-Newtonobservation. Consequently, in the following we assume an average large-scale magnetic field strength of just 1 G (Vidotto et al. 2014), and an energy release erg s-1 due to an SPI event at the periastron. We deem unlikely the occurrence of a spontaneous flaring event of such power ( quiescent ) in the corona of a quiet star, such as HD 17156, just after reaching the minimum star–planet separation.
One hypothesis is that the SPI phenomenon has a magnetic origin. We evaluated the energy budget with the magnetic SPI models by Lanza (2013). We assume a loop interconnecting the stellar magnetic field with a planetary field of G (based on analogy with our Jupiter and theoretical models, e.g. Reiners & Christensen 2010). For magnetic confinement, the plasma temperature near the planet position should not exceed 0.7 MK. In this case, the maximum available power due to magnetic stresses near periastron is erg s-1, for a stellar potential dipolar configuration. We do not expect any energy release by this mechanism at apoastron. A possible difficulty with this explanation rests on the MHD time scales for establishing an interconnecting loop, building up the magnetic stresses and releasing the accumulated energy, given the fast planetary passage. In fact, the relative velocity of the magnetic field co-rotating with the star with respect to the planet speed at periastron is about 160 km s-1, implying a dynamical time scale of 10–15 hr. Stability of such a long loop ( cm) is also an open issue. Reconnection between separate stellar and planetary magnetospheres is also unlikely, because the dissipated power would be lower than estimated above by about four orders of magnitude (Lanza 2012).
An alternative possibility is that the power emitted in X-rays is released by matter evaporated from the planet and accreted onto the star near periastron (Matsakos et al. 2015; Pillitteri et al. 2015). This requires a mass accretion rate larger than g s-1 to make a power of erg s-1 available. The free-fall time from the inner Lagrangian point L1 to the star is about 14 hr, making this process compatible with the delay of the brightening we observed after periastron. On the other hand, detailed simulations are required to understand the mechanism and time scale of accumulation and spill over of evaporated material onto the star.
In any case, inspection of Fig. 2 shows that no significant chromospheric brightening was observed near other periastron passages, preceding or following the one highlighted by the X-ray detection. We conclude that SPI events in this high-eccentricity system occur occasionally, or they have a short time duration. Monitoring of HD 17156 will be continued in the frame of the GAPS programme with the aim to better understand the frequency of the putative SPI effects and their nature. On the other hand, new X-ray observations are severely limited by the faintness of the target and by visibility constraints with XMM-Newton.
References
- Barbieri et al. (2009) Barbieri, M., Alonso, R., Desidera, S., et al. 2009, A&A, 503, 601
- Borsa et al. (2015) Borsa, F., Scandariato, G., Rainer, M., et al. 2015, A&A, 578, A64
- Cohen et al. (2009) Cohen, O., Drake, J. J., Kashyap, V. L., et al. 2009, ApJ, 704, L85
- Cosentino et al. (2012) Cosentino, R., Lovis, C., Pepe, F., et al. 2012, in Society of Photo-Optical Instrumentation Engineers (SPIE) Conference Series, Vol. 8446, Society of Photo-Optical Instrumentation Engineers (SPIE) Conference Series, 1
- Cuntz et al. (2000) Cuntz, M., Saar, S. H., & Musielak, Z. E. 2000, ApJ, 533, L151
- Damiani et al. (1997a) Damiani, F., Maggio, A., Micela, G., & Sciortino, S. 1997a, ApJ, 483, 350
- Damiani et al. (1997b) —. 1997b, ApJ, 483, 370
- Gilliland et al. (2011) Gilliland, R. L., McCullough, P. R., Nelan, E. P., et al. 2011, ApJ, 726, 2
- Güver & Özel (2009) Güver, T., & Özel, F. 2009, MNRAS, 400, 2050
- Kashyap et al. (2008) Kashyap, V. L., Drake, J. J., & Saar, S. H. 2008, ApJ, 687, 1339
- Lanza (2009) Lanza, A. F. 2009, A&A, 505, 339
- Lanza (2012) —. 2012, A&A, 544, A23
- Lanza (2013) —. 2013, A&A, 557, A31
- Lovis et al. (2011) Lovis, C., Dumusque, X., Santos, N. C., et al. 2011, ArXiv e-prints, arXiv:1107.5325
- Mamajek & Hillenbrand (2008) Mamajek, E. E., & Hillenbrand, L. A. 2008, ApJ, 687, 1264
- Matsakos et al. (2015) Matsakos, T., Uribe, A., & Königl, A. 2015, A&A, 578, A6
- Narita et al. (2009) Narita, N., Hirano, T., Sato, B., et al. 2009, PASJ, 61, 991
- Nutzman et al. (2011) Nutzman, P., Gilliland, R. L., McCullough, P. R., et al. 2011, ApJ, 726, 3
- Pace (2013) Pace, G. 2013, A&A, 551, L8
- Pillitteri et al. (2011) Pillitteri, I., Günther, H. M., Wolk, S. J., Kashyap, V. L., & Cohen, O. 2011, ApJ, 741, L18
- Pillitteri et al. (2015) Pillitteri, I., Maggio, A., Micela, G., et al. 2015, ApJ, 805, 52
- Pillitteri et al. (2010) Pillitteri, I., Wolk, S. J., Cohen, O., et al. 2010, ApJ, 722, 1216
- Pillitteri et al. (2014) Pillitteri, I., Wolk, S. J., Lopez-Santiago, J., et al. 2014, ApJ, 785, 145
- Pizzolato et al. (2003) Pizzolato, N., Maggio, A., Micela, G., Sciortino, S., & Ventura, P. 2003, A&A, 397, 147
- Poppenhaeger et al. (2010) Poppenhaeger, K., Robrade, J., & Schmitt, J. H. M. M. 2010, A&A, 515, A98
- Poppenhaeger & Schmitt (2011) Poppenhaeger, K., & Schmitt, J. H. M. M. 2011, ApJ, 735, 59
- Poppenhaeger & Wolk (2014) Poppenhaeger, K., & Wolk, S. J. 2014, A&A, 565, L1
- Reiners & Christensen (2010) Reiners, A., & Christensen, U. R. 2010, A&A, 522, A13
- Scandariato et al. (2013) Scandariato, G., Maggio, A., Lanza, A. F., et al. 2013, A&A, 552, A7
- Scharf (2010) Scharf, C. A. 2010, ApJ, 722, 1547
- Sekiguchi & Fukugita (2000) Sekiguchi, M., & Fukugita, M. 2000, AJ, 120, 1072
- Shkolnik et al. (2008) Shkolnik, E., Bohlender, D. A., Walker, G. A. H., & Collier Cameron, A. 2008, ApJ, 676, 628
- Shkolnik et al. (2005) Shkolnik, E., Walker, G. A. H., Bohlender, D. A., Gu, P.-G., & Kürster, M. 2005, ApJ, 622, 1075
- Vidotto et al. (2014) Vidotto, A. A., Gregory, S. G., Jardine, M., et al. 2014, MNRAS, 441, 2361