Localized starbursts in dwarf galaxies produced by impact of low metallicity cosmic gas clouds
Abstract
Models of galaxy formation predict that gas accretion from the cosmic web is a primary driver of star formation over cosmic history. Except in very dense environments where galaxy mergers are also important, model galaxies feed from cold streams of gas from the web that penetrate their dark matter haloes. Although these predictions are unambiguous, the observational support has been indirect so far. Here we report spectroscopic evidence for this process in extremely metal-poor galaxies (XMPs) of the local Universe, taking the form of localized starbursts associated with gas having low metallicity. Detailed abundance analyses based on Gran Telescopio Canarias (GTC) optical spectra of ten XMPs show that the galaxy hosts have metallicities around 60% solar on average, while the large star-forming regions that dominate their integrated light have low metallicities of some 6% solar. Because gas mixes azimuthally in a rotation timescale (a few hundred Myr), the observed metallicity inhomogeneities are only possible if the metal-poor gas fell onto the disk recently. We analyze several possibilities for the origin of the metal-poor gas, favoring the metal-poor gas infall predicted by numerical models. If this interpretation is correct, XMPs trace the cosmic web gas in their surroundings, making them probes to examine its properties.
Subject headings:
galaxies: abundances – galaxies: dwarf – galaxies: evolution – galaxies: formation – galaxies: structure – intergalactic medium1. Motivation
Metals are primarily produced by stars. Thus, metal-poor objects are chemically unevolved, providing a gateway to sample physical conditions and processes characteristic of early phases in the Universe. XMP galaxies, defined to have less than one tenth of the metals in the solar composition (Kunth & Östlin 2000), are rare in the local Universe (% of all galaxies; Morales-Luis et al. 2011). They tend to be dwarf galaxies but, unlike other dwarfs (Kobulnicky & Skillman 1996), their chemical composition may not be uniform (Papaderos et al. 2006; Izotov et al. 2009; Levesque et al. 2011; Sánchez Almeida et al. 2013, 2014b), with the low metallicity only in regions of intense star formation. Such non-uniformity is particularly revealing because the timescale for azimuthal mixing in normal galaxies is short, of the order of a fraction of the rotational period (e.g., de Avillez & Mac Low 2002; Yang & Krumholz 2012). It would imply that the metal-poor gas in XMPs was recently accreted from a nearly pristine cloud, providing long-sought evidence for cosmic accretion that has been difficult to observe directly (Sánchez Almeida et al. 2014a). For example, gas flows have been observed on the periphery of distant galaxies using absorption lines in the spectra of background sources. However, the material is often not significantly lower in metals than the galaxy itself, suggesting gas recycled from previous outflows, and therefore dynamically detached from the large-scale cosmic web (Lehner et al. 2013; Churchill et al. 2013; Liang & Chen 2014).
Here we put on firm observational bases the existence of chemical inhomogeneities in most XMPs, thus unequivocally showing their star formation to be feeding from external metal-poor gas. Measuring chemical inhomogeneities in XMPs is technically challenging, requiring spectra of high quality from faint regions. We used the 10.4 m GTC111http://www.gtc.iac.es/GTChome.php (Sect. 2) to measure oxygen abundance along the major axes of ten XMP galaxies (Table 1) with a robust variant of the direct method (Pérez-Montero 2014, see Sect. 3). In nine out of ten cases, sharp metallicity drops were found (Sect. 4). The origin of the metal-poor gas is analyzed in Sect. 5, leaving as the most convincing hypothesis the gas infall from the web predicted by numerical models.
2. Observations
The ten galaxies in Table 1 represent 7 % of all known XMPs when the project began (Morales-Luis et al. 2011), and they were chosen to be representative of the XMP family. They were observed with the long-slit mode of the spectrograph OSIRIS at GTC. We used an intermediate resolution grism which renders the spectral range needed for abundance analysis in a single exposure (from 3700 Å to 7000 Å) with a dispersion of 7.8 Å per pixel, enough to spectrally resolve the required emission lines. The width of the spectrograph slit was set to 1 arcsec, which matches the typical seeing during observation. Integration times amount to two hours per target. The spectra were reduced and calibrated using standard modules of the package IRAF222http://iraf.noao.edu/, with the line fluxes computed from the calibrated spectra using custom-made IDL routines.
| NameaaRA and DEC in J2000 coordinates. | bbOxygen abundance at the starburst. | ccStellar mass of the galaxy from MPA-JHU given in units. | DddRedshift-based galactocentric distance, in Mpc, from NED (NASA/IPAC Extragalactic Database). | HII SizeeeSeeing-corrected full-width half-maximum size of the starburst, in kpc, as inferred from the H emission. |
ffDoes the galaxy show chemical inhomogeneities? Yes or No. –
Note that the only galaxy without chemical inhomogeneities is also the object
of largest metallicity.
|
|---|---|---|---|---|---|
| J | Y | ||||
| J | Y | ||||
| J | Y | ||||
| J | Y | ||||
| J | Y | ||||
| J | Y | ||||
| J | N | ||||
| J | Y | ||||
| J | Y | ||||
| J | Y |
3. Determination of metallicities, stellar masses, and star-formation rates
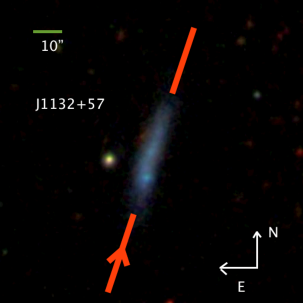
HII regions are photoionized by young stars. Their emission-line spectrum allows the determination of the oxygen abundance independently of the details of the ionization source and the geometry of the nebula (Osterbrock 1974; Stasińska et al. 2012). The spectrum contains a number of collisionally excited emission lines that empirically provide electron-density and electron-temperature. Given temperature and density, atomic properties yield the expected emission per ion, therefore, the total flux of a particular emission line directly gives the total number of ions in the nebula responsible for such emission. The case of oxygen is particularly favorable since, in HII regions, oxygen is in the form of O+ and O++, and both species produce strong emission lines. The total oxygen abundance results from adding the contribution of O+ and O++. A drawback of this technique (the so-called direct method; DM) is the need to measure fluxes of weak lines often at the noise level. Unfortunately, this problem affects the faint tails of our XMPs (Figs. 1 and 2). We circumvent the difficulty using HII-CHI-mistry333http://www.iaa.es/ epm/HII-CHI-mistry.html (Pérez-Montero 2014), a procedure that compares the brightest optical emission lines with predictions of a grid of photoionization models covering a wide range of possible physical conditions. The resulting metallicity is calculated as the -weighted mean of the metallicities in the models, with the -weighted standard deviation providing the error. This method leads to an oxygen abundance which is consistent with the DM determination within 0.07 dex, i.e., within the intrinsic uncertainty of the DM (Pérez-Montero 2014). The agreement implies that HII-CHI-mistry inherits the good properties of DM, so that the geometry and other assumptions needed to build the grid of models do not influence the inferred oxygen abundance. Provided that the emission lines are produced by photoionization, the agreement between HII-CHI-mistry and DM guarantees that irrespectively of the source of ionizing photons, our abundance determinations along the XMP major axes are reliable and can be inter-compared. Photoionization is a good approximation even for the faintest parts of XMPs, as attested by the weakness of the line [NII]6583 Å. In the cases where we have been able to measure it, its flux is less than a tenth of the H flux which, according to the BPT diagnostic diagram (Baldwin et al. 1981), discards ionization by Active Galactic Nuclei, shocks (Kewley et al. 2013), and evolved stars (Cid Fernandes et al. 2011).
The stellar masses of the galaxies given in Table 1 were determined by the MPA-JHU collaboration from galaxy-integrated magnitudes (Brinchmann et al. 2004; Salim et al. 2007). Broad-band magnitudes from the SDSS-DR7 database were compared with a grid of theoretical galaxy spectra (Bruzual & Charlot 2003) spanning a large range in star-formation histories. From the difference between observed and theoretical magnitudes, a likelihood distribution for the mass of each galaxy is estimated. The median and the dispersion of this distribution are used for the stellar mass and its error.
Star Formation Rates (SFRs) are needed for the discussion of the results (e.g., Figs. 1 and 2). We inferred them from the observed H flux as described by Kennicutt (1998). The underlying hypothesis is that H quantifies the number of ionizing photons produced by young ( 20 Myr) massive ( 10 M⊙) stars, and so, its flux scales with the current SFR.
4. Results
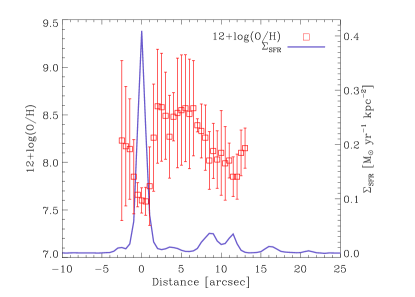
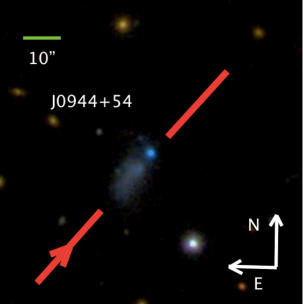
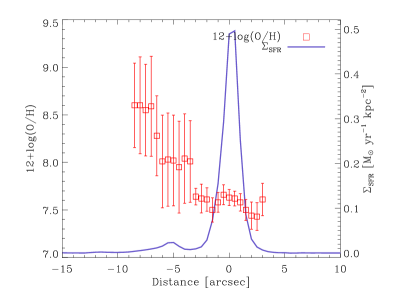
HII-CHI-mistry provides the abundance of oxygen along the major axis of the galaxies. In nine out of the ten cases, sharp metallicity drops were found (examples are given in Figs. 1 and 2, with the only exception having constant metallicity pointed out in Table 1). Remarkably, the metallicity drops occur coinciding with starburst regions (the solid lines in Figs. 1 and 2, bottom panels).
A summary plot with the metallicity of the starbursts and the underlying galaxies is given in Fig. 3. The abundance of the starburst was determined as the lowest abundance, whereas the abundance of the host was computed by averaging all the values in a region of 2.5 arcsec around the position with the largest abundance. The host galaxies have metallicities higher than the starbursts by factors of 3 to 10 where their surface SFRs are smaller by factors of 10 to 100.
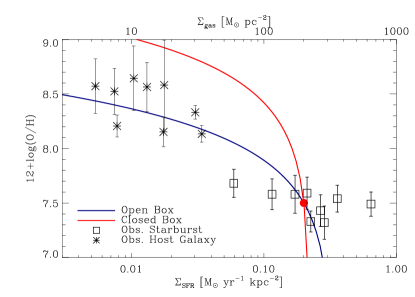
According to the empirically established scaling between surface SFR and gas surface density (the so-called Kennicutt-Schmidt law; e.g., Kennicutt 1998; Yang & Krumholz 2012; Cormier et al. 2014), the observed starbursts imply large gas reservoirs with surface densities between and (Fig. 3, upper axis).
According to simple chemical evolution models the starbursts can evolve to become the host only if they expel 80 % of the gas and metals to the intergalactic medium (blue solid line in Fig. 3). If the evolution proceeds as a closed-box, and it begins from pure metal-free gas, the fraction of mass in metals of the interstellar medium depends only on the gas that remains (e.g., Edmunds 1990), so that if a region of metallicity and gas mass evolves to reach a metallicity of gas mass , then with the stellar yield, i.e., the mass of new metals eventually ejected per unit mass locked into stars. The red solid line in Fig. 3 shows the evolution expected for a region at the red bullet assuming a typical Oxygen yield (0.004; Meynet & Maeder 2002). It renders metallicities too high to explain the metallicity of the host galaxy by close-box evolution of the starbursts. If gas is allowed to leak out of the system, the relationship between gas mass and metallicity remains formally as for the closed-box model, replacing the stellar yield with an effective yield that involves the fraction of mass in stars that returns to the interstellar medium , as well as the so-called mass loading factor , that gives the outflow rate in terms of the SFR (e.g., Sánchez Almeida et al. 2014a); . The blue solid line in Fig. 3 corresponds to , or to given , which implies that for each solar mass of gas locked into stars, four solar masses of gas flow out of the system.
Figure 4 shows the scatter plot of metallicity vs galaxy stellar mass for both the host and the starburst.
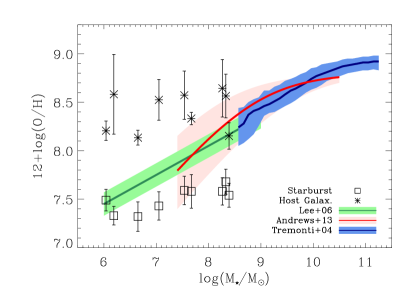
Our objects are outliers of the mass metallicity relationship (MZR) observed in the local Universe. The green and the blue lines in Fig. 4 represent MZRs for the range of low-mass galaxies (Lee et al. 2006) and high-mass galaxies (Tremonti et al. 2004), respectively, with the shaded areas portraying the observed standard deviation at a given mass. The high-mass metallicities have been decreased by 0.2 dex to make the strong-line method of the original work consistent with the DM scale used here (Kewley & Ellison 2008). The MZR is based on the metallicity of the brightest parts of the galaxies therefore, XMPs must be represented by the metallicity of their starbursts, which clearly lie below the observed MZR (Fig. 4). The scatter at a given mass is known to be related to the SFR (Mannucci et al. 2010; Lara-López et al. 2010), so that the higher the SFR the lower the metallicity. The pink area in Fig. 4 represents the spread in metallicity to be expected if the SFR changes by times the mean SFR given by the red solid line (Andrews & Martini 2013), and this dependence naturally accounts for the large difference in metallicity between starburst and host. XMPs are going through an active star-formation phase, with starbursts of low metallicity. The end of this phase will disclose a galaxy having properties close to those of the host, i.e., a stellar mass similar to the present XMP but with low SFR and high metallicity.
5. Discussion
The XMPs studied here have an off-center starburst of low metallicity but, otherwise, they are rather normal disk-like galaxies with exponential light profiles, modest rotational velocities, and significant random motions (Elmegreen et al. 2012; Sánchez Almeida et al. 2013). Under these conditions the time-scale for azimuthal gas-mixing is rather short (see Sect. 1), therefore, the metal-poor gas associated with the starburst must have arrived to the galaxy recently.
The mass surface density at the starburst is unusually large for the outer parts of dwarf irregular galaxies (Cormier et al. 2014), by a factor of . If the excess mass is from a recently accreted cosmic cloud, then it mixed with the ambient gas and diluted the ambient metallicity by the same factor, 10:1. This dilution accounts for the metallicity drop in the starbursts. The accretion time is constrained by the localization of the star formation, which is not sheared or spiral-like. The confinement of the enhanced star formation to local regions several hundred parsecs in diameter (Table 1) implies that the accretion time is shorter than the orbital time. For small galaxies like these the orbital time over one radian is Myr. Accretion lasting for Myr or less corresponds to an impacting cloud with a vertical extent that is similar to the radius of the galaxy or several kpc, considering that the infall speed is likely comparable to the rotation speed since both are set by the gravitational potential. From these considerations, we conclude the following scenario for XMP galaxies with locally low metallicities studied here. Sometime within a period of Myr, a cosmic cloud with low metallicity impacted the outer region of a regular dwarf galaxy disk, compressing it, diluting the original metals, and triggering excess star formation, all by factors of 10. This picture is consistent with the current ideas on how dwarf galaxies grow through gas accretion (Sect. 1 and Finlator & Davé 2008; Dekel et al. 2009; Schaye et al. 2010), even though the interaction between gas streams and forming disks remains to be properly understood (Ceverino et al. 2010; Verbeke et al. 2014).
Explanations alternative to the cosmic origin of the gas cannot be completely ruled out, although they are disfavored by observations. Major mergers are not obvious in the optical images, and can be further discarded arguing that XMPs reside in low density environments, with their large HI envelops showing only moderate distortions (Filho et al. 2015). Minor gas-rich mergers could explain localized metallicity drops, provided that the gas in the accreted galaxy has a metallicity lower than the metallicity at the drop. A minor-merger scenario differs from a gas accretion scenario only if the merging galaxy has enough stars and dark matter. The additional mass would generally be much larger than the merging gas mass alone, and the distortion on the host would be larger as well. Merging stars should also penetrate the host disk, unlike the merging gas, and these stars would orbit differently than the host stars, possibly producing star streams in the host halo. Since neither large HI distortions nor stellar streams are evident in XMPs (see, e.g., Figs. 1 and 2), the hypothetical merging galaxy must have little dark matter and stars and, consequently, it could be likened to a gas stream. On the other hand, model cosmic gas streams are often clumpy, with some stars forming in the densest cores (e.g., Dekel et al. 2009), in which case the accretion of a clumpy stream is equivalent to a merger with a small very gas-rich dark-matter-poor satellite. The difficulty to distinguish a pure gas accretion event from a gas-rich minor merger can be linked to the problem of finding an operational definition of galaxy at the low-mass end of galaxy masses (see Forbes & Kroupa 2011; Willman & Strader 2012). Yet another possibility for feeding XMPs could be gas accretion from the galaxy halo induced by galactic fountains (Fraternali & Binney 2008; Fraternali 2014). The metal-rich gas ejected from the stellar disk acts as a catalyst when it becomes mixed with the hot metal-poor halo gas. The mixing catastrophically decreases the halo cooling-time, and mass from the halo is dragged along when the fountain gas falls back onto the disk. Several observations disfavor this possibility, though. The mass dragged along is only a fraction of the original mass, and so, the gas falling in is not very metal-poor. In addition, the accreted material is expected to spread out over the disk rather than being concentrated, and the gaseous haloes in dwarfs are not massive, suggesting the mechanism to be inefficient in our particular case.
A unidirectional propagation of star-formation may produce a head-tail morphology, with decreasing surface brightness and increasing age and metallicity from the position of the current starburst. This mechanism was proposed by Papaderos et al. (1998) to explain the color gradient in the XMP galaxy SBS 0335-052E, and may work for other XMPs as well. The required unidirectional propagation would naturally occur if the underlying gaseous structure is already very prolate. Even if uncommon, cigar-like galaxies are theoretically conceivable (e.g., Baek et al. 2003), and have been observed at high redshift (e.g., Yuma et al. 2011).
The gas-cloud impact scenario explains the lower limit for the metallicities of the XMPs, which is around 1/50th the solar metallicity (e.g., Sánchez Almeida et al. 2014a). The absence of objects with lower metallicity has challenged interpretation for decades (Kunth & Lebouteiller 2011). However, the threshold is naturally set in this context by the metallicity of the cosmic web gas at the present time, which is predicted to be around the observed limit (e.g., Fumagalli et al. 2011). The scenario also explains why XMPs tend to be cometary (Papaderos et al. 2008; Morales-Luis et al. 2011). The impacting gas clouds have the largest effect on the outskirts of galaxies where the ambient pressure and column density are low. For most orientations of the galaxy, this gives a cometary shape (like Figs. 1 and 2).
If our scenario is correct, XMPs should not be regarded as pristine galaxies but as objects that are still forming in the nearby Universe. Their gas traces the intergalactic medium in their immediate surrounding, providing a new method to characterize the cosmic web.
References
- Andrews & Martini (2013) Andrews, B. H. & Martini, P. 2013, ApJ, 765, 140
- Baek et al. (2003) Baek, C. H., Kang, H., & Ryu, D. 2003, ApJ, 584, 675
- Baldwin et al. (1981) Baldwin, J. A., Phillips, M. M., & Terlevich, R. 1981, PASP, 93, 5
- Brinchmann et al. (2004) Brinchmann, J., Charlot, S., White, S. D. M., et al. 2004, MNRAS, 351, 1151
- Bruzual & Charlot (2003) Bruzual, G. & Charlot, S. 2003, MNRAS, 344, 1000
- Ceverino et al. (2010) Ceverino, D., Dekel, A., & Bournaud, F. 2010, MNRAS, 404, 2151
- Churchill et al. (2013) Churchill, C. W., Trujillo-Gomez, S., Nielsen, N. M., & Kacprzak, G. G. 2013, ApJ, 779, 87
- Cid Fernandes et al. (2011) Cid Fernandes, R., Stasińska, G., Mateus, A., & Vale Asari, N. 2011, MNRAS, 413, 1687
- Cormier et al. (2014) Cormier, D., Madden, S. C., Lebouteiller, V., et al. 2014, A&A, 564, A121
- de Avillez & Mac Low (2002) de Avillez, M. A. & Mac Low, M.-M. 2002, ApJ, 581, 1047
- Dekel et al. (2009) Dekel, A., Birnboim, Y., Engel, G., et al. 2009, Nature, 457, 451
- Edmunds (1990) Edmunds, M. G. 1990, MNRAS, 246, 678
- Elmegreen et al. (2012) Elmegreen, D. M., Elmegreen, B. G., Sánchez Almeida, J., et al. 2012, ApJ, 750, 95
- Filho et al. (2015) Filho, M. E., Sánchez Almeida, J., Muñoz-Tuñón, C., et al. 2015, ApJ, 802, 82
- Finlator & Davé (2008) Finlator, K. & Davé, R. 2008, MNRAS, 385, 2181
- Forbes & Kroupa (2011) Forbes, D. A. & Kroupa, P. 2011, PASA, 28, 77
- Fraternali (2014) Fraternali, F. 2014, in IAU Symposium, Vol. 298, IAU Symposium, ed. S. Feltzing, G. Zhao, N. A. Walton, & P. Whitelock, 228–239
- Fraternali & Binney (2008) Fraternali, F. & Binney, J. J. 2008, MNRAS, 386, 935
- Fumagalli et al. (2011) Fumagalli, M., Prochaska, J. X., Kasen, D., et al. 2011, MNRAS, 418, 1796
- Izotov et al. (2009) Izotov, Y. I., Guseva, N. G., Fricke, K. J., & Papaderos, P. 2009, A&A, 503, 61
- Kennicutt (1998) Kennicutt, Jr., R. C. 1998, ARA&A, 36, 189
- Kewley et al. (2013) Kewley, L. J., Dopita, M. A., Leitherer, C., et al. 2013, ApJ, 774, 100
- Kewley & Ellison (2008) Kewley, L. J. & Ellison, S. L. 2008, ApJ, 681, 1183
- Kobulnicky & Skillman (1996) Kobulnicky, H. A. & Skillman, E. D. 1996, ApJ, 471, 211
- Kunth & Lebouteiller (2011) Kunth, D. & Lebouteiller, V. 2011, in EAS Publications Series, Vol. 48, EAS Publications Series, ed. M. Koleva, P. Prugniel, & I. Vauglin, 95–96
- Kunth & Östlin (2000) Kunth, D. & Östlin, G. 2000, A&A Rev., 10, 1
- Lara-López et al. (2010) Lara-López, M. A., Cepa, J., Bongiovanni, A., et al. 2010, A&A, 521, L53
- Lee et al. (2006) Lee, H., Skillman, E. D., Cannon, J. M., et al. 2006, ApJ, 647, 970
- Lehner et al. (2013) Lehner, N., Howk, J. C., Tripp, T. M., et al. 2013, ApJ, 770, 138
- Levesque et al. (2011) Levesque, E. M., Berger, E., Soderberg, A. M., & Chornock, R. 2011, ApJ, 739, 23
- Liang & Chen (2014) Liang, C. J. & Chen, H.-W. 2014, MNRAS, 445, 2061
- Mannucci et al. (2010) Mannucci, F., Cresci, G., Maiolino, R., Marconi, A., & Gnerucci, A. 2010, MNRAS, 408, 2115
- Meynet & Maeder (2002) Meynet, G. & Maeder, A. 2002, A&A, 390, 561
- Morales-Luis et al. (2011) Morales-Luis, A. B., Sánchez Almeida, J., Aguerri, J. A. L., & Muñoz-Tuñón, C. 2011, ApJ, 743, 77
- Osterbrock (1974) Osterbrock, D. E. 1974, Astrophysics of gaseous nebulae
- Papaderos et al. (2008) Papaderos, P., Guseva, N. G., Izotov, Y. I., & Fricke, K. J. 2008, A&A, 491, 113
- Papaderos et al. (1998) Papaderos, P., Izotov, Y. I., Fricke, K. J., Thuan, T. X., & Guseva, N. G. 1998, A&A, 338, 43
- Papaderos et al. (2006) Papaderos, P., Izotov, Y. I., Guseva, N. G., Thuan, T. X., & Fricke, K. J. 2006, A&A, 454, 119
- Pérez-Montero (2014) Pérez-Montero, E. 2014, MNRAS, 441, 2663
- Salim et al. (2007) Salim, S., Rich, R. M., Charlot, S., et al. 2007, ApJS, 173, 267
- Sánchez Almeida et al. (2014a) Sánchez Almeida, J., Elmegreen, B. G., Muñoz-Tuñón, C., & Elmegreen, D. M. 2014a, A&A Rev., 22, 71
- Sánchez Almeida et al. (2014b) Sánchez Almeida, J., Morales-Luis, A. B., Muñoz-Tuñón, C., et al. 2014b, ApJ, 783, 45
- Sánchez Almeida et al. (2013) Sánchez Almeida, J., Muñoz-Tuñón, C., Elmegreen, D. M., Elmegreen, B. G., & Méndez-Abreu, J. 2013, ApJ, 767, 74
- Schaye et al. (2010) Schaye, J., Dalla Vecchia, C., Booth, C. M., et al. 2010, MNRAS, 402, 1536
- Stasińska et al. (2012) Stasińska, G., Prantzos, N., Meynet, G., et al. 2012, in EAS Publications Series, Vol. 54, EAS Publications Series, ed. G. Stasińska, N. Prantzos, G. Meynet, S. Simón-Díaz, C. Chiappini, M. Dessauges-Zavadsky, C. Charbonnel, H.-G. Ludwig, C. Mendoza, N. Grevesse, M. Arnould, B. Barbuy, Y. Lebreton, A. Decourchelle, V. Hill, P. Ferrando, G. Hébrard, F. Durret, M. Katsuma, & C. J. Zeippen, 3–63
- Tremonti et al. (2004) Tremonti, C. A., Heckman, T. M., Kauffmann, G., et al. 2004, ApJ, 613, 898
- Verbeke et al. (2014) Verbeke, R., De Rijcke, S., Koleva, M., et al. 2014, MNRAS, 442, 1830
- Willman & Strader (2012) Willman, B. & Strader, J. 2012, AJ, 144, 76
- Yang & Krumholz (2012) Yang, C.-C. & Krumholz, M. 2012, ApJ, 758, 48
- Yuma et al. (2011) Yuma, S., Ohta, K., Yabe, K., Kajisawa, M., & Ichikawa, T. 2011, ApJ, 736, 92