Competing Magnetic Fluctuations in Iron Pnictide Superconductors: Role of Ferromagnetic Spin Correlations Revealed by NMR
Abstract
In the iron pnictide superconductors, theoretical calculations have consistently shown enhancements of the static magnetic susceptibility at both the stripe-type antiferromagnetic (AFM) and in-plane ferromagnetic (FM) wavevectors. However, the possible existence of FM fluctuations has not yet been examined from a microscopic point of view. Here, using 75As NMR data, we provide clear evidence for the existence of FM spin correlations in both the hole- and electron-doped BaFe2As2 families of iron-pnictide superconductors. These FM fluctuations appear to compete with superconductivity and are thus a crucial ingredient to understanding the variability of and the shape of the superconducting dome in these and other iron-pnictide families.
pacs:
74.70.Xa, 76.60.-k, 75.40.GbThe role of magnetic fluctuations in iron pnictide superconductors (SCs) has been extensively studied since their discovery. As the parent materials have antiferromagnetic (AFM) ground states, attention has been understandably focused on stripe-type AFM fluctuations, which are widely believed to give rise to the Cooper pairing in these systems. In the standard picture, carrier doping or pressure application results in suppression of the AFM order and the emergence of a SC state, with ranging from a few K to 56 K Johnston2010 . However, as of yet, there is no accepted theory for in these materials with which to explain the large variability in maximum between different iron arsenide families and the different shapes of the SC dome with electron and hole doping.
Recent nuclear magnetic resonance (NMR) measurements on non-SC, paramagnetic (PM) SrCo2As2, the member of the electron-doped Sr(Fe1-xCox)2As2 family, revealed strong ferromagnetic (FM) spin fluctuations in the Co layer coexisting with stripe-type AFM fluctuations Wiecki2015 ; Jayasekara2013 . Since stripe-type AFM fluctuations are a key ingredient to SC in the iron pnictides, this result suggested that FM fluctuations might compete with the stripe-type AFM fluctuations, suppressing SC in SrCo2As2. FM correlations were also observed in isostructural BaCo2As2 Wiecki2015 ; Ahilan2014 . Similarly, CaCo1.86As2 has an A-type AFM ground state with in-plane FM order Quirinale2013 . These results also raise the question of whether similar FM correlations exist generally in the SC (Fe1-xCox)2As2 compounds, not just at the edges of their phase diagrams.
According to density functional theory calculations Singh2008 ; Mazin2008 ; Dong2008 ; Yaresko2009 ; Neupane2011 , the generalized static magnetic susceptibility is enhanced at both the FM and stripe-type AFM wavevectors in all the iron-based SCs and parent compounds. Experimentally, the uniform of the parent compounds is enhanced by a factor of order five over band structure values, which is consistent with FM correlations Johnston2010 . Nevertheless, FM fluctuations have not been investigated microscopically, perhaps because low-energy FM fluctuations are difficult to observe via inelastic neutron scattering (INS). The peak in the inelastic structure factor at coincides with the elastic Bragg diffraction peaks, and the energy scale of thermal neutrons is relatively high. The study of low-energy FM fluctuations therefore requires cold, polarized neutrons. NMR, in contrast, is a microscopic probe uniquely sensitive to low-energy FM fluctuations via the modified Korringa ratio.
In this Letter, using 75As NMR measurements, we present clear evidence for FM fluctuations in the tetragonal, PM phase of both the hole- and electron-doped BaFe2As2 families of iron pnictide SCs. Furthermore, we suggest that these FM fluctuations compete with SC, and that this competition between FM and AFM fluctuations may be a key ingredient to a theory of in the iron pnictides.
For this study, we chose ( K and K) and ( K and K) in single-crystalline Ba(Fe1-xCox)2As2 as representative superconducting samples in which to look for FM correlations. We also used our existing data on BaCo2As2, reported elsewhere Anand2014 ; Wiecki2015 and other data from the literature. The 75As NMR shift and spin-lattice relaxation rates were measured under magnetic fields parallel to the axis () and to the plane ().
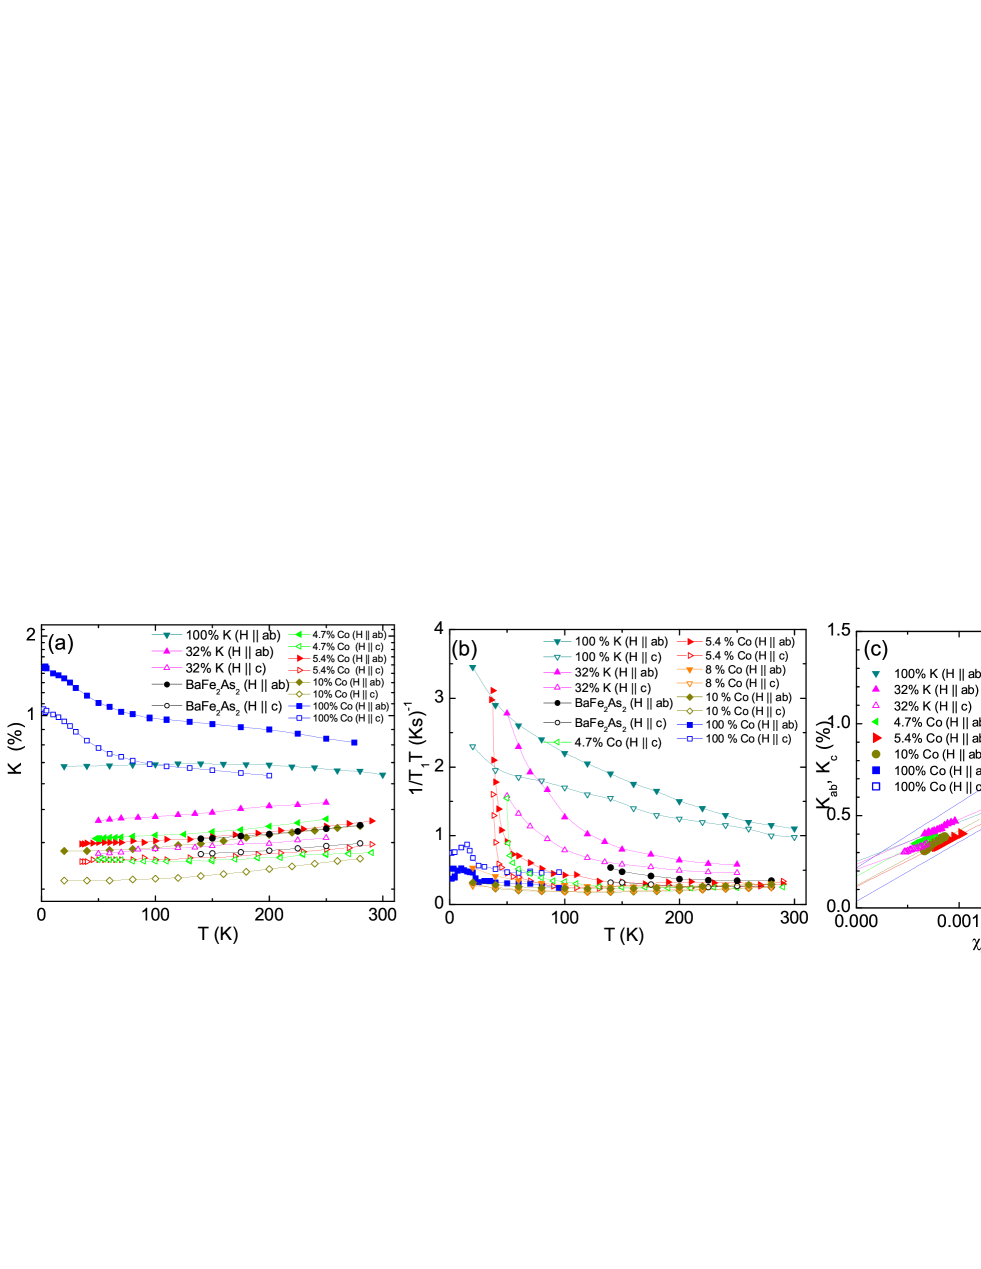
Figures 1(a) and 1(b) show the existing NMR data ( dependence of NMR shift and , respectively) for both the electron-doped Ba(Fe1-xCox)2As2 and hole-doped Ba1-xKxFe2As2 families of iron-pnictide SCs. The NMR shift consists of a -independent orbital shift and a -dependent spin shift due to the uniform magnetic spin susceptibility . The NMR shift can therefore be expressed as , where is Avogadro’s number, and is the hyperfine coupling, usually expressed in units of kOe. In order to extract , we plot against the corresponding bulk static uniform magnetic susceptibility with as shown in Fig. 1(c). From the -intercept of the linear fit curve we can estimate the orbital shift , and extract needed for the following Korringa ratio analysis.
To extract the character of spin fluctuations in the iron pnictides from 75As NMR data, we employ a modified Korringa ratio analysis. Within a Fermi liquid picture, both and are determined primarily by the density of states at the Fermi energy , leading to the Korringa relation = . For the 75As nucleus ( MHz/T), Ks. Deviations from , which are conveniently expressed via the Korringa ratio , can reveal information about electron correlations in the material Moriya1963 ; Narath1968 . For uncorrelated electrons, we have . However, enhancement of increases but has little or no effect on , which probes only the uniform . Thus for AFM correlations. In contrast, for FM correlations. The Korringa ratio , then, reveals whether the magnetic correlations in the material have predominantly FM or AFM character.
To perform the Korringa ratio analysis, one needs to take the anisotropy of and into consideration. The probes hyperfine field fluctuations at the NMR Larmor frequency, , perpendicular to the external magnetic field according to , where are mutually orthogonal directions and represents the power spectral density of the -th component of the hyperfine magnetic field at the nuclear site. Thus, defining , which is appropriate for the tetragonal PM state, we have . The Korringa parameter will then characterize fluctuations in the -plane component of the hyperfine field. By analogy, we should pair with , so that the Korringa parameter characterizes fluctuations in the -axis component of the hyperfine field. Since , we estimate the quantity from .
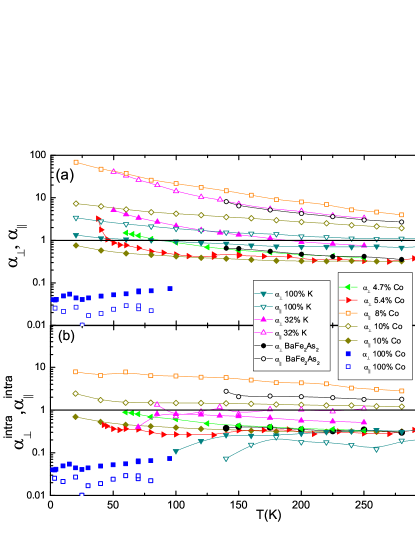
The dependences of the Korringa ratios and are shown in Fig. 2(a). In BaCo2As2, both and are nearly independent of and much less than 1, consistent with FM correlations. For the remaining samples, is generally greater than 1 indicating AFM correlations throughout the range. In addition, both and increase as is lowered, showing the growth of AFM spin fluctuations at low . In contrast, we find that for the parent and Co-doped samples in the high- PM phase. The hole-doped Ba1-xKxFe2As2 also display in the PM phase, suggesting FM correlations, although less strong than in the Co-doped samples.
Careful consideration is required to interpret the value of the Korringa ratio. In comparing the value to the crossover between dominant FM and AFM fluctuations, one is assuming a simple model in which the nuclear relaxation is due to the local at the As sites through on-site hyperfine interactions, where As- bands hybridize with Fe- bands Kitagawa2008 . If, on the other hand, the nuclear relaxation is induced only by the localized Fe spins through isotropic transferred hyperfine interactions, the value of would instead be compared to the crossover , assuming no contributions to 1/ from AFM correlations due to form factor effects Millis1990 ; Jeglic2010 ; Lang2008 . In the highly overdoped Ba(Fe1-xCox)2As2, however, AFM fluctuations are known to be absent from INS measurements Matan2010 . Accordingly, Refs. Johnston2010, and Ning2010, find , suggesting weak correlation. If the crossover were , this value of 1.2 for the Korringa ratio must be associated with dominant AFM fluctuations, in conflict with observations. These results suggest that the factor of 4 change to proposed by Ref. Jeglic2010 for iron pnictides is too large. In fact, the FM correlations have been also pointed out in (La0.87Ca0.13)FePO with = 0.37 by 31P NMR Nakai2008 . In addition, in the case of NaxCoO2 for 0.65, FM correlations are known to be present Lang2008 and the measured Korringa ratio takes the value 0.3 Alloul2008 . It is also noted that the Wilson ratio for BaFe2As2 is mildly enhanced ( 3) Sefat2009 , consistent with FM correlations. Thus we conclude that value we observe, , can be reasonably attributed to FM fluctuations.
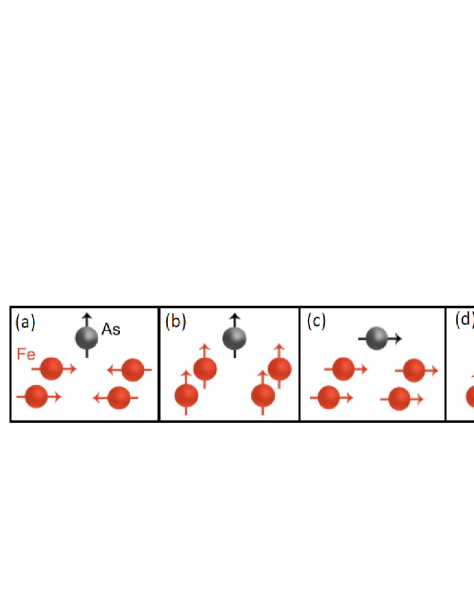
To discuss the magnetic correlations based on the values of and in the iron pnictides in more detail, it is helpful to consider the hyperfine field at the 75As site, which is determined by the spin moments on the Fe sites through the hyperfine coupling tensor Hirano2012 . In this case, there are two sources of hyperfine field pointing along the axis Kitagawa2008 : stripe-type AFM fluctuations at with the spins pointing within the plane [as illustrated in Fig. 3(a)] or FM fluctuations at with the spins pointing along the axis [Fig. 3(b)]. Similarly, hyperfine field fluctuations in the plane can result from FM fluctuations at with the spins pointing within the plane [Fig. 3(c)], or from AFM fluctuations at with the spins pointing along the axis [Fig. 3(d)]. Thus, the value of reflects the competition between (a)- and (b)-type correlations: type (a) AFM correlations will increase above 1, while type (b) FM correlations will lower below 1. Similarly, reflects the competition between (c)- and (d)-type correlations: type (d) AFM correlations will increase , while type (c) FM correlations will lower . In what follows, we will refer to the correlations depicted in Fig. 3(a) as “type (a)” correlations (similarly for the others). Since reflects the character of the -axis component hyperfine field fluctuations, the AFM value of in Fig. 2 can be attributed to type (a) correlations, i.e., stripe-type AFM correlations with the Fe spins in-plane. These must dominate type (b) fluctuations in order to have an AFM value of . Similarly, since reflects the character of the -plane component of hyperfine field fluctuations, the FM value of in the high- region can be attributed to type (c) in-plane FM fluctuations. On the other hand, the increase of as the temperature is lowered reflects the increasing dominance of type (d) stripe-type AFM correlations with a -axis component to the spin. This clearly indicates the simultaneous coexistence of FM and AFM fluctuations. Furthermore, the dominance of type (a) and (c) spin fluctuations in the high- region suggests that both the AFM and FM fluctuations are highly anisotropic in the iron pnictides, favoring the plane.
Finally it is interesting to isolate the FM fluctuations and extract their dependence. We adopt the simple phenomenological model of Refs. Ning2010 ; Ahilan2009 ; Nakai2013 to decompose 1/ into inter- and intraband components according to . The dependence of the interband term is assumed to follow the Curie-Weiss form appropriate for 2D AFM fluctuations: . For the Co-doped samples, we use , while for the K-doped samples we simply use const, as in Ref. Hirano2012, . The Curie-Weiss parameter measures the strength of AFM fluctuations, and corresponds to the distance in from the AFM instability point. Here, we decompose the quantities and into their inter- and intraband components. Our results for the CW parameters , and , shown in Fig. 4, are consistent with the results of Refs. Hirano2012, and Ning2010, . Similar carrier doping dependence of is reported in P-doped BaFe2As2 Nakai2010_2 and in LaFeAsO1-xFx Oka2012 . We use the intraband components to calculate the Korringa ratios and . The results are shown in Fig. 2(b). Both and remain roughly constant through the range. The deviations at low are due to imperfect subtraction of the interband part, arising from our simplistic Curie-Weiss fitting. We notice that for several compounds are greater than 1, suggesting AFM correlations in the intraband component. On the other hand, the value of is consistent with FM fluctuations, as discussed above, for all samples.
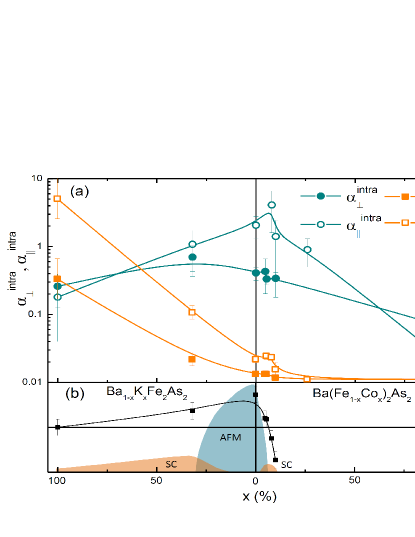
What then is the role of these FM fluctuations in the iron pnictide superconductors? In Fig. 4, we summarize our results across the combined hole- and electron-doped phase diagram of BaFe2As2. First of all, is always greater than in the entire phase diagram, indicating that type (a) spin fluctuations are stronger than type (d) spin fluctuations. On the electron-doped side, AFM spin fluctuations die out beyond the SC dome at Matan2010 . In contrast, the AFM spin fluctuations become very strong on the hole-doped side relative to the electron-doped side. The doping dependences of and are reminiscent of the doping dependence of the mass enhancement Medici2014 . For a measure of the strength of the FM fluctuations, we plot in Fig. 4(a) the average values of and above 150 K except for BaCo2As2 where we average over all data. We find that has a FM value throughout the phase diagram, consistent with in-plane FM [type (c)] spin fluctuations. In contrast, shows an AFM value at 8 Co doping, but exhibits a dramatic decrease towards FM values when hole doped or electron doped beyond 8. The FM fluctuations are thus strongest at the maximally-doped edges of the phase diagram. The disappearance of AFM spin fluctuations beyond 15 Co doping coincides with the appearance of FM fluctuations, suggesting a competition between FM and AFM fluctuations. On the hole-doped side, AFM correlations clearly increase in strength. Paradoxically, this increase in strength of AFM correlations is accompanied by a decrease of , as noted in Ref. Hardy2013, . Our analysis offers a possible explanation. FM correlations also increase in strength on the hole-doped side, as seen from the rapidly decreasing values of and and the increasing value of the NMR shift [Fig. 1(a)] with increasing hole doping. We suggest that the growth of competing FM correlations results in the reduction of despite the increase in AFM correlation strength. In KFe2As2, then, FM and AFM correlations coexist with neither dominating the other, leading to the Korringa parameters and that we observe in Fig. 2(a). Finally, it is noted that structural parameters have been pointed out to play an important role for controlling the ground state of iron pnictides Kimber2009 . Although we discussed our NMR data based on the well-known phase diagram where the tuning parameter is carrier doping, the observed trends should not be attributed to carrier concentration alone.
In conclusion, using an anisotropic modified Korringa ratio analysis on 75As NMR data, we have provided clear evidence for the existence of FM spin correlations in both hole- and electron-doped BaFe2As2. The FM fluctuations are strongest in the maximally-doped BaCo2As2 and KFe2As2, but are still present in the BaFe2As2 parent compound, consistent with its enhanced Johnston2010 . While we consider here only the Ba122 system, similar results are found for other iron-pnictide based superconductors. In particular, FM values of were also observed in the PM phase of LaO0.9F0.1FeAs () Grafe2008 , K0.8Fe2Se2 () Kotegawa2011 and Ca(Fe1-xCox)2As2 Cui . These FM fluctuations appear to compete with superconductivity and are thus a crucial ingredient to understand the variability of and the shape of the SC dome. Our results indicate that theoretical microscopic models should include FM correlations to capture the phenomenology of the iron pnictides. Polarized INS experiments examining magnetic response at the FM wavevector will be needed to further understand the interplay between FM and AFM spin correlations in the iron pnictides.
The authors would like to acknowledge N. Ni for working on growth and basic characterization of the Co-substituted samples. The research was supported by the U.S. Department of Energy, Office of Basic Energy Sciences, Division of Materials Sciences and Engineering. Ames Laboratory is operated for the U.S. Department of Energy by Iowa State University under Contract No. DE-AC02-07CH11358.
References
- (1) D. C. Johnston, Adv. Phys. 59, 803 (2010).
- (2) P. Wiecki, V. Ogloblichev, A. Pandey, D. C. Johnston, and Y. Furukawa, Phys. Rev. B 91, 220406(R) (2015).
- (3) W. Jayasekara, Y. Lee, A. Pandey, G. S. Tucker, A. Sapkota, J. Lamsal, S. Calder, D. L. Abernathy, J. L. Niedziela, B. N. Harmon, A. Kreyssig, D. Vaknin, D. C. Johnston, A. I. Goldman, and R. J. McQueeney, Phys. Rev. Lett. 111, 157001 (2013).
- (4) K. Ahilan, T. Imai, A. S. Sefat, and F. L. Ning, Phys. Rev. B 90, 014520 (2014).
- (5) D. G. Quirinale, V. K. Anand, M. G. Kim, A. Pandey, A. Huq, P. W. Stephens, T. W. Heitmann, A. Kreyssig, R. J. McQueeney, D. C. Johnston, and A. I. Goldman, Phys. Rev. B 88, 174420 (2013), and cited references.
- (6) D. J. Singh and M. H. Du, Phys. Rev. Lett. 100, 237003 (2008).
- (7) I. I. Mazin, D. J. Singh, M. D. Johannes, and M. H. Du, Phys. Rev. Lett. 101, 057003 (2008).
- (8) J. Dong, H. J. Zhang, G. Xu, Z. Li, G. Li, W. Z. Hu, D. Wu, G. F. Chen, X. Dai, J. L. Luo, Z. Fang, and N. L. Wang, Europhys. Lett. 83, 27006 (2008).
- (9) A. N. Yaresko, G.-Q. Liu, V. N. Antonov, and O. K. Andersen, Phys. Rev. B 79, 144421 (2009).
- (10) M. Neupane, P. Richard, Y.-M. Xu, K. Nakayama, T. Sato, T. Takahashi, A. V. Federov, G. Xu, X. Dai, Z. Fang, Z. Wang, G.-F. Chen, N.-L. Wang, H.-H. Wen, and H. Ding, Phys. Rev. B 83, 094522 (2011).
- (11) V. K. Anand, D. G. Quirinale, Y. Lee, B. N. Harmon, Y. Furukawa, V. V. Ogloblichev, A. Huq, D. L. Abernathy, P. W. Stephens, R. J. McQueeney, A. Kreyssig, A. I. Goldman, and D. C. Johnston, Phys. Rev. B 90, 064517 (2014).
- (12) T. Moriya, J. Phys. Soc. Jpn. 18, 516 (1963).
- (13) A. Narath and H. T. Weaver, Phys. Rev. 175, 378 (1968).
- (14) K. Kitagawa, N. Katayama, K. Ohgushi, M. Yoshida, and M. Takigawa, J. Phys. Soc. Jpn. 77, 114709 (2008).
- (15) A. J. Millis, H. Monien, and D. Pines, Phys. Rev. B 42, 167 (1990).
- (16) P. Jeglič, A. Potočnik, M. Klanjšek, M. Bobnar, M. Jagodič, K. Koch, H. Rosner, S. Margadonna, B. Lv, A. M. Guloy, and D. Arčon, Phys. Rev. B 81, 140511(R) (2010).
- (17) G. Lang, J. Bobroff, H. Alloul, G. Collin, and N. Blanchard, Phys. Rev. B 78, 155116 (2008).
- (18) K. Matan, S. Ibuka, R. Morinaga, S. Chi, J. W. Lynn, A. D. Christianson, M. D. Lumsden, and T. J. Sato, Phys. Rev. B 82, 054515 (2010).
- (19) Y. Nakai, K. Ishida, Y. Kamihara, M. Hirano, and H. Hosono, Phys. Rev. Lett. 101, 077006 (2008).
- (20) H. Alloul, I. R. Mukhamedshin, G. Collin, and N. Blanchard, Europhys. Lett. 82, 17002 (2008).
- (21) A. S. Sefat, D. J. Singh, L. H. VanBebber, Y. Mozharivskyj, M. A. McGuire, R. Jin, B. C. Sales, V. Keppens, and D. Mandrus, Phys. Rev. B 79, 224524 (2009).
- (22) M. Hirano, Y. Yamada, T. Saito, R. Nagashima, T. Konishi, T. Toriyama, Y. Ohta, H. Fukazawa, Y. Kohori, Y. Furukawa, K. Kihou, C. Lee, A. Iyo, and H. Eisaki, J. Phys. Soc. Jpn. 81, 054704 (2012).
- (23) F. L. Ning, K. Ahilan, T. Imai, A. S. Sefat, M. A. McGuire, B. C. Sales, D. Mandrus, P. Cheng, B. Shen and H.-H Wen, Phys. Rev. Lett. 104, 037001 (2010).
- (24) K. Ahilan, F. L. Ning, T. Imai, A. S. Sefat, M. A. McGuire, B. C. Sales, D. Mandrus, P. Cheng, B. Shen, and H. H. Wen, Physica C: Supercond. 470, S273 (2010).
- (25) Y. Nakai, T. Iye, S. Kitagawa, K. Ishida, S. Kasahara, T. Shibauchi, Y. Matsuda, H. Ikeda, and T. Terashima, Phys. Rev. B 87, 174507 (2013).
- (26) Y. Nakai, T. Iye, S. Kitagawa, K. Ishida, H. Ikeda, S. Kasahara, H. Shishido, T. Shibauchi, Y. Matsuda, and T. Terashima, Phys. Rev. Lett. 105, 107003 (2010).
- (27) T. Oka, Z. Li, S. Kawasaki, G. F. Chen, N. L. Wang, and G.-q. Zheng, Phys. Rev. Lett. 108, 047001 (2012).
- (28) L. de’ Medici, G. Giovannetti, and M. Capone, Phys. Rev. Lett. 112, 177001 (2014).
- (29) F. Hardy, A. E. Böhmer, D. Aoki, P. Burger, T. Wolf, P. Schweiss, R. Heid, P. Adelmann, Y. X. Yao, G. Kotliar, J. Schmalian, and C. Meingast, Phys. Rev. Lett. 111, 027002 (2013).
- (30) S. A. J. Kimber, A. Kreyssig, Y-Z. Zhang, H. O. Jeschke, R. Valenti, F. Yokaichiya, E. Colombier, J. Yan, T. C. Hansen, T. Chatterji, R. J. McQueeney, P. C. Canfield, A. I. Goldman, and D. N. Argyriou, Nat. Mater. 8, 471 (2009).
- (31) H.-J. Grafe, D. Paar, G. Lang, N. J. Curro, G. Behr, J. Werner, J. Hamann-Borrero, C. Hess, N. Leps, R. Klingeler, and B. Büchner, Phys. Rev. Lett. 101, 047003 (2008).
- (32) H. Kotegawa, Y. Hara, H. Nohara, H. Tou, Y. Mizuguchi, H. Takeya, and Y. Takano, J. Phys. Soc. Jpn. 80, 043708 (2011).
- (33) J. Cui, S. L. Bud’ko, P. C. Canfield, and Y. Furukawa (unpublished).
- (34) F. L. Ning, K. Ahilan, T. Imai, A. S. Sefat, R. Jin, M. A. McGuire, B. C. Sales, and D. Mandrus, J. Phys. Soc. Jpn. 78, 013711 (2009).
- (35) F. L. Ning, K. Ahilan, T. Imai, A. S. Sefat, R. Jin, M. A. McGuire, B. C. Sales, and D. Mandrus, J. Phys. Soc. Jpn. 77, 103705 (2008).
- (36) N. Ni, M. E. Tillman, J.-Q. Yan, A. Kracher, S. T. Hannahs, S. L. Bud’ko, and P. C. Canfield, Phys. Rev. B 78, 214515 (2008).
- (37) A. S. Sefat, R. Jin, M. A. McGuire, B. C. Sales, D. J. Singh, and D. Mandrus, Phys. Rev. Lett. 101, 117004 (2008).
- (38) Y. Liu and T. A. Lograsso, Phys. Rev. B 90, 224508 (2014).
- (39) For the point at , we used the data from Ref. Ning2010, with , and approximated as data were not available.