Black Hole Starvation and Bulge Evolution in a Milky Way-like Galaxy
Abstract
We present a new zoom-in hydrodynamical simulation, “ErisBH ” which follows the cosmological evolution and feedback effects of a supermassive black hole at the center of a Milky Way-type galaxy. ErisBH shares the same initial conditions, resolution, recipes of gas cooling, star formation and feedback, as the close Milky Way-analog “Eris”, but it also includes prescriptions for the formation, growth and feedback of supermassive black holes. The aim of this simulation is to study the evolution of supermassive black holes and AGN feedback effects in a late-type galaxy. We find that the galaxy’s central black hole grows mainly through mergers with other black holes coming from infalling satellite galaxies. The growth by gas accretion is minimal because very little gas reaches the sub-kiloparsec scales, possibly a reflection of the fact that spiral galaxies have a long period of quiescent evolution in which their potential is only weakly perturbed by external triggers. The final black hole is, at , about 2.6 million solar masses and it sits closely to the position of SgrA* on the and planes, in a location consistent with what observed for pseudobulges. Given the limited growth due to gas accretion, we argue that the mass of the central black hole should be above already at . The effect of AGN feedback on the host galaxy is limited to the very central few hundreds of parsecs. Despite being weak, AGN feedback seems to be responsible for the limited growth of the central bulge with respect to the original Eris, which results in a significantly flatter rotation curve in the inner few kiloparsecs. Moreover, the disk of ErisBH is more prone to instabilities, as its bulge is smaller and its disk larger then Eris. As a result, the disk of ErisBH undergoes a stronger dynamical evolution relative to Eris and around a weak bar grows into a strong bar of a few disk scale lengths in size. The bar triggers a burst of star formation in the inner few hundred parsecs, provides a modest amount of new fuel to the central black hole, and causes the bulge of ErisBH to have, by , a box/peanut morphology.
keywords:
Galaxy: bulge - Galaxy: center - galaxies: active - galaxies: formation - quasars: supermassive black holes - methods: numerical1 Introduction
Present in nearly all spheroids (e.g., Kormendy, 2004), and being the engines powering active galactic nuclei (AGN), supermassive black holes (simply black holes, from here onwards) seem to be an integral component of massive spheroidal galaxies. The tight relations between black hole mass and several properties of the host spheroid (e.g., Magorrian et al., 1998; Merritt & Ferrarese, 2001; Tremaine et al., 2002; Häring & Rix, 2004) give further hints that the life of black holes and their hosts are closely linked. Starting from the first analytical works on black hole “self-regulation” (Silk & Rees, 1998; King, 2003), a considerable amount of effort has been spent in the last two decades in understanding the role of black hole feedback in shaping the properties of the host galaxy and controlling its own growth. Significant advance has been made by including the physics of black hole accretion and feedback (even if limited to sub-grid models) into simulations of galaxy evolution. For example, Di Matteo et al. (2005) and Springel et al. (2005a) studied the effects of black hole (thermal) feedback during the merger of blue spiral galaxies, and found that AGN feedback has a primary role in the color transformation of the host galaxy, by quenching star formation and causing the elliptical merger remnant to redden in a short timescale. The combination of these results and the evidence of scaling relations between black hole mass and bulge properties, hint at the idea that is during violent, major merger events when black holes acquire most of their mass while elliptical galaxies form (e.g., Hopkins et al., 2006). On larger scales, mechanical AGN feedback in the form of jets and bubbles seems to halt cooling flows in galaxy clusters (e.g., Churazov et al., 2002; Sijacki & Springel, 2006). While black hole growth and the effects of AGN feedback have been extensively explored in the case of massive early-type galaxies in clusters (e.g., Martizzi et al., 2012; Dubois et al., 2013; Martizzi et al., 2014), the role black holes have played in the evolution of blue late-type galaxies evolving in smaller haloes is still largely unexplored. The small interest the community has devoted to the interplay between black holes and spiral galaxies is primarily due to the fact that late-type galaxies have small bulges and small black holes. Also, their active star formation suggests that no quenching is present in those galaxies, and thus AGN feedback is not significant.
In the effort of simulating the evolution of disk galaxies, a lot of attention has been instead given to stellar feedback. Obtaining realistic late-type galaxies has been a historical challenge for computational astrophysics since the first simulations run in the early nineties. Navarro & Benz (1991) found that the baryonic component of galaxies evolving in hierarchically growing haloes was not able to retain enough angular momentum to feature a cold disk and flat rotation curves as in realistic spirals. Those authors suggested that a proper treatment of supernova feedback (or some other form of heating) at early times would be necessary to prevent gas to lose angular momentum and catastrophically cool during galaxy interactions. Since these first simulations, our understanding of the formation of spiral galaxy has evolved significantly and, in the last few years, a large number of works from different groups has shown that proper resolution and an accurate treatment of star formation and stellar feedback are the key ingredients for creating realistic late-type galaxies (e.g., Guedes et al., 2011; Brook et al., 2011; Aumer et al., 2013; Okamoto, 2013; Roškar et al., 2014; Marinacci et al., 2014; Agertz & Kravtsov, 2015; Murante et al., 2015). For further details on this topic, we refer the reader to the early review of Mayer et al. (2008), the large code-comparison work of Scannapieco (2012) and the summary of all most recent developments given in section 2 of Murante et al. (2015). We discuss here only the work of Guedes et al. (2011), as that is the starting point of the new simulation presented in this paper. Guedes et al. (2011) performed a zoom-in cosmological hydro simulation of a Milky Way-size halo with a rather quiet merger history. They found that the combination of high spatial resolution (gravitational softening of ) and the use of a high-density threshold for star formation (as first used by Governato et al., 2010) and of blast-wave feedback (as in Stinson et al., 2006), contribute to the development of a clumpy and inhomogeneous interstellar medium, where overlapping SN explosions are able to inject enough energy to remove low-angular momentum material. The simulation of Guedes et al. (2011), dubbed “Eris”, is one of the first successful efforts to produce a realistic late-type spiral in a cosmological simulation.
With the new simulation that we present in this paper, “ErisBH ”, we want to examine directly the role of AGN feedback in the evolution of late-type galaxies and explore what could be the origin and cosmological evolution of the black holes that these galaxies host. We do so by adding sub-grid physics for the growth and feedback of supermassive black holes to the physics already simulated in Eris. The paper is organized as follows. Section 2 offers a brief summary of the Eris simulation and describes the technical aspects of ErisBH . In Section 3 we show the evolution of the black holes in the simulation, focusing in particular on the central black hole of the main galaxy of the simulation. In Section 4 we show how, and to which extent, AGN feedback influences the host galaxy, by making a direct comparison between the physical properties of ErisBH and those of Eris. Finally, in Section 5 we summarize of our results.
2 The simulation
We describe here the technical aspects of the simulation. The initial conditions and the physical processes included in the simulation are the same as the ones of Eris, which are described in Section 2.1. In addition, this new simulation also includes assumptions for the formation of massive black holes and follows their growth as described in Section 2.2.
2.1 Eris
Eris is a cosmological zoom-in -body/smooth particle hydrodynamic (SPH) simulation that follows the evolution of a Milky Way-size halo from down to , in a Wilkinson Microwave Anisotropy Probe three-year cosmology (Spergel et al., 2007), with a flat universe with , , , and . It was run with the parallel, spatially and temporally adaptive, treeSPH-code GASOLINE (Wadsley et al., 2004) for 1.5 million cpu hours. The halo was selected from the output of a low-resolution and dark matter-only simulation of a volume; it was chosen to have approximately the estimated size of the Milky Way halo111The virial mass if Eris at is , and the virial radius , as given by the halo finder AMIGA (Gill et al., 2004; Knollmann & Knebe, 2009). and to have had a rather quiet merger history, with no major mergers (above the ratio of ) after . The dark matter and the (initial) gas particle masses of the high-resolution region of Eris are and . The gravitational softening length was fixed to physical from to the present, and evolved as from to the starting redshift (). In brief (for further technical details, see Guedes et al., 2011), the simulation includes Compton cooling, atomic cooling, metallicity-dependent radiative cooling at low temperatures and uniform UV background. Star formation and stellar feedback are regulated by the star formation threshold (set to a value of ), the star formation efficiency (set to ) and the fraction of of supernova energy that couples to the interstellar medium (set to ). When the conditions of the gas become favourable to star formation (according to the Schmidt law), new star particles are created following the Kroupa (2001) initial mass function, with a starting mass (the gas particle from which the star is created has its mass reduced by the same amount). Supernova explosions imply a deposition of metals and energy () to the nearest neighbour gas particles. The affected gas has its cooling shut off until the end of the supernova blastwave, as in Stinson et al. (2006). Winds and stellar mass loss are also modelled as in Stinson et al. (2006).
As discussed in (Guedes et al., 2011), a high value for the density threshold for star formation parameter was possible thanks to the high mass and spatial resolutions of the simulation, which allow to resolve the clouds where star formation occurs. With this choice, star formation takes place in confined regions, giving rise to a clumpy, inhomogeneous interstellar medium, where overlapping supernova explosions inject energy in a localized manner. This localized energy injection is able to create galactic outflows which expel low-angular momentum material.
The formation of a clumpy and inhomogeneous medium seems to be the key ingredient to form a realistic late-type spiral. As described in (Guedes et al., 2011), in fact, Eris is consistent with a large number of observational aspects of the Milky Way, from its structural properties to the mass content of its different components. Just to give few examples, it has a flat rotation curve, a low photometric bulge-to-disc (B/D) ratio, it falls on the Tully-Fisher and stellar-mass/halo-mass relation and it has a baryonic mass fraction within the virial radius which is lower than the cosmic value.
| z - seed | atom/cc | |||||
|---|---|---|---|---|---|---|
2.2 ErisBH : Eris plus black hole formation, growth and feedback
ErisBH is a replica of Eris, but with additional prescriptions for the seeding and growth of supermassive black holes, and thermal feedback during gas accretion.
2.2.1 Seeding procedure
The origin of black hole seeds is still largely a mystery and subject of intense theoretical investigation (see, e.g., the review of Volonteri & Bellovary, 2012). Thus, the criteria for inserting black hole seeds in a cosmological simulation is somewhat arbitrary. Di Matteo et al. (2008) and Booth & Schaye (2009), for example, have chosen to insert a seed black hole in every dark matter halo that rises above a given threshold in mass. Bellovary et al. (2010), instead, chose to connect the formation of black holes to star formation: gas particles with zero metallicity and with density above the set threshold for star formation, have a certain probability to be transformed into black holes rather than stars, where this probability parameter is tuned to reproduce the black hole seed halo occupation probability at suggested by Volonteri et al. (2008) (which, however, is based on a very specific formation model for black hole seeds). Here, we impose both a requirement on resolution and high-density gas environment for the introduction of new black holes. A seed is inserted in all systems that satisfy the following conditions:
- •
-
•
have at minimum of gas particles with density above .
The resolution criterion is motivated by past works on numerical convergence of angular momentum transport in astrophysical disks simulated by SPH, which have shown that at least particles are needed to keep a number of numerical effects under control, such as spurious hydrodynamical drags as well as enhanced gravitational torques from a noisy halo potential (Kaufmann et al., 2007).
Galaxies that satisfy the conditions listed above are then seeded with a black hole, provided that they do not host one already. This is done by selecting the star particle that is closest to the high-density gas particle with the deepest potential and converting it into a sink particle. The initial black hole mass is set to be proportional to the number of high-density gas particles222specifically, we calculate the number of gas particles that have a density larger than the density of the most dense gas particle in the galaxy. The mass of the black hole seed is then given by times the mass of the converted star particle., so that the higher is the density of the gas, and the larger is the high-density region, the more massive is the newly-formed black hole.
From the beginning of the simulation down to , only six structures raise above the mass (or number of particles) limit that we have imposed. Of those, four satisfy also the condition on the gas density. At lower redshift, the gas densities become generally lower, and we stop looking for possible sites for new black holes seeds.
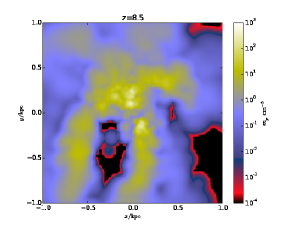
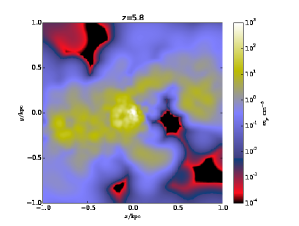
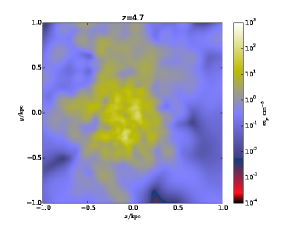
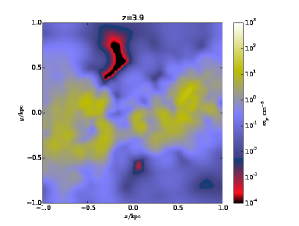
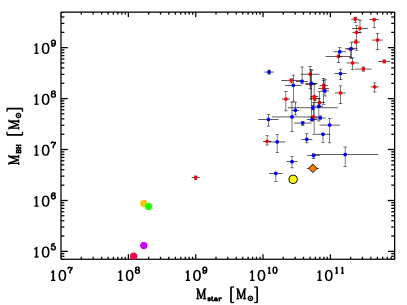
The first system which satisfies the seeding conditions is, at , the progenitor of the main galaxy of the simulation. The other three seeds are inserted in satellite galaxies at lower redshifts. Figure 1 shows maps of the gas density in the regions where new seeds are about to be added to the simulation. Table 1 gives further information on the properties of the systems where black holes are inserted. Given the imposed limit on the number of particles that a protogalaxy needs to have to host a black hole, the masses in gas, star and dark matter do not differ substantially in the four galaxies at the time each black hole is inserted. Seed masses (last column in the table) also do not differ significantly, with about one order of magnitude separating the most to the least massive seed. As a consequence, all black hole seeds are located close to each other on the stellar mass plane, slightly above the extrapolation to lower masses of the relation established by the most massive black holes (see left panel of Figure 7).
2.2.2 Black hole accretion and feedback model
After being inserted into the simulation by converting the appropriate star particle into a sink-type particle, black holes start accreting gas isotropically from the surrounding medium, following the widely used Bondi-Hoyle-Lyttleton formalism (Hoyle & Lyttleton, 1939; Bondi & Hoyle, 1944; Bondi, 1952):
| (1) |
where and are, respectively, the density and sound speed of the gas, is the mass of the black hole, and is the velocity of the black hole relative to the gas. Growth proceeds according to Equation 1, but the maximum allowed accretion rate is set to the Eddington accretion rate (where is the proton mass, is the speed of light, the Thomson cross-section and is the accretion efficiency, assumed to be ), so that:
| (2) |
Feedback from the accreting black hole is modeled by assuming that a fraction of the radiated luminosity333The bolometric radiated luminosity is given by , where is the radiative efficiency. For simplicity, we assume here , which is a good approximation at high accretion rates when black holes are likely growing from geometrically-thin and optically-thick accretion disks (Shakura & Sunyaev, 1973), but it might be an overestimate of the radiative power when accretion rates are highly sub-Eddington (Churazov et al., 2005; Merloni & Heinz, 2008). is converted into thermal energy that heats the gas surrounding the black hole. Initially used by Di Matteo et al. (2005) and Springel et al. (2005b) in their study of the effects of black hole growth and feedback in isolated galaxy mergers, the Bondi-prescription for estimating the growth of massive black hole has been used widely in the community, also in large cosmological volumes (e.g. Di Matteo et al., 2008; Booth & Schaye, 2009) (we discuss the limitation of the Bondi-Hoyle-Lyttleton formalism below in section 3.2). Bellovary et al. (2010) have included this prescription into the GASOLINE code to study “wandering” black holes, that is, black holes that are the remnants of stripped satellite cores. As in Bellovary et al. (2010), black holes are allowed to merge if they are within one another’s softening length and if they fulfill the criterion , where and are the differences in velocity and acceleration of the two black holes, and is the distance between them.
3 Black hole properties
3.1 Black hole growth
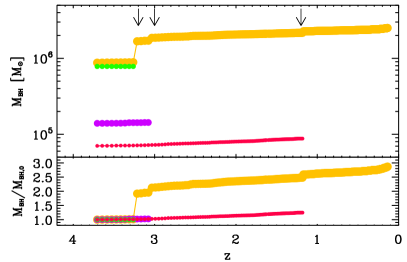
The upper panel of Figure 2 shows the mass evolution of the four black holes in the simulation. Curves stop when the corresponding black hole merges with the black hole of the central galaxy (yellow symbols). The mergers (marked by the arrows) are clearly visible as “jumps” in the yellow track. The lower panel of the figure shows again the growth of the four black holes, this time normalized by the corresponding initial mass. Growth by gas accretion is clearly limited in all black holes. The central black approximately doubles its mass though mergers and, since the time it was seeded into the simulation at , it grows, in total, only by a factor of , reaching a final mass of about million Solar masses. The gas growth we find in our simulation is much more modest compared to the one obtained by Marinacci et al. (2014) in their simulations of eight Milky Way-sized haloes: all black holes hosted by their simulated central galaxies reach final masses around . We argue that the differences in the results are likely primarily due to the different resolutions adopted in our and their simulations: Marinacci et al. (2014) have a gravitational softening of about , while we resolve down to . We argue that the lower resolution of their simulations implies an overestimate of the gas supply available for accretion. In our simulation, for example, the amount of gas inside is around , almost an order of magnitude higher than in the inner .
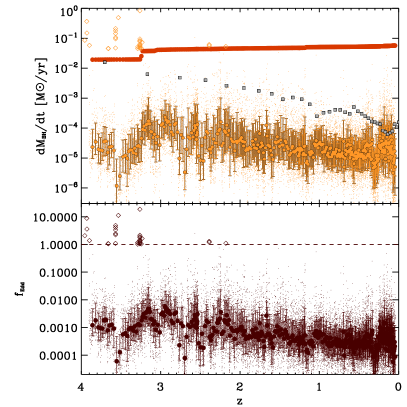
Figure 3 shows the gas accretion rate evolution of the central black hole. The orange points in the upper panel indicate the instantaneous accretion rate, while the orange bullets show the median over several timesteps (the error bars indicate the and percentiles of the distribution). The median accretion rates decrease only gently with redshift, and are typically quite low, , but there are periodic fluctuations and peaks at higher accretion rates. While there is a global gentle decrease in the median accretion rates with decreasing redshift, at the median rate increases again of about an order of magnitude: as we will discuss in the next section, this is approximately the redshift at which the disk of the galaxy is experiencing an instability event that leads to the formation of a strong bar visible in the galaxy at . During the process of bar formation, the gas mass and the star formation increase in the very central few hundred parsecs and the conditions around the black hole also become favourable for an increase of the accretion rate. By , the accretion rate has lowered again to values around .
In the same Figure, the red bullets indicate, for reference, which would be the instantaneous Eddington accretion rate for the black hole. We also explicitly show when the conditions of the gas around the black hole would have given a Bondi accretion rate higher than the Eddington limit (orange diamonds): this happens rarely, and only at high redshift. However, as we do not allow super-Eddington accretion, the accretion rate in those rare cases is set to the Eddington limit.
The bottom panel explicitly shows the evolution of the Eddington ratio (), which is typically between and . Again, the diamonds show the few rare times where the Bondi formula would give accretion rates higher than the Eddington limit. By the Eddington ratio reaches the lowest median values of .
Accretion rates between and are, conservatively, the accretion rates expected from Bondi accretion of hot gas and stellar mass loss in the center of nearby galaxies, as discussed by Ho (2009). At our simulated black hole is accreting close to those values, at , which, assuming a radiative efficiency , corresponds to a bolometric luminosity of . This is close to the median value of nuclear luminosity of local Seyfert galaxies found by Ho (2009). As discussed in Section 2.2.2 however, the radiative efficiency is likely lower than the value we have adopted here, and can be as low as for the accretion rates we have in our simulation at late time. At those low rates, in fact, energy from the accreting black hole is likely released as kinetic, rather than radiative, power (Churazov et al., 2005; Merloni & Heinz, 2008). With significantly lower efficiencies of energy release, the luminosity of the nucleus of ErisBH could be several order of magnitude lower, thus being closer to the luminosities that Ho (2009) find for a large fraction of local galaxies (including the Milky Way444The estimated luminosity of the Galactic center is (see,e.g. Skinner et al., 1987; Pavlinsky et al., 1994; Baganoff et al., 2003) and other references in Narayan et al. (1998).). Had we assumed a lower value for the radiative efficiency for the phases at the lowest Eddinton ratios, the effect of radiative AGN feedback on the galaxy would have been even lower than what we have obtained in our simulation.
In the top panel of Figure 3 we also show the evolution of the star formation rate (multiplied by for plotting purposes, and with values averaged over snapshots, which correspond to about ) in the inner of the galaxy. As the bulge stars dominate approximately the inner of the galaxy at (see section 4.2), and as most bulge stars are formed in-situ (see Guedes et al., 2013), this sfr is a good proxy for the sfr of the stars within the bulge. The black hole accretion rate is between and orders of magnitude smaller than the star formation rate. As expected for a late-type galaxy, the growth rate of the central black hole is thus significantly smaller than the growth rate of the bulge. In section 3.4 we explicitly show how this translate into black hole-galaxy scaling relations.
Given the little gas supply, the value of the initial seed mass is rather important. Generalizing our results, we expect the progenitors of Milky Way-size galaxies to be hosting an intermediate-mass black hole already at . For seeds from PopIII remnants (e.g., Bond et al., 1984; Madau & Rees, 2001; Haiman & Hui, 2001; Tanaka & Haiman, 2009), given the little time available before , uninterrupted growth close to the Eddington rate would be required to reach intermediate masses (unless super-Eddington accretion is possible, see, for example, Wyithe & Loeb, 2012; Madau et al., 2014; Volonteri et al., 2015). An alternative are seeds from direct-collapse, which could be already between and at the time of formation. Given the properties of Milky Way progenitors, direct collapse black holes born in metal-free protogalaxies (e.g., Lodato & Natarajan, 2006; Wise et al., 2008; Regan & Haehnelt, 2009; Johnson et al., 2011; Agarwal et al., 2012; Dijkstra et al., 2014) are a more plausible scenario than the direct collapse black holes formed after galaxy major mergers, as these events are only possible during mergers of much more massive galaxies (Mayer et al., 2010; Bonoli et al., 2014; Mayer et al., 2014).

3.2 A discussion on the Bondi-Hoyle-Lyttleton prescription
As introduced in the methodology section, in this paper we have used a specific model for black hole accretion, the Bondi-Hoyle-Littleton model, which is simple and widely used in the literature of cosmological simulations. At the same time, though, it is known to be often inaccurate for flows in the nuclei of galactic disks, which are neither spherical and hydrodynamical, but are rather governed by the effects of gravitational torques in the redistribution of angular momentum and kinetic energy (e.g., Debattista et al., 2006; Hopkins & Quataert, 2010, 2011). In particular, Hopkins & Quataert (2011) have proposed a different sub-grid model for accretion onto massive black holes in simulations that is based on the analysis of angular momentum transport in galactic disks of stars and gas, where the self-gravitating perturbation destabilizing the axisymmetric gas flow is assumed to be coming from the stellar potential only. The latter is a good approximation in our case since star formation is vigorous in the nucleus at high redshift (see Figure 12), leading to stellar-to-gaseous mass ratio larger than at distances below from the center already at redshift (see Figure 8). Hopkins & Quataert (2011) have shown that their proposed new sub-grid model captures very closely the mass inflow rates at small scales occurring in very high resolution simulations, which resolve down to scales, hence close to the boundary of the accretion disc, while the Bondi model can overestimate by even more than an order of magnitude the inflow rate occurring in simulations at such scales. Since we only resolve gravity to about scales, the size of our gravitational softening length, we can apply their sub-grid model at such scales. According to this model, the mass inflow rate onto the black hole is , where is the gas mass at the smallest scale, is the orbital time at the same distance and is a constant related to the amplitude of gravitational torques, which is maximum in major mergers () and can be as small as in weakly self-gravitating disk. We can apply the model to the high-redshift phase of black hole growth () which is the one yielding, on average, the highest accretion rates (see Figure 3). Assuming a , since most of the time our galaxy does not undergo significant mergers, and taking a few times (corresponding to the values in the original Eris simulation shown in Figure 8) and , a typical value for the inner few hundred parsecs, we obtain . Those values for the accretion rate are higher than the accretion rates measured in the ErisBH simulation, despite it adopts the Bondi model. This is reassuring, since feedback is expected to decrease the accretion rates further, yet there is no evidence that the Bondi model employed is boosting severely the accretion rates. This suggests that in our case the accretion rates are not strongly dependent on the accretion model adopted, but they are rather bound to be low because they arise from the weak gas inflows occurring at the resolved scales, from few to a few softening lengths. This is line with the notion that we are modeling a fairly quiescent halo that does not undergo many prominent mergers, and this seems to naturally lead to the formation of a late-type spiral with a pseudobulge. It also confirms that our general key conclusion that massive black holes in late-type spirals grow little by accretion should be quite general.
3.3 A close look to black hole mergers
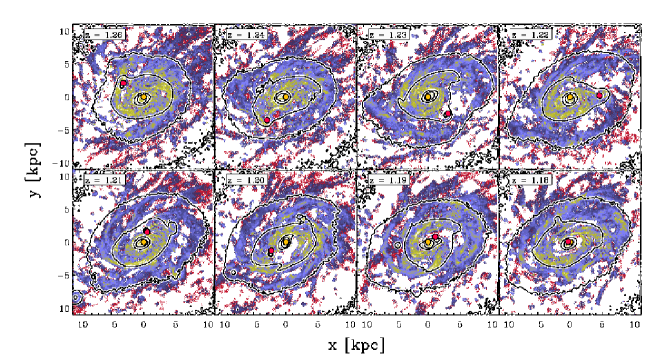
As previously discussed, mergers with black holes from satellite galaxies contribute significantly to the mass-growth budget of the black hole hosted by the central, most massive galaxy of the simulation. The resolution of the simulation allows us to follow the evolution of black hole binaries down to few hundreds of pc. The maps in Figure 4 show the evolution of the last black hole merger in the simulation, occurring at , with gas particles colored according to their density and black lines indicating stellar isodensity contours. At the beginning of the sequence, the stellar core hosting the satellite black hole is still visible in the isodensity contours. When the remnant of the satellite galaxy is finally disrupted, the secondary black hole is dragged to the center of the primary galaxy to eventually merge with the more massive black hole. This sequence spans in the cosmology assumed here.
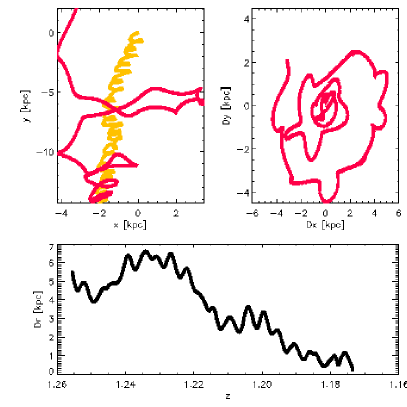
Figure 5 shows quantitatively the position, separation and orbit evolution of the two black holes from several scales down to the softening scale of the simulation. The upper left panel shows the position of the two black holes in the same time interval shown in Figure 4, where the positions have been centered at the location of the primary black hole at the time we start tracking the binary system. While the central black hole (orange curve) wiggles around its original position, the satellite black hole shows a typical spiraling pattern until it finally joins the central black hole. The top-right panel shows instead a projection of the orbit of the satellite black hole around the primary one and, finally, the bottom panel of the same figure shows the redshift evolution of the separation between the two black holes. In about the black holes go from a distance of several to a separation smaller than the spatial resolution of the simulation, at which point they are assumed to merge. Such short timescale for the evolution of the black hole binary system is consistent with the results of high-resolution merger simulations of, e.g., (Mayer et al., 2007; Chapon et al., 2013).
However, we also note that detailed numerical simulations of massive black hole mergers in circumnuclear disks have shown that the formation of a tight binary below our resolution scale of can be delayed to up to in the favourable case of major mergers (Roškar et al., 2015), and to even longer timescales (up to a ) in the case of minor mergers, due to a variety of processes such as ram pressure stripping of the secondary galaxy core surrounding the secondary black hole (Callegari et al., 2009, 2011). In any case, all black hole mergers in our simulation occur at very early times, when dynamical timescales are still very short, possibly explaining that neglecting to capture the small scale dynamics is not an issue. We finally note that, with our resolution, we encounter no problems in following the black hole orbital decay directly down to the scale of the softening length, namely without having to impose an artificial drag force (Tremmel et al., 2015).
3.4 Black hole-galaxy scaling relations
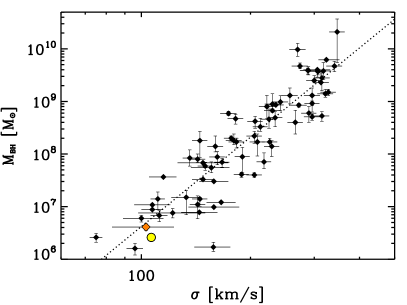
Since their discovery more than 20 years ago (e.g., Magorrian et al., 1998; Merritt & Ferrarese, 2001; Tremaine et al., 2002), the tight relations between black hole mass and various properties of the host galaxies have been interpreted as an evidence of some type of co-evolution between massive black holes and their hosts. Those relations have been first defined for massive bulges or elliptical galaxies, and has not been clear whether they hold when going to low mass galaxies or galaxies with different morphologies. Recent studies (e.g., Greene et al., 2008; Hu, 2008; Kormendy et al., 2011; Jiang et al., 2011; Mathur et al., 2012; Graham & Scott, 2015) have found that black holes in pseudobulges do not correlate in the same way, if at all, with galaxy properties as black holes in classical bulges. Studying active low-mass galaxies, Greene et al. (2008) found, for example, that black holes in pseudobulges sit on the extrapolation to lower masses of the relation, while they lie almost an order of magnitude below the relation. The different behaviour for classical bulges and pseudobulges seems to be due to the different relation between stellar mass and velocity dispersion that they follow (Gadotti & Kauffmann, 2009). Kormendy et al. (2011) studied systems with dynamically-estimated black hole masses, and found evidence that no correlation actually exists between black hole masses and pseudobulges. Those authors argue that this is likely due to the different history of black holes evolving in pseudobulges and the ones in classical bulges: black hole growth in pseudobulges is likely driven by small-scales and stochastic events and is typically highly sub-Eddington, in contrast with the growth of the most massive black holes, which is driven by large scale dramatic events, such as the violent mergers, that are able to both efficiently feed black holes and to generate classical bulges and elliptical galaxies. The bulge of ErisBH has the properties of a pseudobulge rather than a classical bulge (see Section 4.2), similarly to the bulge of Eris, whose evolution has been studied in a dedicated paper by Guedes et al. (2013). We can thus directly see whether our black hole has properties consistent with the ones of black holes in observed pseudobulges.
In Figure 6 is shown where the ErisBH central black hole sits in the relation (yellow bullet), compared with the observational data points compiled by McConnell & Ma (2013). We estimated the velocity dispersion for ErisBH using the of the velocity dispersion within from the center. With this assumption, we obtain a value for of . Our calculation for the velocity dispersion gives values that are quite comparable to observational long-slit measurements of face-on nearby galaxies (Bellovary et al., 2014). The obtained value of is also within the errors on the velocity dispersion of for the Milky Way given in the compilation of McConnell & Ma (2013). We see that ErisBH sits slightly below the relation, as its black hole mass is about the mass of the Milky Way central black hole, assuming that SgrA, as in McConnell & Ma (2013), is (from: Ghez et al., 2008; Gillessen et al., 2009).
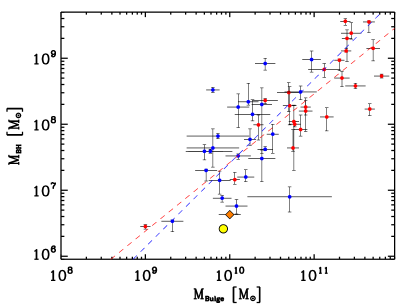
Figure 7 shows instead the scaling relations between black hole mass and stellar mass and between black hole mass and the bulge component of galaxies. Here we use as reference observational points the compilation of Erwin & Gadotti (2012) (red and blue symbols, representing the location of early and late type galaxies respectively). As in the previous figure, the orange diamond represent the location of the Milky Way and the yellow bullet the location of ErisBH . In Section 4.2 we perform a bulge and disc decomposition by fitting a double-Sérsic profile to the surface density profile of our simulated galaxy: integrating the best-fit parameters of the Sérsic profiles, we obtain estimates for the bulge and disk masses (see Table 2). The stellar mass used here is the sum of the bulge and disc derived from the decomposition. ErisBH sits well below the relation, even though the black hole seeds start off close to the extrapolation of the relation at lower masses: this is because the black hole accretion rates are much lower than what would be required to keep up with the star formation rate in the central region (see Figure 3).
Having only one simulation, we can not give quantitative predictions on whether black holes in pseudobulges follow a different relation or do not follow any relation at all with the properties of the host. But we note that the consistency with the relation on one side, and the deviation from the on the other side, are consistent with what is found by Greene et al. (2008), but is also consistent with the picture drawn by Kormendy et al. (2011), given the slow Seyfert-like growth of our simulated black hole.
4 Black hole feedback and its effects on the host galaxy
As described in Section 2.2.2, the simulation includes also a prescription for black hole feedback: a fraction of the energy extracted in the accretion process couples thermally with the surrounding medium. This standard prescription has been used extensively in other works, and its effects led to the idea of a “self-regulation” of black hole growth to explain the origin of the relation and the ejection of gas from the host galaxy and the resulting quenching of star formation (e.g., Di Matteo et al., 2005). Given that the accretion rates are generally quite small for the central black hole of our simulated galaxy, we expect the effects of feedback to be modest. We find, in fact, that the amount of energy released by the black hole is significantly lower than the one released by supernova explosions (integrating from to , the total energy input from supernovae, both of type Ia and II, is more than an order of magnitude higher than the energy input from the central black hole). Despite not playing any dramatic role in shaping the host galaxy, AGN feedback seems, however, to be able to keep hot the very central region of the galaxy, preventing the bulge to grow in the same way as in the original Eris.
To isolate the effects of AGN feedback on the ErisBH galaxy, we compare the properties of its gaseous and stellar components directly with the Eris galaxy, where AGN feedback was ignored in the calculation.
4.1 Gas component
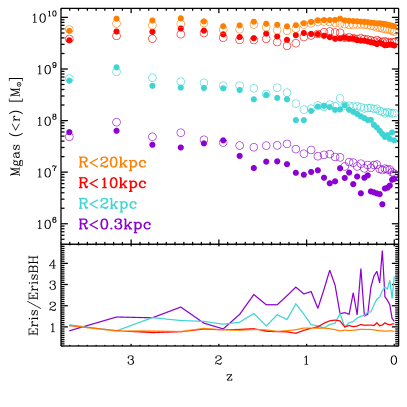
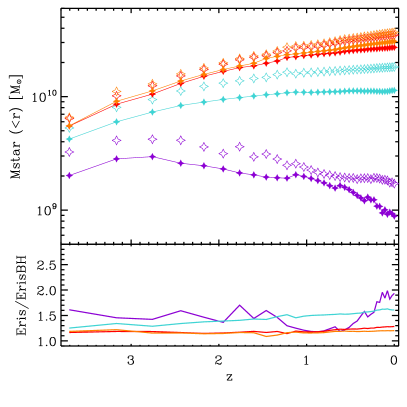
In the left panel of Figure 8 we show the redshift evolution of the total mass in gas of Eris and ErisBH within spheres of different radii from the galaxy center. At high redshift (above ), the gas content of the two simulations is very similar, except in the very inner region (purple curves), where the gas budget of ErisBH is systematically lower than the one of Eris, a consequence of the weak feedback from the slowly growing black hole.
While at large radii the total mass in gas remains very similar in the two simulations down to the present time, in the inner of ErisBH (cyan curves) the amount of gas starts decreasing at low redshift and, by , it is about a third of the one of Eris. The steep decline in gas content at those scales starts around , which is when the strong bar visible in the galaxy at starts forming (see next section); as the bar gets stronger, it “clears” the center of the galaxy of its gas content. An exception is the very central region (the inner few hundred parsecs, purple curves), where the amount of gas slightly increases at those late times; this raise of gas mass in the center of the galaxy results in a slight increase of the black hole accretion rate (see Figure 3) as well as of the star formation rate (see Figure 12).
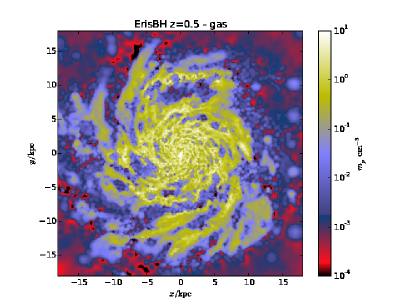
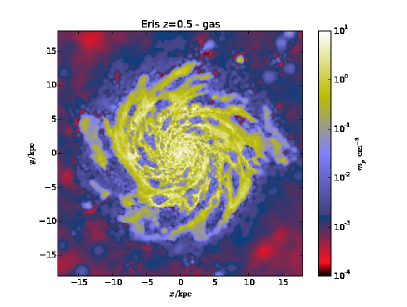
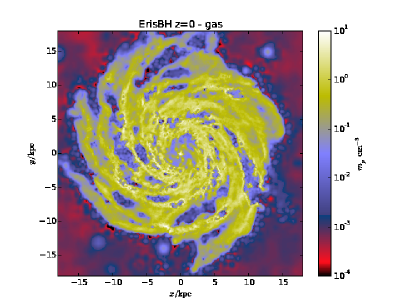
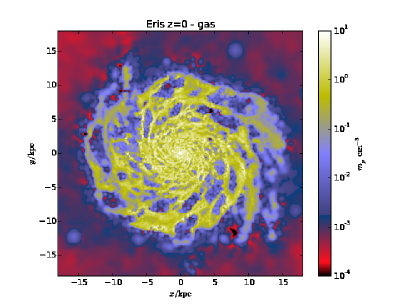
In Figure 9 we show density maps at (upper panels) and (lower panels) in a region of of radius around the center of ErisBH (left column) and Eris (right column). The angle of projection is chosen so that the disks appear face-on. While, as just discussed, the total amount of gas at large scales is the approximately the same in both simulations, gas seems to be more diffuse in the ErisBH galaxy, as also its stellar disk is larger than the one of Eris (see the next subsection). But the most striking difference between the two simulations is probably the “empty” region, of about of radius, in the center of ErisBH at . This region has approximately the physical extent of the bar that has formed at and that, as we mentioned above, by has cleared the center of the galaxy.

4.2 Stellar component
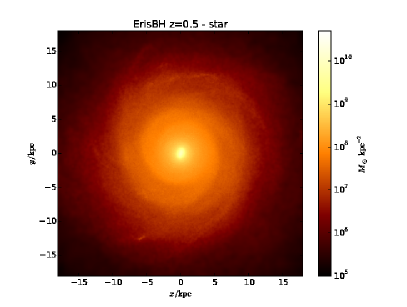
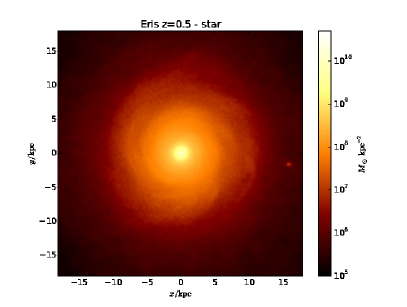
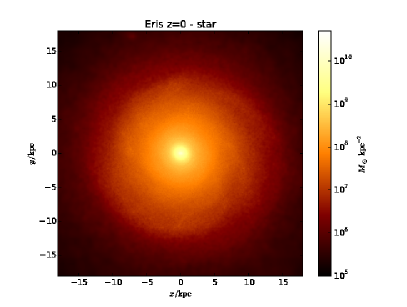
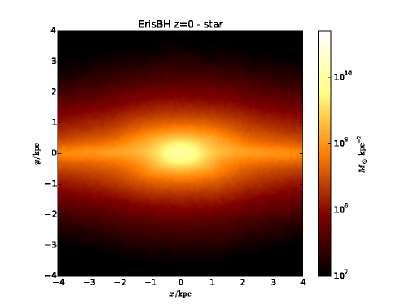
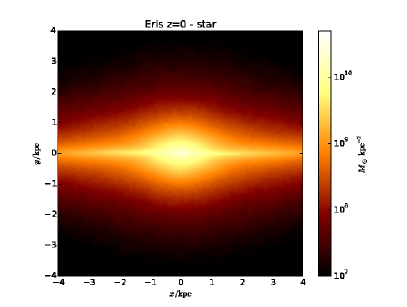
Figure 10 shows maps of the stellar density projected face-on, for the same regions of Figure 9. At the main differences between the two simulations are the slightly larger disk and the smaller bulge of ErisBH . It is again at where we see the most remarkable differences between the two simulations: in ErisBH the bulge is not only smaller than the one of Eris, but now it also features a strong bar, clearly visible in the map, and which has a radius of about . The presence of the bar causes the bulge to have a boxy-peanut morphology when viewed edge-on, as shown in Figure 11.
As discussed in details in Guedes et al. (2013), the pseudobulge of Eris is the result of an inside-out growth, mainly evolved from a stellar bar that formed at high redshift and that has progressively weakened after . In ErisBH the evolution at recent times is different: the weak AGN feedback has inhibited the growth of the bulge, while its disk has actually grown to a larger size with respect to Eris (see the right panel of 8 for quantitative differences in the stellar content of the two simulations at various radii). Being the disk larger and the bulge smaller (and thus with less stabilizing power), the disk of ErisBH is more prone to instabilities. While the bar of Eris thus progressively weakens after , in ErisBH the disk becomes again unstable at 555the ratio (where is the peak of the circular velocity and are the mass and scale-length of the disk) is traditionally used to estimate the stability of galactic disks (Mo et al., 1998). Simulations show that a disk becomes unstable when the ratio becomes smaller than . We find that, at , ErisBH has precisely a value of , while, for comparison, Eris has a value of . Those numbers are consistent with the disk of ErisBH being about to become unstable, while Eris does not suffer any instability event. and the bar gains again strength with several consequences for the stellar and gas properties (e.g., Figures 9, 12, 13).
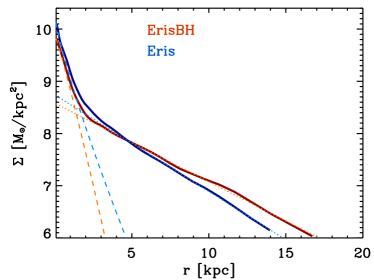
The stellar density profiles of ErisBH and Eris are shown in Figure 14, together with the best-fits for the bulge and disk components. The profiles have been fitted with a double Sérsic profile, with the Sérsic index for the bulge left unconstrained, and the one for the disk fixed at (exponential disk). The best values for the fits are given in Table 2. The bulge of ErisBH features a smaller Sérsic index than Eris ( and , respectively), with a value lower than unity, typical of boxy bulges. The scale radius of the disk of ErisBH is instead larger than the one of Eris ( and , respectively). We obtained the total bulge and disk masses by integrating the Sérsic profiles, and got the values also given in Table 2: the bulge of ErisBH is almost half the one of Eris, while the disk is slightly larger. As discussed above, the weak AGN feedback is responsible for the lower reservoir of gas in the central few hundred parsecs of ErisBH compared to Eris and the consequent lower star formation rate and stellar content in the central region of the galaxy (see Figures 12 and 8). We note that the values we obtained here for the Sérsic index of the bulge and the scale radii for Eris differ from the ones given in (Guedes et al., 2011). There, the fit was performed with the GALFIT code run on the surface brightness profile obtained after processing the simulated galaxy with SUNRISE. Using this methodology, Guedes et al. (2011) obtained a photometric ratio of in the B-band, lower of about a factor of than the ratio we obtain here. Assuming that for ErisBH the ratio between the photometric ratio and the ratio as we calculated here is the same as for Eris (which is plausible, given the similar stellar ages at galaxy scales between the two simulations, see Figure 13), we obtain an estimated value for the photometric B-band ratio of for ErisBH , which would classify the galaxy as a barred spiral.
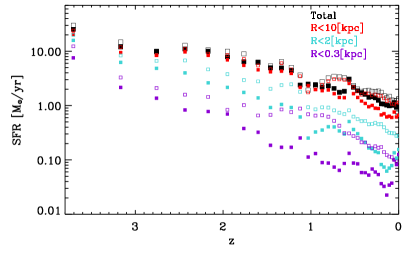
We now look at the differences in sfr history between the two simulations. The evolution of the sfr of Eris and ErisBH if shown in Figure 12 (empty and filled squares respectively). The symbols of different colors show the sfr averaged over snapshots (approximately ) for the entire box (black) and within spheres of different radii from the center. The largest differences between the two simulations are in the inner few , where the star formation rate can be up to an order of magnitude lower in ErisBH than in Eris. This is reflected in the stellar distribution, which is shown in Figure 8: within few the stellar content in ErisBH can be up to lower than in Eris, while above there are no striking differences between the two simulations.
Apart for being generally lower in the central regions, the sfr in ErisBH has also a different redshift evolution: while in Eris the sfr gradually decreased after , in ErisBH we see still some small bursts of star formation at more recent times. There is particularly a new increase of star formation at , after the appearance of the strong nuclear bar visible at . It is likely that the bar is driving a new inflow of gas to the center (see also the gas distribution in the central in the left panel of Figure 8) which leads to a new episode of star formation.
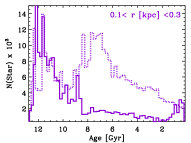
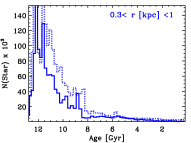
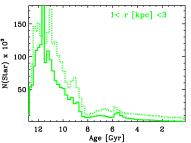
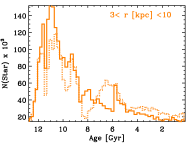
The presence of a young generation of stars in the very center of ErisBH can be seen also in Figure 13, where we show the age distribution of the stars within different radial shells from the center. The very central stars (within ) of ErisBH (solid histogram on top panel) are primarily quite old, except for a population of young stars () originating from the new episode of star formation at which takes place during the formation of the bar. In Eris (dotted histogram) the age distribution in the inner region is different: there is a large population of stars born during the last merger at (), and a slowly decreasing distribution at younger ages (see the corresponding increase in the sfr in the inner region around in Figure 12, followed by a gradual decrease of the sfr).
The role of bars in bringing a population of young stars within the bulges of disk galaxies has been studied by (Coelho & Gadotti, 2011), where the authors speak about a “rejuvenation” of bulges due to the presence of bars.
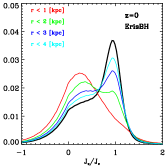
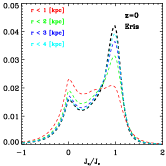
On top of causing a new inflow of gas which leads to the new burst of star formation, the bar has also a dynamical effect in the distribution of angular momentum in the center of the galaxy. Figure 15 shows the distribution of the “orbital circularity parameter” 666The orbital circularity parameter is used to kinematically separate stars belonging to the disk and stars belonging to the bulge. It is defined as , where is the angular momentum of each star in the z-direction (i.e. the direction of ), and is the angular momentum expected for a circular orbit at the same radius. for ErisBH (left) and Eris (right) at for all stars within from the center (black curves) and for stars within different radii from the center (colored lines). Starting from the very central (red curves), there is a striking difference between ErisBH and Eris: in Eris (right panel) there is a narrow peak of stars around , and a significant fraction of higher angular momentum particles that reach the central region. This is not happening in ErisBH , where no high-angular momentum stars are present in the center of the galaxy, consistent with the presence of a strong bar. The detailed effects of the bar on the dynamical properties of the galaxy will be studied in a separate paper.
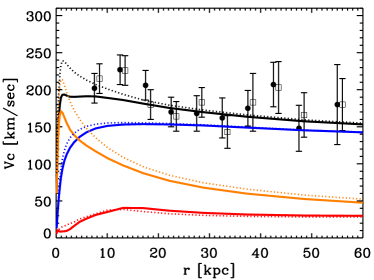
Finally, the lower stellar content in the center of ErisBH results to a lower rotation curve, with respect to Eris, in the inner (Figure 16). A value around for the peak of the circular velocity in the inner region of the galaxy is consistent with the values estimated for the Milky Way by (Portail et al., 2015), who constructed dynamical models of the bulge of the Galaxy using the 3D density measurements of Red Clump Giants and kinematic data from the BRAVA survey. At large distances, on the other side, the rotation curves of the two simulations are almost identical, and consistent with the data of Xue et al. (2008), who estimated the Milky Way’s rotation curve using the kinematics of blue horizontal-branch stars.
To conclude, despite being quantitatively modest, the feedback from the central black hole of ErisBH leads to small changes in the gaseous and stellar distribution in the inner region of the galaxy, when compared to the Eris simulation (where AGN feedback was neglected). Those small variations are then the origin of important secondary effects, particularly in the stability of the galaxy. ErisBH , in fact, experiences a strong instability at , that leads to the formation of a new large bar. This event causes the depletion of gas in the inner few kiloparsecs, and further growth of the bulge is inhibited. By , the central galaxy of ErisBH has a larger disk and a smaller bulge, with a box/peanut morphology, with respect to the Eris galaxy.
| B/T | (Bulge) | |||||||||
|---|---|---|---|---|---|---|---|---|---|---|
| ErisBH | ||||||||||
| Eris |
5 Summary and Conclusions
In this paper we presented ErisBH , a new zoom-in cosmological simulation where we followed the evolution of a Milky Way-size dark matter halo with its baryon content from to the present time. ErisBH is a twin simulation of Eris (Guedes et al., 2011), with which it shares the same initial conditions, simulated physical processes and the resolution of , but, differently from Eris, it includes also prescriptions for the formation and evolution of massive black holes.
Four black holes are inserted during the simulation run in the most massive galaxies that also contain a large gaseous high-density region. The largest black hole, located in the largest galaxy of the simulated volume, is seeded at with an initial mass of about .
In this first paper on ErisBH we focused on studying the properties of this central black hole, its growth, and its relation and influence on the host galaxy. Our main conclusions are:
-
•
During its evolution, very little gas reaches the center of the main galaxy, thus little fuel is available for feeding the main black hole, whose growth is generally highly sub-Eddington. Ending up at with a mass of million Solar masses, only times its initial value, the black hole grows primarily (about a factor of two) through mergers with the infalling black holes originally hosted by satellite galaxies;
-
•
Given the little gas supply, the value of the initial seed mass is rather important. Generalizing our results, we expect Milky Way-size galaxies to be hosting an intermediate-mass black hole already at . This could be possible either via a direct collapse in the protogalaxy, or via the uninterrupted growth close to the Eddington rate of a Pop III star remnant.
-
•
The final black hole sits on the and relations in a location close to the one of SgrA*. Consistent with observational results for pseudobulges, ErisBH is close to the extrapolation at lower masses of the relation established by more massive galaxies, while it is almost an order of magnitude below the relation;
-
•
Given the little growth by accretion of the central black hole, the AGN feedback on the galaxy is quite modest. Only the very central region of the galaxy (within ) seems to be affected by the presence of the black hole, with the consequence that the gas content and the star formation rates in the central region of the galaxy are lower than the ones found in Eris;
-
•
Because of its smaller bulge and the lower concentration of gas in the center, the disk of ErisBH is more unstable. The last instability event, at , causes the formation of a bar of about in radius and a burst of star formation in the very central few hundred parsecs;
-
•
At , the disc of ErisBH is slightly larger than the one of Eris, while its bulge is almost a factor of two smaller. Consequently, the B/D ratio of ErisBH is about half of the one of Eris and its rotation curve flatter. Moreover, the bulge of ErisBH is characterized by the box/peanut morphology typical of barred galaxies, and, at its very center, it hosts a population of very young stars.
In summary, as expected, progenitors of late-type galaxies seem to not be favourable sites for efficient black hole growth, probably due to their rather quiet merger history. While we do no witness any dramatic episode of AGN feedback, we find, however, that the weak, but circumscribed, energy input from the black hole helps the global stellar feedback to inhibit the growth of the bulge, which has important consequences on the global stability of the disk. Modest-size black holes, though, might play an important role in the dynamical evolution of late-type spirals.
Acknowledgments
We thank Massimo Dotti, Dimitri Gadotti and Ortwin Gerhard for useful discussions. This work was possible thanks to the computing time allocations at the Swiss National Supercomputing Center and at the Ohio Supercomputer Center. PM acknowledges support by the NSF through grant AST-1229745 and by NASA through grant NNX12AF87G. FG acknowledges support from NSF grant AST-0607819 and NASA ATP NNX08AG84G.
References
- Agarwal et al. (2012) Agarwal B., Khochfar S., Johnson J. L., Neistein E., Dalla Vecchia C., Livio M., 2012, ArXiv e-prints
- Agertz & Kravtsov (2015) Agertz O., Kravtsov A. V., 2015, ApJ, 804, 18
- Aumer et al. (2013) Aumer M., White S. D. M., Naab T., Scannapieco C., 2013, MNRAS, 434, 3142
- Baganoff et al. (2003) Baganoff F. K., Maeda Y., Morris M., Bautz M. W., Brandt W. N., Cui W., Doty J. P., Feigelson E. D., Garmire G. P., Pravdo S. H., Ricker G. R., Townsley L. K., 2003, ApJ, 591, 891
- Bellovary et al. (2010) Bellovary J. M., Governato F., Quinn T. R., Wadsley J., Shen S., Volonteri M., 2010, ApJ, 721, L148
- Bellovary et al. (2014) Bellovary J. M., Holley-Bockelmann K., Gültekin et al., 2014, MNRAS, 445, 2667
- Bond et al. (1984) Bond J. R., Arnett W. D., Carr B. J., 1984, ApJ, 280, 825
- Bondi (1952) Bondi H., 1952, MNRAS, 112, 195
- Bondi & Hoyle (1944) Bondi H., Hoyle F., 1944, MNRAS, 104, 273
- Bonoli et al. (2014) Bonoli S., Mayer L., Callegari S., 2014, MNRAS, 437, 1576
- Booth & Schaye (2009) Booth C. M., Schaye J., 2009, MNRAS, 398, 53
- Brook et al. (2011) Brook C. B., Governato F., Roškar R., Stinson G., Brooks A. M., Wadsley J., Quinn T., Gibson B. K., Snaith O., Pilkington K., House E., Pontzen A., 2011, MNRAS, 415, 1051
- Callegari et al. (2011) Callegari S., Kazantzidis S., Mayer L., Colpi M., Bellovary J. M., Quinn T., Wadsley J., 2011, ApJ, 729, 85
- Callegari et al. (2009) Callegari S., Mayer L., Kazantzidis S., Colpi M., Governato F., Quinn T., Wadsley J., 2009, ApJ, 696, L89
- Chapon et al. (2013) Chapon D., Mayer L., Teyssier R., 2013, MNRAS, 429, 3114
- Churazov et al. (2005) Churazov E., Sazonov S., Sunyaev R., Forman W., Jones C., Böhringer H., 2005, MNRAS, 363, L91
- Churazov et al. (2002) Churazov E., Sunyaev R., Forman W., Böhringer H., 2002, MNRAS, 332, 729
- Coelho & Gadotti (2011) Coelho P., Gadotti D. A., 2011, ApJ, 743, L13
- Debattista et al. (2006) Debattista V. P., Mayer L., Carollo C. M., Moore B., Wadsley J., Quinn T., 2006, ApJ, 645, 209
- Di Matteo et al. (2008) Di Matteo T., Colberg J., Springel V., Hernquist L., Sijacki D., 2008, ApJ, 676, 33
- Di Matteo et al. (2005) Di Matteo T., Springel V., Hernquist L., 2005, Nature, 433, 604
- Dijkstra et al. (2014) Dijkstra M., Ferrara A., Mesinger A., 2014, MNRAS, 442, 2036
- Dubois et al. (2013) Dubois Y., Gavazzi R., Peirani S., Silk J., 2013, MNRAS, 433, 3297
- Erwin & Gadotti (2012) Erwin P., Gadotti D. A., 2012, Advances in Astronomy, 2012, 4
- Gadotti & Kauffmann (2009) Gadotti D. A., Kauffmann G., 2009, MNRAS, 399, 621
- Ghez et al. (2008) Ghez A. M., Salim S., Weinberg N. N., Lu J. R., Do T., Dunn J. K., Matthews K., Morris M. R., Yelda S., Becklin E. E., Kremenek T., Milosavljevic M., Naiman J., 2008, ApJ, 689, 1044
- Gill et al. (2004) Gill S. P. D., Knebe A., Gibson B. K., 2004, MNRAS, 351, 399
- Gillessen et al. (2009) Gillessen S., Eisenhauer F., Trippe S., Alexander T., Genzel R., Martins F., Ott T., 2009, ApJ, 692, 1075
- Governato et al. (2010) Governato F., Brook C., Mayer L., Brooks A., Rhee G., Wadsley J., Jonsson P., Willman B., Stinson G., Quinn T., Madau P., 2010, Nature, 463, 203
- Graham & Scott (2015) Graham A. W., Scott N., 2015, ApJ, 798, 54
- Greene et al. (2008) Greene J. E., Ho L. C., Barth A. J., 2008, ApJ, 688, 159
- Guedes et al. (2011) Guedes J., Madau P., Mayer L., Callegari S., 2011, ApJ, 729, 125
- Guedes et al. (2013) Guedes J., Mayer L., Carollo M., Madau P., 2013, ApJ, 772, 36
- Haiman & Hui (2001) Haiman Z., Hui L., 2001, ApJ, 547, 27
- Häring & Rix (2004) Häring N., Rix H.-W., 2004, ApJ, 604, L89
- Ho (2009) Ho L. C., 2009, ApJ, 699, 626
- Hopkins & Quataert (2010) Hopkins P. F., Quataert E., 2010, MNRAS, 407, 1529
- Hopkins & Quataert (2011) Hopkins P. F., Quataert E., 2011, MNRAS, 415, 1027
- Hopkins et al. (2006) Hopkins P. F., Robertson B., Krause E., Hernquist L., Cox T. J., 2006, ApJ, 652, 107
- Hoyle & Lyttleton (1939) Hoyle F., Lyttleton R. A., 1939, in Proceedings of the Cambridge Philosophical Society Vol. 35 of Proceedings of the Cambridge Philosophical Society, The effect of interstellar matter on climatic variation. pp 405–+
- Hu (2008) Hu J., 2008, MNRAS, 386, 2242
- Jiang et al. (2011) Jiang Y.-F., Greene J. E., Ho L. C., 2011, ApJ, 737, L45
- Johnson et al. (2011) Johnson J. L., Khochfar S., Greif T. H., Durier F., 2011, MNRAS, 410, 919
- Kaufmann et al. (2007) Kaufmann T., Mayer L., Wadsley J., Stadel J., Moore B., 2007, MNRAS, 375, 53
- King (2003) King A., 2003, ApJ, 596, L27
- Knollmann & Knebe (2009) Knollmann S. R., Knebe A., 2009, ApJS, 182, 608
- Kormendy (2004) Kormendy J., 2004, in L. C. Ho ed., Coevolution of Black Holes and Galaxies The Stellar-Dynamical Search for Supermassive Black Holes in Galactic Nuclei. pp 1–+
- Kormendy et al. (2011) Kormendy J., Bender R., Cornell M. E., 2011, Nature, 469, 374
- Kroupa (2001) Kroupa P., 2001, MNRAS, 322, 231
- Lodato & Natarajan (2006) Lodato G., Natarajan P., 2006, MNRAS, 371, 1813
- Madau et al. (2014) Madau P., Haardt F., Dotti M., 2014, ApJ, 784, L38
- Madau & Rees (2001) Madau P., Rees M. J., 2001, ApJ, 551, L27
- Magorrian et al. (1998) Magorrian J., Tremaine S., Richstone D., Bender R., Bower G., Dressler A., Faber S. M., Gebhardt K., Green R., Grillmair C., Kormendy J., Lauer T., 1998, AJ, 115, 2285
- Marinacci et al. (2014) Marinacci F., Pakmor R., Springel V., 2014, MNRAS, 437, 1750
- Martizzi et al. (2014) Martizzi D., Jimmy Teyssier R., Moore B., 2014, MNRAS, 443, 1500
- Martizzi et al. (2012) Martizzi D., Teyssier R., Moore B., 2012, MNRAS, 420, 2859
- Mathur et al. (2012) Mathur S., Fields D., Peterson B. M., Grupe D., 2012, ApJ, 754, 146
- Mayer et al. (2014) Mayer L., Fiacconi D., Bonoli S., Quinn T., Roskar R., Shen S., Wadsley J., 2014, ArXiv e-prints
- Mayer et al. (2008) Mayer L., Kazantzidis S., Escala A., 2008, ArXiv e-prints
- Mayer et al. (2010) Mayer L., Kazantzidis S., Escala A., Callegari S., 2010, Nature, 466, 1082
- Mayer et al. (2007) Mayer L., Kazantzidis S., Madau P., Colpi M., Quinn T., Wadsley J., 2007, Science, 316, 1874
- McConnell & Ma (2013) McConnell N. J., Ma C.-P., 2013, ApJ, 764, 184
- Merloni & Heinz (2008) Merloni A., Heinz S., 2008, MNRAS, 388, 1011
- Merritt & Ferrarese (2001) Merritt D., Ferrarese L., 2001, ApJ, 547, 140
- Mo et al. (1998) Mo H. J., Mao S., White S. D. M., 1998, MNRAS, 295, 319
- Murante et al. (2015) Murante G., Monaco P., Borgani S., Tornatore L., Dolag K., Goz D., 2015, MNRAS, 447, 178
- Narayan et al. (1998) Narayan R., Mahadevan R., Grindlay J. E., Popham R. G., Gammie C., 1998, ApJ, 492, 554
- Navarro & Benz (1991) Navarro J. F., Benz W., 1991, ApJ, 380, 320
- Okamoto (2013) Okamoto T., 2013, MNRAS, 428, 718
- Pavlinsky et al. (1994) Pavlinsky M. N., Grebenev S. A., Sunyaev R. A., 1994, ApJ, 425, 110
- Portail et al. (2015) Portail M., Wegg C., Gerhard O., 2015, MNRAS, 450, L66
- Regan & Haehnelt (2009) Regan J. A., Haehnelt M. G., 2009, MNRAS, 396, 343
- Roškar et al. (2015) Roškar R., Fiacconi D., Mayer L., Kazantzidis S., Quinn T. R., Wadsley J., 2015, MNRAS, 449, 494
- Roškar et al. (2014) Roškar R., Teyssier R., Agertz O., Wetzstein M., Moore B., 2014, MNRAS, 444, 2837
- Scannapieco (2012) Scannapieco C. e. a., 2012, MNRAS, 423, 1726
- Shakura & Sunyaev (1973) Shakura N. I., Sunyaev R. A., 1973, A&A, 24, 337
- Sijacki & Springel (2006) Sijacki D., Springel V., 2006, MNRAS, 366, 397
- Silk & Rees (1998) Silk J., Rees M. J., 1998, A&A, 331, L1
- Skinner et al. (1987) Skinner G. K., Willmore A. P., Eyles C. J., Bertram D., Church M. J., 1987, Nature, 330, 544
- Spergel et al. (2007) Spergel D. N., Bean R., Doré O., et al., 2007, ApJS, 170, 377
- Springel et al. (2005a) Springel V., Di Matteo T., Hernquist L., 2005a, ApJ, 620, L79
- Springel et al. (2005b) Springel V., Di Matteo T., Hernquist L., 2005b, MNRAS, 361, 776
- Stinson et al. (2006) Stinson G., Seth A., Katz N., Wadsley J., Governato F., Quinn T., 2006, MNRAS, 373, 1074
- Tanaka & Haiman (2009) Tanaka T., Haiman Z., 2009, ApJ, 696, 1798
- Tremaine et al. (2002) Tremaine S., Gebhardt K., Bender R., Bower G., Dressler A., Faber S. M., Filippenko A. V., Green R., Grillmair C., Ho L. C., Kormendy J., Lauer T. R., Magorrian J., Pinkney J., Richstone D., 2002, ApJ, 574, 740
- Tremmel et al. (2015) Tremmel M., Governato F., Volonteri M., Quinn T. R., 2015, ArXiv e-prints
- Volonteri & Bellovary (2012) Volonteri M., Bellovary J., 2012, Reports on Progress in Physics, 75, 124901
- Volonteri et al. (2008) Volonteri M., Lodato G., Natarajan P., 2008, MNRAS, 383, 1079
- Volonteri et al. (2015) Volonteri M., Silk J., Dubus G., 2015, ApJ, 804, 148
- Wadsley et al. (2004) Wadsley J. W., Stadel J., Quinn T., 2004, New A, 9, 137
- Wise et al. (2008) Wise J. H., Turk M. J., Abel T., 2008, ApJ, 682, 745
- Wyithe & Loeb (2012) Wyithe J. S. B., Loeb A., 2012, MNRAS, 425, 2892
- Xue et al. (2008) Xue X. X., Rix H. W., Zhao G., Re Fiorentin P., Naab T., Steinmetz M., van den Bosch F. C., Beers T. C., Lee Y. S., Bell E. F., Rockosi C., Yanny B., Newberg H., Wilhelm R., Kang X., Smith M. C., Schneider D. P., 2008, ApJ, 684, 1143