Monte Carlo Performance Studies of Candidate Sites for the Cherenkov Telescope Array
Abstract:
The Cherenkov Telescope Array (CTA) is the next-generation gamma-ray observatory with sensitivity in the energy range from 20 GeV to beyond 300 TeV. CTA is proposed to consist of two arrays of 40-100 imaging atmospheric Cherenkov telescopes, with one site located in each of the Northern and Southern Hemispheres. The evaluation process for the candidate sites for CTA is supported by detailed Monte Carlo simulations, which take different attributes like site altitude and geomagnetic field configuration into account. In this contribution we present the comparison of the sensitivity and performance of the different CTA site candidates for the measurement of very-high energy gamma rays.
1 Introduction
The Cherenkov Telescope Array (CTA) is the future gamma-ray observatory aiming at an order of magnitude improvement in flux sensitivity compared to current arrays of imaging atmospheric Cherenkov telescopes. CTA will give deep and unprecedented insight into the non-thermal high-energy Universe. The utilisation of three different telescope sizes will provide a very broad energy range from as low as 20 GeV to beyond 300 TeV. The observatory is proposed to consist of two arrays, with one site located in each of the Northern and Southern Hemispheres. The baseline array for CTA South consists of 4 large-sized telescopes (LSTs), 25 mid-sized telescopes (MSTs) and about 70 small-sized telescopes (SSTs). The northern array (CTA North) is somewhat smaller with 4 LSTs and 15 MSTs. The site choices have significant impact on the overall science performance of the observatory. The suitability of a site is given by
-
•
the average annual observing time, determined by the number of night hours without moon or partial moon and the fraction of nights with suitable atmospheric conditions (typically between 1000 and 1300 hours / year);
-
•
the science performance (presented in this contribution), which is derived from site attributes like altitude, geomagnetic field, night-sky background level and aerosol optical depth;
-
•
the risks, construction and operating costs.
2 Monte Carlo Simulations of Site Candidates for CTA
The CTA site evaluation studies on the science performance presented in the following uses detailed Monte Carlo (MC) simulations of the instrument in development. More specifically, CORSIKA [1] is used for the simulation of the particle showers in the atmosphere and sim_telarray [2] for the detector simulation. The candidates sites considered are listed together with their altitude and geomagnetic field strength in Table 1. Besides these parameters, atmospheric profiles derived specifically for each site are used in the air shower simulations. The assumed night-sky background level (NSB) corresponds to dark-sky observations towards an extra-galactic field and is set to identical values at all sites222 It should be noted that measurements by the CTA site work package revealed that the level of anthropogenic night sky background varies significantly between site candidates.. For a dedicated study, a small set of simulations has been carried out with elevated NSB levels (by 30% and 50%).
| Candidate site name | Latitude, Longitude | Altitude | Bhor | B |
| [m] | [T] | [T] | ||
| Aar (Namibia) | S E | 1640 | 10.9 | -24.9 |
| Armazones (Chile) | S W | 2100 | 21.4 | -8.9 |
| Leoncito (Argentina) | S W | 2640 | 19.9 | -12.6 |
| Leoncito++ (Argentina) | S W | 1650 | 19.9 | -12.6 |
| San Antonio de los Cobres (SAC; Argentina) | S W | 3600 | 20.9 | -8.9 |
| Meteor Crater (USA) | N W | 1680 | 23.6 | 42.7 |
| San Pedro Martir (SPM; Mexico) | N W | 2400 | 25.3 | 38.4 |
| Teide, Tenerife (Spain) | N W | 2290 | 30.8 | 23.2 |
| Aar@500 m (hypothetical site) | S E | 500 | 10.9 | -24.9 |
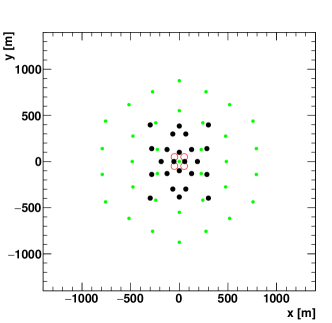
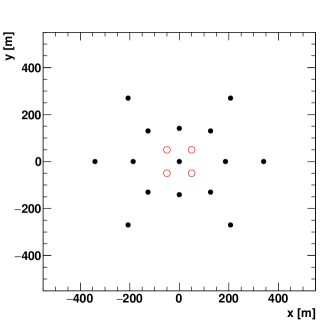
The details of the MC simulations, termed prod-2, are described in a separate contribution to this conference [5]. The telescopes, including cameras, trigger and readout electronics are assumed to be identical at all sites. For each southern site, telescopes were simulated at a total of 229 positions, with many of the positions used for more than one telescope type. For some sites, the simulations include seven different telescope types (LST, two MST types, and up to four SST types) while others include only four types (LST, MST plus two SST types, with SSTs not on as many positions as for the other sites). Unfortunately, the currently preferred layout with 4-m class SSTs depends on the additional SST positions and is thus not available for a comparison of all sites. The array layout considered here consists of 4 LSTs, 24 MSTs, and 35 7m-class SSTs (see Figure 1, left) for the southern sites, and of 4 LSTs and 15 MSTs (see Figure 1, right) for the layout for the northern sites. The conclusions on the science performance of the different sites have been tested to be independent of the chosen array layout.
The MC simulations consist of primary gamma-ray, proton, and electron events. All results are for point-like gamma-ray sources located at the centre of the field of view and observed at a zenith angle of and two different azimuth directions (all telescopes pointing towards north or towards south). A typical MC set for one site comprises about a billion simulated gamma-ray and electron, and about 100 billion proton events. The simulation requires substantial computing resources: the simulation of a single CTA site requires between 10-20 million HS06 CPU hours and 20 TBytes of event data written to disk. A large fraction of the MC production used the EGI GRID, utilising the DIRAC framework as interware [4].
3 Analysis
Several independent analysis packages derived from tools used in the H.E.S.S., MAGIC and VERITAS collaborations were used to process the MC production, see [3, 5] for details. The results from the different packages are completely consistent with each other. Here we present results obtained with the eventdisplay package333 One of the official analysis packages of the VERITAS collaboration, for details see https://znwiki3.ifh.de/CTA/Eventdisplay%20Software.
Briefly, this analysis consists of a two-pass FADC trace integration step [6] using both charge and timing information to find the optimal placement of the trace integration window. Pixels are selected using a two-level cleaning filter, searching for integrated signals larger than five times their level of pedestal standard variation, or greater than four times the pedestal variation for pixels adjacent to a pixel selected at higher threshold. The resulting shower images are then parameterised by a second-moment (’Hillas’) analysis, followed by a classical stereo reconstruction using the major axes of the cleaned images. The energy of each event is reconstructed using lookup tables of mean gamma-ray energies as a function of image amplitude (the sum of the integrated charges of the pixels selected in the image cleaning step) and the distance of the telescope from the shower axis. The gamma-hadron separation makes use of a boosted-decision tree algorithm, trained with a subset of the simulated signal and background events.
CTA will be much more powerful in separating gamma rays from background hadronic events than current observatories, as most of the events observed are sampled inside the area of the array. These so-called contained events are much better sampled, providing improved background rejection, better angular resolution, and reduced energy threshold. It is expected that the performance of the future CTA reconstruction pipeline will provide a significant improvement compared to the results presented in the following, as they are obtained with analyses optimised for current instruments with 2-5 telescopes in operation.
4 Science Performance
The primary performance criteria for the site evaluation are differential sensitivity over the entire energy range of CTA from 30 GeV to 300 TeV. The differential sensitivity, i.e. the sensitivity to point-like gamma-ray sources calculated for a small range of energies, incorporates collection area, angular resolution, and background rate. It is defined as an independent detection (5 sigma significance, 10 excess events, and more than 5% of the remaining background) in each energy bin. We use five logarithmic bins per decade of energy.
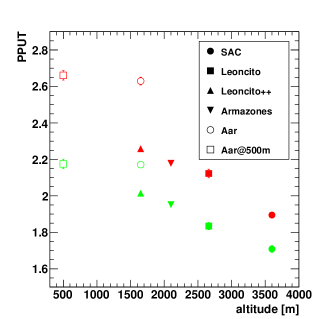
As good sensitivity is required over the complete energy range defined above, the figure of merit used for easier comparison of the science performance at the different site candidates is the so-called performance per unit time (PPUT). It is defined as the inverse of the geometric mean of the sensitivity in individual energy bins, normalised by a reference sensitivity in each band:
| (1) |
with bins in energy (from 30 GeV to 300 (20) TeV for CTA South (North)) of the reference sensitivity and the achieved flux sensitivity . The reference sensitivity has been derived from the analysis of a previous production of CTA simulations (prod1, see [3]) for a site at 2000 m altitude and with a geomagnetic field strength and orientation intermediate between that found at the Aar and Tenerife sites. This first production of MC simulations for CTA was based on initial and conservative assumptions of telescope parameters and without the possibility of pursuing an advanced analysis of the FADC traces, which improves especially the sensitivity to low-energy events. For these reasons, PPUT values are expected to be significantly larger than one.
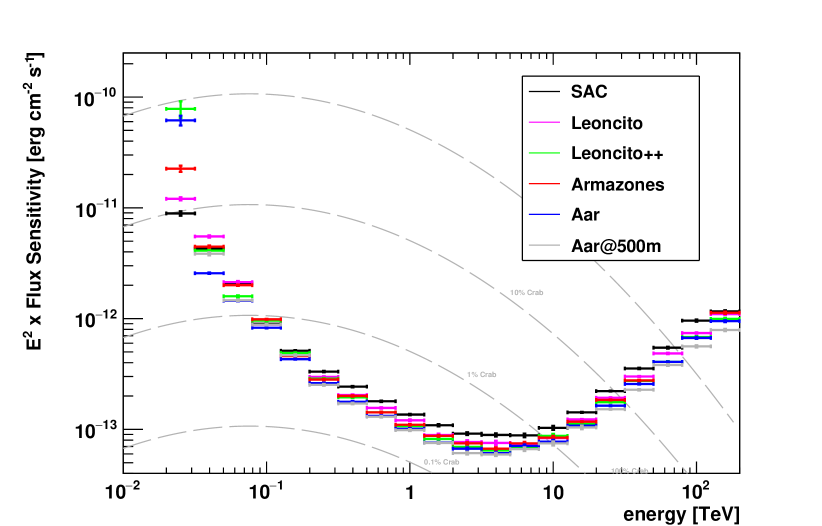
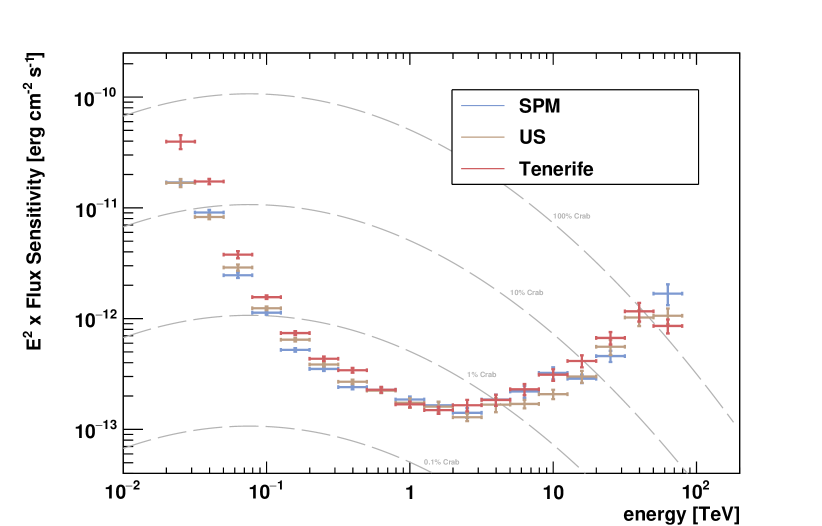
4.1 Performance for dark-sky observations
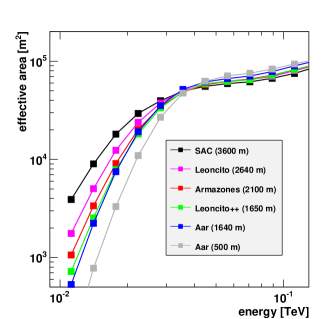
Figure 2 shows the on-axis differential point-source sensitivity vs energy for the considered CTA site candidates, Figures 3 and 4 the effect of site altitude and geomagnetic field on the overall sensitivity and the response at threshold energies. Clearly, science performance varies significantly between the sites. At the energy threshold of the instrument, the detection is limited by the number of Cherenkov photons hitting the telescopes. Higher-altitude sites like the San Antonio de los Cobres site at 3600 m a.s.l. show the best performance among all sites at energies in the 20-40 GeV range; they are closer to the shower maximum with higher photon intensities on the ground at distances 150 m to the shower axis (see especially Figure 4, left).
The mid-energy range (roughly from 50 GeV to 10 TeV for CTA South respectively 5 TeV for CTA North) is background dominated and performance is limited by the ability to suppress background events and by the quality of the angular reconstruction. Altitude affects sensitivity in this energy range in two ways: for a given gamma-ray energy, the predominantly proton background appears more gamma-ray like at higher altitude; and very close to the shower axis the contribution from particles penetrating to ground level increases with altitude, increasing the level of fluctuations in gamma-ray images and complicating the gamma-hadron separation. Lower-altitude sites clearly perform better in this energy range. This was the reason to explore in addition to the CTA candidate sites also a hypothetical site at 500 m altitude. The Aar@500m site shows good performance in the mid-energy range, but not better than the Aar site at 1640 m altitude. The benefits of lower-altitude sites described above seem to be balanced by a decreased number of photons, mainly due to the larger distance of the observatory to the shower maximum. The significantly lower effective area at energies below 50 GeV of the (hypothetical) Aar@500m site would deteriorate particularly its ability to detect soft transients like Gamma-ray bursts.
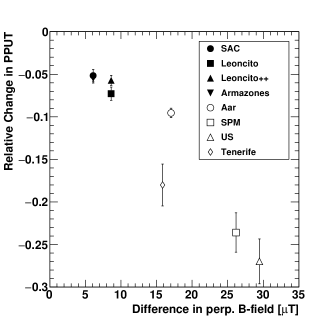
The geomagnetic field produces a separation of positive and negative charges in air showers, leading to a distortion of the Cherenkov light pool on the ground and of the shapes of images. This affects gamma-hadron separation, the angular and energy reconstruction. Figure 3 reveals significant differences in performance between observing showers with directions close to parallel to the geomagnetic field lines (arrays pointing south for sites in the Southern hemisphere) to observations in directions at larger angles to the field lines. The sensitivity of the sites in South America is inferior to those in Southern Africa, at equal altitude, mainly because the different inclination of the geomagnetic field results in larger average field strengths perpendicular to the shower direction at small zenith angles in South America. For larger zenith angles (simulations being available for some sites at 40∘) the differences are smaller. It should be noted that the considered zenith angle of is the worst case scenario for the Northern sites, resulting in showers propagating almost exactly perpendicular to the geomagnetic field lines. The average zenith angle for observations for CTA will very likely be around . At the highest energies, the sensitivity is limited by the signal collection area, which is larger at low-altitude sites due to the higher density of Cherenkov photons at large impact distances.
4.2 Performance at increased night-sky background levels
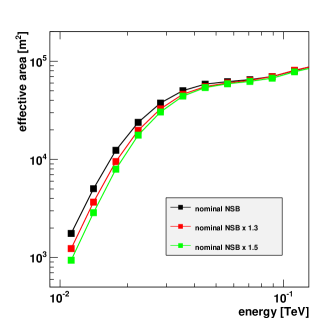
Higher night-sky background levels are expected at some sites due to increased anthropogenic night levels, but also at all sites for observations towards bright regions in the sky, e.g. toward the Galactic Centre region. The level of night-sky background (NSB) light affects the performance mainly in the threshold region. Higher NSB produces higher accidental rates, requiring increased trigger thresholds. It also lowers the signal-to-noise ratio in images, leading to a loss of low-energy events and quality in reconstruction. Figure 4, right, shows the impact of increasing the NSB level by 30% and 50% on the effective areas for the Leoncito site. At 40 (25) GeV, effective areas are between 10 and 20 % (50 and 70%) lower for higher NSB levels.
5 Conclusions
The science performance of the CTA candidate sites differ significantly, showing a strong dependence on site altitude and strength of the geomagnetic field. The best overall performance is expected for sites at around 1700 m site altitude, with an acceptable range of altitudes between 1600 and 2500 m. In the meantime, the CTA site selection process is progressing rapidly: Government representatives of the countries involved in CTA shortlisted two sites for each hemisphere based on the input from the CTA collaboration on annual available observing time, science performance (this study), risks, and cost. The two sites in the Southern Hemisphere are Aar and Armazones (with Leoncito in Argentina kept as a third option), for the Northern Hemisphere the selected sites are Tenerife and San Pedro Martir.
Acknowledgments
We gratefully acknowledge support from the agencies and organizations listed under Funding Agencies at this website: http://www.cta-observatory.org/.
References
- [1] D. Heck, J. Knapp, J.N. Capdevielle, G. Schatz, T. Thouw, Report FZKA 6019 (1998), Forschungszentrum Karlsruhe; http://www.ikp.kit.edu/corsika/
- [2] K. Bernlöhr, Astropart. Phys. 30 (2008) 149
- [3] K. Bernlöhr et al (for the CTA consortium), Astropart. Phys. 43 (2013) 171; K. Bernlöhr et al (for the CTA consortium), 33rd ICRC, Rio de Janeiro 2013 (arXiv:1307.2773)
- [4] L. Arrabito et al. 2014 Journal of Physics: Conference Series 513 032003
- [5] T. Hassan et al (for the CTA consortium), Proceedings of the 34th ICRC 2015
- [6] J. Holder et al (VERITAS collaboration) 2006, Astroparticle Physics 25, 391