Star-forming regions at the periphery of the supershell surrounding the Cyg OB1 association. I. The star cluster vdB 130 and its ambient gas and dust medium
Abstract
Stellar population and the interstellar gas-dust medium in the vicinity of the open star cluster vdB 130 are analysed using optical observations taken with the 6-m telescope of the SAO RAS and the 125-cm telescope of the SAI MSU along with the data of Spitzer and Herschel. Based on proper motions and BV and JHKs 2MASS photometric data, we select additional 36 stars as probable cluster members. Some stars in vdB 130 are classified as B stars. Our estimates of minimum colour excess, apparent distance modulus and the distance are consistent with young age (from 5 to 10 Myrs) of the cluster vdB 130. We suppose the large deviations from the conventional extinction law in the cluster direction, with . The cluster vdB 130 appears to be physically related to the supershell around Cyg OB1, a cometary CO cloud, ionized gas, and regions of infrared emission. There are a few regions of bright mid-infrared emission in the vicinity of vdB 130. The largest of them is also visible on H and [Sii] emission maps. We suggest that the infrared blobs that coincide in projection with the head of the molecular cloud are Hii regions, excited by the cluster B-stars. Some signatures of a shock front are identified between these IR-bright regions.
keywords:
ISM: kinematics and dynamics – ISM: clouds – ISM: lines and bands – ISM: Hii regions – infrared: ISM – open clusters and associations: individual: vdB 1301 Introduction
Star formation picture drawn by modern observations is much more intricate than it used to be a few decades ago. Our current view of the early phases of pre-stellar and stellar evolution has been expanded significantly by Spitzer, Herschel, HST, Chandra, XMM and other space-based and ground-based facilities.
Now we have a much better understanding of sequential star formation triggered by turbulence, feedback from outflows, supernova explosions and expanding Hii regions. These and other factors work together sculpting a fine structure of molecular clouds with filaments, pillars, blobs, peppered with young stellar objects (YSOs). Given this complexity, along with large-scale studies, a detailed look at some specific objects and regions can be useful for distinguishing between general and particular features of the star formation process.
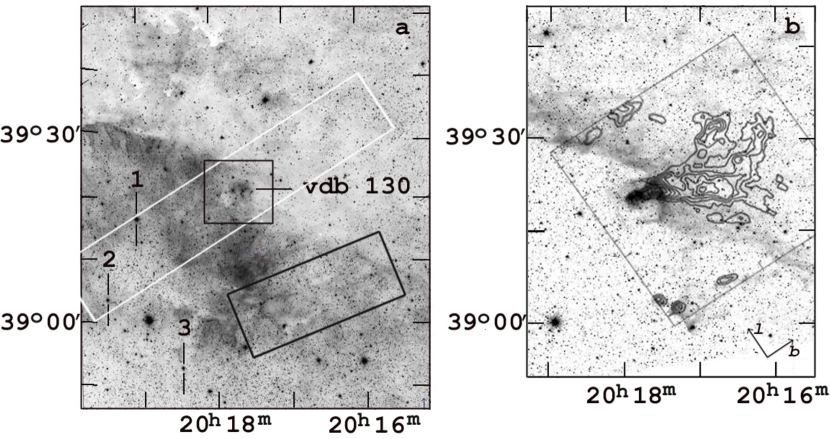
In this paper we present an investigation of the stellar population and gas-dust medium in the region located in the north-west border of a supershell surrounding the Cyg OB1 association (Fig. 1a).
The Cyg OB1 supershell with an angular size of is a part of Cygnus X region, the richest and most massive complex of star formation in the Galaxy. Schneider et al. (2006, 2007, 2011) showed that the Cygnus X South region contains a large scale network of molecular clouds with ubiquitous recent and ongoing star formation regions. The area includes several OB associations and stellar clusters. Their energy injection from UV radiation, stellar winds and SN explosions could be a driving source for the supershell formation and expansion. The cloud complex at the south-west of Cygnus X has an extended shell-like structure, which coincides well with the infrared, optical, and radio supershell encircling Cyg OB1 and Cyg OB9 associations. Study of the triggered star formation within walls of this shell can help to reveal the spatially resolved star formation history in the entire region. In this series of papers we plan to present results on the stellar content, young stellar objects, and the diffuse matter in the area, putting them into a general context of the star formation in giant molecular cloud complexes.
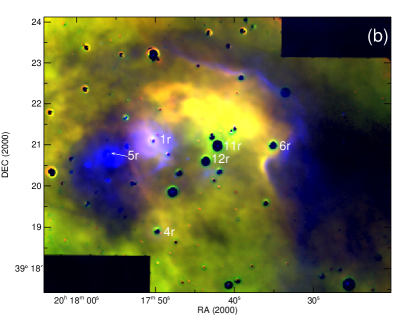
In this work we analyze a small region in the north-western wall of Cyg OB1 supershell. It contains the young open cluster vdB 130 characterized by an anomalously strong and non-uniform reddening (Racine, 1974; Moffat & Schmidt-Kaler, 1976; Le Duigou & Knödlseder, 2002), the reflection nebula vdB 130 of the same name (van den Bergh, 1966), also referred to as GN 20.16.0 (Magakian, 2003), multiple compact and extended infrared (IR) sources, and a molecular cloud of a cometary shape seen in CO emission (cloud A in Schneider et al., 2007).
The goal of this study is to revise the stellar content of the cluster vdB 130 (in a view of new optical and IR data) and to analyse the physical relationship between various components of stellar, gaseous, and dust populations in the region of sequential star formation.
This paper represents a follow up of our previous studies of triggered star formation regions in the north-west wall of the Cyg OB1 supershell. In the work of Arkhipova et al. (2013) a family of cometary globules with a few patches of star formation has been investigated in a region, shown with a lower black rectangle in Fig. 1a.
Section 2 describes the spectroscopic, photometric, and interferometric observations. Section 3 presents the results of our revision of the stellar composition of vdB 130 based on the data of the 2MASS survey, the UCAC4 catalogue of proper motions, and the spectral types that we determined for a number of stars. In Sections 4.1 and 4.2 we analyse the structure, kinematics, and the emission spectrum of the interstellar medium (ISM) in the vicinity of vdB 130, and possible links between various components of the stellar population and the ISM in the region. In Section 4.3 we discuss the nature of the IR radiation of the interstellar medium in the neighbourhood of vdB 130 based on Spitzer and Herschel archival data. The concluding section summarizes the main results of the study.
2 Observations and data reduction
This study is based on optical observations performed with the 6-m telescope of Special Astrophysical Observatory of Russian Academy of Sciences (SAO RAS) and the 125-cm telescope of the Crimean Laboratory of Sternberg Astronomical Institute, Lomonosov Moscow State University (SAI MSU) as well as on archival IR data obtained with Spitzer and Herschel space observatories. The log of our observations is presented in Table 1, where the exposure time (), the field of view (FOV), the final angular resolution (), the final spectral resolution () and the bandwidth (FWHM) of the used filter are indicated.
2.1 Spectral observations
| Data set | Filter or Disperser | Date of obs | (sec) | FOV | Sp. range | or FWHM (Å) | |
|---|---|---|---|---|---|---|---|
| Field #1 | FN655 | 2014/10/16 | 360 | 3.5 | H[Nii] | 97 | |
| FN674 | 2014/10/16 | 360 | 3.5 | [Sii] | 60 | ||
| FN641 | 2014/10/16 | 160 | 3.5 | continuum | 179 | ||
| FN712 | 2014/10/16 | 160 | 3.5 | continuum | 209 | ||
| Field #2 | FN655 | 2014/10/16 | 180 | 4.1 | H[Nii] | 97 | |
| FN674 | 2014/10/16 | 180 | 4.1 | [Sii] | 60 | ||
| FN641 | 2014/10/16 | 80 | 4.1 | continuum | 179 | ||
| FN712 | 2014/10/16 | 80 | 4.1 | continuum | 209 | ||
| long-slit #1 | VPHG1200@540 | 2014/10/16 | 1800 | 2.6 | 3690–7280Å | 4.5 | |
| long-slit #2 | VPHG1200G | 2014/08/03 | 1800 | 1.3 | 3690–5680Å | 5.4 | |
| long-slit #3 | VPHG550G | 2014/08/22 | 1800 | 1.9 | 3710–7890Å | 9.5 | |
| long-slit #4 | VPHG1200G | 2014/08/03 | 1800 | 1.4 | 3690–5680Å | 5.4 | |
| long-slit #5 | VPHG1200G | 2014/07/31 | 870 | 1.5 | 3690–5680Å | 5.5 | |
| FPI | 1990–2001 | 1800 | 3–4 | H | 0.2–0.35 |
The spectral observations were performed with the 6-m telescope using the multi-mode SCORPIO (Spectral Camera with Optical Reducer for Photometrical and Interferometrical Observations) focal reducer (Afanasiev & Moiseev, 2005) and its new SCORPIO-2 version (Afanasiev & Moiseev, 2011) operating in the long-slit spectrograph mode. The scale along the slit was 0.36 arcsec per pixel. The CCD detectors EEV 42-40 in SCORPIO and E2V 42-90 (with the low sensitivity at the blue end of the spectrum) in SCORPIO-2 were employed. We observed the region around vdB 130 with five slit positions. The information on all the obtained spectra is summarized in Table 1.
Data reduction was performed in a standard way using the idl software package developed at the SAO RAS for reducing long-slit spectroscopic data obtained with SCORPIO, which includes bias subtraction, line curvature and flat field corrections, linearization, and air-glow lines subtraction. Dispersion correction of the spectra was performed using the reference spectrum of a He-Ne-Ar lamp obtained during the observations.
The observed region is densely filled with nebular emission (see Section 4.2). Because of that we were forced to construct the night-sky spectrum model using only a few positions along the slit in the direction of the dark cloud where the contribution of nebular emission to the spectrum is less significant. We interpolated these values of air-glow line intensities for all positions along the slit. The slit #3 does not cross the dark cloud, so in order to subtract the air-glow lines, we observed a nearby blank field where the nebular emission is absent. To convert the spectra to the absolute intensity scale, we observed the spectrophotometric standards BD+25d4655, BD+28d4211 and BD+33d2642 immediately after the object at a close zenith distance. Gaussian fitting was applied to measure the integrated fluxes of emission lines. For this purpose we used our own idl software adopted for SCORPIO data. In order to estimate uncertainties of the gaussian approximation a number of synthetic spectra with predefined signal-to-noise ratios were generated and fitted with the idl procedure. Then, the obtained uncertainty for a particular signal-to-noise ratio was used as an estimate of the uncertainty of the method.
To estimate the Hii line-of-sight velocities in the region, we used the results of long-term (1990–2001) H observations of the Cygnus gas-dust complex performed with the Fabry–Perot interferometer (FPI) mounted in the Cassegrain focus of the 125-cm reflector of the Crimean Laboratory of SAI MSU (Lozinskaya et al., 1997, 1998). The parameters of the instruments are listed in Table 1. We fitted the line profiles by one or several Gaussian curves assuming that the halfwidth of each profile component should be greater than that of the instrumental contour and signal-to-noise ratio is no less than 5. The peak velocities of each profile component were determined.
2.2 Narrow-band images
Optical images of two overlapping fields around vdB 130 were taken at the primary focus of the 6-m telescope of SAO RAS with SCORPIO-2 multi-mode focal reducer (Afanasiev & Moiseev, 2011) using filters FN655 and FN674, corresponding to H and [Sii] emission lines with central wavelengths of 6559 and 6733 Å and FWHM = 97 and 60 Å, respectively. The resolution was 0.36 arcsec per pixel. Since the FWHM of the used FN655 filter is broader than the separation between H and [Nii] emission lines, the image in this filter is contaminated by [Nii] 6548, 6584 Å emission. Given the results of our spectral observations (see Section 4.2), and taking into account the FN655 filter transmission, we conclude that the contribution of [Nii] lines to the obtained image may be up to 0.4 of the pure H emission. Hereafter we indicate with H the emission in the H line with this additional contribution due to the [NII] lines.
We used broader FN641 and FN712 filters centered on the continuum near the H and [Sii] emission lines to subtract the stellar contamination from the images obtained during the same night. In order to calibrate the emission line images to energy fluxes we observed the standard star BD+25d4655 immediately after observing the cluster region.
After the data reduction has been made in idl in the standard way (bias subtraction, flat field normalization, cosmic ray rejection, background estimation and subtraction) we combined images of both observed fields around vdB 130 in mosaics in [Sii] and H lines using our own idl procedure and assuming positions of several stars in one frame as a reference.
2.3 Archival data
This work is partially based on data from Spitzer and Herschel space telescopes. The region studied was observed by Spitzer space telescope within the framework of the ‘A Spitzer Legacy Survey of the Cygnus-X Complex’ program (Hora et al., 2011). The images at m, m, m, m, and m were downloaded from the project web-page111https://www.cfa.harvard.edu/cygnusX/ at the NASA/IPAC Infrared Science Archive. The Herschel archival data obtained within the framework of the ‘Hi-GAL: The Herschel Infrared Galactic Plane Survey’222https://hi-gal.iaps.inaf.it/higal/ program (Molinari et al., 2010) were downloaded from the Herschel Science Archive333http://www.cosmos.esa.int/web/herschel/science-archive.
3 Open star cluster vdB 130
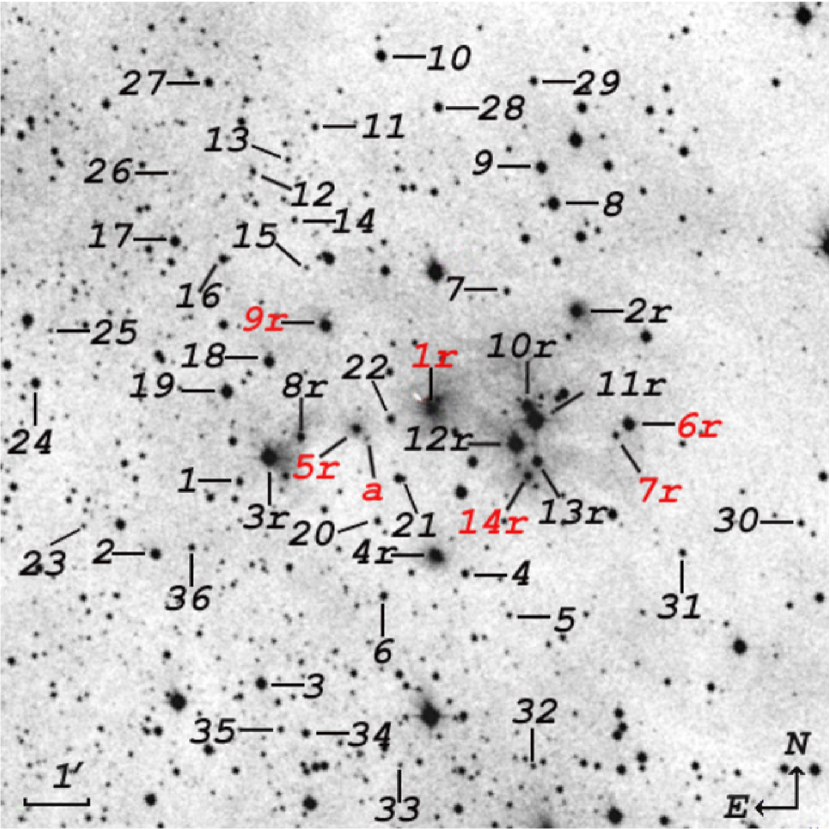
Initially designation ‘vdB 130’ has been applied to a reflection nebula associated with the BD+38 3993 star (HD 228789, vdB 130a) of spectral class B1-B2 (van den Bergh, 1966; Racine, 1968). The reflection nebula vdB 130 can be seen on the optical maps shown in Figures 1a and 2. Racine (1974) used photometric and spectroscopic data to select the group of 14 stars within from the nominal cluster centre, which could be considered as possible members of the sparse embedded cluster vdB 130 (Fig. 2). He noted an anomalous extinction law with , probably due to inhomogeneity of the interstellar medium in the proximity of the cluster. Kharchenko et al. (2013), with pipe-line processing technique, estimated the cluster parameters using data from PPMXL catalogue (Roeser et al., 2010) and considering stars with proper motion components close to the centroid with as cluster members. From 2MASS JHKs photometric data they derived a cluster age , distance kpc, colour excess mag, infrared interstellar absorption mag, and apparent radius of about .
3.1 Revision of the stellar content of vdB 130
Most possible members of vdB 130 move parallel to the galactic plane with mean proper motions (Kharchenko et al., 2013). In order to estimate the contribution of the disk differential rotation and that of the Sun peculiar velocity to the observed proper motions of cluster stars for heliocentric distances kpc, the parameters of Milky Way disk rotation and Sun’s velocity components with respect to the LSR (Local Standard of Rest) were taken from a detailed kinematical analysis of young stellar populations performed by Zabolotskikh et al. (2002) and Melnik & Dambis (2009). If we use a currently adopted value of the Sun’s distance from the Milky Way centre, kpc, all fields located along the line of sight in Cygnus directions with heliocentric distances in the kpc range, are nearly equally distant from the galactic centre, kpc. From the 3D Bottlinger equations we estimate mean apparent proper motion at 1.5–1.8 kpc heliocentric distances as .
These values are in a very good agreement with the proper motion components for vdB 130 derived by Kharchenko et al. (2013). Therefore, we cannot exclude that stars assigned to the open cluster by Kharchenko et al. (2013) represent in fact a non-bound stellar population of the extended association Cyg OB1, participating in overall galactic differential rotation. Moreover, the accuracy of available proper motions in this field does not allow distinguishing reliably true members of an unbound OB association from foreground and background field stars.
| Star # | UCAC4 | Tycho-2 | 2Mkey | (mag) | (mag) | (mag) | (mag) | (mag) | ||
| 1 | 647-086881 | 305146782 | 16.031 | 15.332 | ||||||
| 2 | 647-086916 | 305146998 | 14.212 | 13.582 | ||||||
| 2r | 647-086761 | 305106035 | 13.907 | 13.28 | ||||||
| 3 | 647-086873 | 305105199 | 13.555 | 13.067 | ||||||
| 3r | 647-086871 | 3151-00092-1 | 305105710 | 11.597 | 10.99 | |||||
| 4 | 647-086802 | 305105443 | 15.636 | 14.883 | ||||||
| 4r | 647-086813 | 305105485 | 13.852 | 13.125 | ||||||
| 5 | 647-086786 | 305105367 | ||||||||
| 6 | 647-086831 | 305105399 | 15.634 | 14.914 | ||||||
| 7 | 647-086791 | 305106069 | 16.781 | 15.847 | ||||||
| 8 | 648-090623 | 305106265 | 13.295 | 12.727 | ||||||
| 8r | 647-086860 | 305105753 | 15.466 | 14.642 | ||||||
| 9 | 648-090627 | 305106343 | 13.801 | 13.09 | ||||||
| 10 | 648-090649 | 305106565 | 13.986 | 13.352 | ||||||
| 10r | 647-086781 | 305105837 | ||||||||
| 11 | 648-090655 | 305106417 | 16.971 | 15.835 | ||||||
| 11r | 647-086776 | 3151-00165-1 | 305105806 | 10.755 | 10.214 | |||||
| 12 | 648-090662 | 305145860 | 16.503 | 15.197 | ||||||
| 12r | 647-086785 | 3151-00109-1 | 305105748 | 11.54 | 11.022 | |||||
| 13 | 648-090657 | 305106346 | ||||||||
| 13r | 647-086775 | 305105714 | ||||||||
| 14 | 647-086865 | 305106215 | 17.236 | 15.873 | ||||||
| 15 | 647-086859 | 305106104 | ||||||||
| 16 | 647-086890 | 305146111 | 15.409 | 14.717 | ||||||
| 17 | 647-086910 | 305146062 | 14.278 | 13.713 | ||||||
| 18 | 647-086874 | 305105912 | 13.898 | 13.214 | ||||||
| 19 | 647-086887 | 305146507 | 13.003 | 12.406 | ||||||
| 20 | 647-086833 | 305105567 | 16.57 | 15.55 | ||||||
| 21 | 647-086826 | 305105664 | 15.08 | 14.146 | ||||||
| 22 | 647-086829 | 305105800 | 16.35 | 15.262 | ||||||
| 23 | 647-086940 | 305146927 | ||||||||
| 24 | 647-086954 | 305146496 | 14.536 | 13.87 | ||||||
| 25 | 647-086949 | 305146341 | ||||||||
| 26 | 648-090681 | 305145870 | ||||||||
| 27 | 648-090678 | 305145626 | 15.483 | 14.753 | ||||||
| 28 | 648-090639 | 305106466 | 14.73 | 13.959 | ||||||
| 29 | 648-090628 | 305106531 | 15.776 | 14.911 | ||||||
| 30 | 647-086696 | 305036100 | 16.62 | 15.574 | ||||||
| 31 | 647-086727 | 305105507 | 16.397 | 15.427 | ||||||
| 32 | 647-086773 | 305105002 | ||||||||
| 33 | 647-086823 | 305104995 | ||||||||
| 34 | 647-086856 | 305105078 | 15.613 | 14.701 | ||||||
| 35 | 647-086866 | 305105086 | 17.342 | 15.927 | ||||||
| 36 | 647-086897 | 305146976 | 16.644 | 15.926 | ||||||
| 1r | 647-086816 | 305105825 | 15.085 | 14.225 | ||||||
| 5r | 647-086841 | 305105774 | 15.744 | 14.741 | ||||||
| 6r | 647-086746 | 305105807 | 13.152 | 12.124 | ||||||
| 7r | 647-086750 | 305105772 | ||||||||
| 9r | 647-086849 | 305105989 | 13.383 | 12.752 | ||||||
| 14r | 647-086779 | 305105685 |
Le Duigou & Knödlseder (2002) also used 2MASS data to study the stellar population and the structure of vdB 130, along with other 21 clusters in the Cygnus region. Unfortunately, the lack of detailed data on this cluster does not allow estimating its parameters reliably. It should be noted that application of King’s empirical density law (King, 1962) to describe the apparent distribution of stars in dense and highly non-uniform stellar fields distorted by inhomogeneous absorption is unlikely able to provide reliable estimates of important structure cluster parameters. Le Duigou & Knödlseder (2002) used the cluster distance derived by Racine (1974) and claimed vdB 130 as the richest cluster among those studied by them in the Cygnus region. It should be noted, however, that they used no kinematical criteria to select probable cluster members.
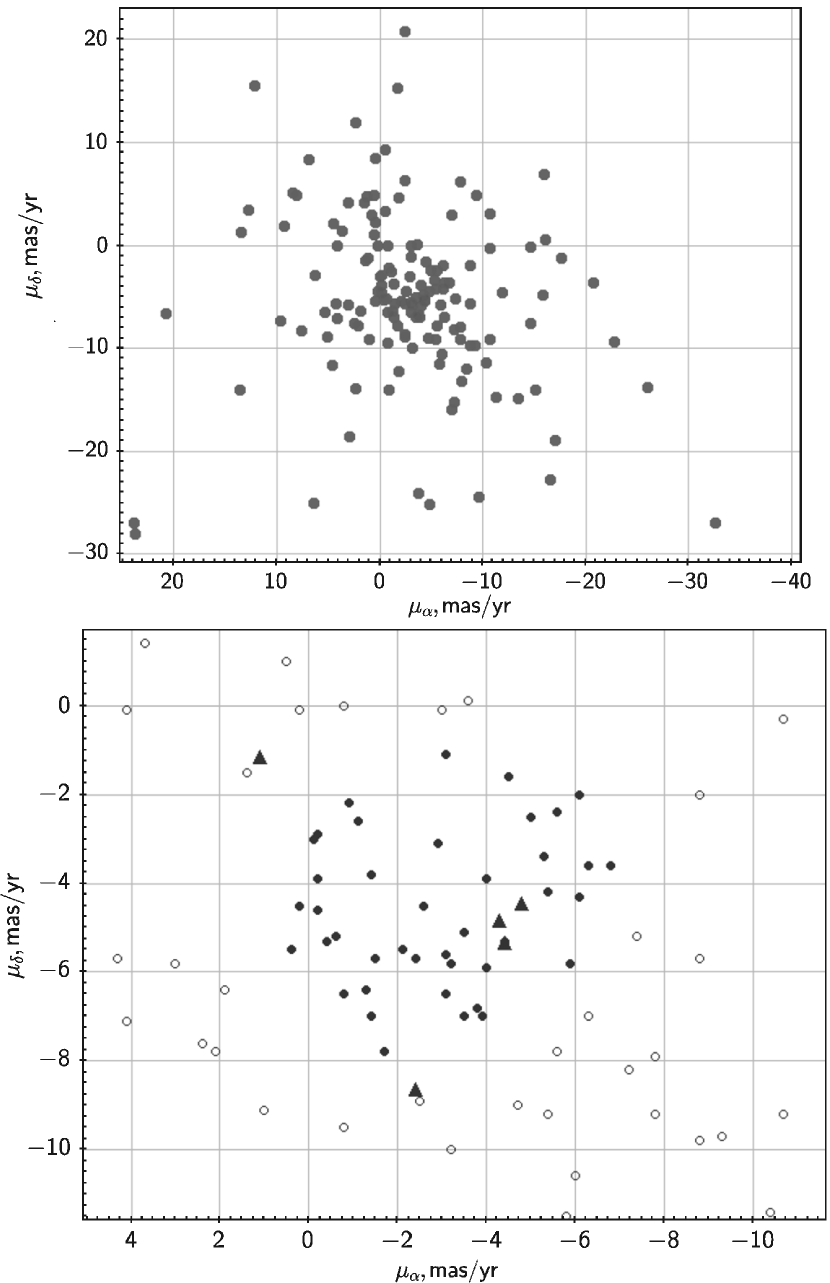
Despite the insufficient evidence supporting the nature of vdB 130 as a true gravitationally bound stellar cluster, further study of the stellar content of this star field, located at the distance of about 30–40 parsecs from the centre of the Cyg OB1 association, seems to be worthwhile. To find new possible members of vdB 130 and confirm the membership of stars earlier attributed to this cluster by Racine (1974) we reconsidered the data of 175 stars in a rather extended region with the diameter of 12 arcmin and central coordinates , , for which stellar proper motions can be taken from UCAC4 catalogue (Zacharias et al., 2013). The concentration of stars around the centroid defined by Kharchenko et al. (2013) is evident in the top panel of Fig. 3. This can be readily explained by the dominant contribution of disk differential rotation and solar motion to the apex.
We selected 36 UCAC4 stars as possible members of the cluster, with proper motion vectors that differ from the considered centroid by less than (see bottom panel of Fig. 3). This choice of a limiting value corresponds to the typical proper motion error in the UCAC4 catalogue, while in most cases the errors range from 1 to 10 mas yr-1. Adopting a larger threshold of proper motions, we risk of contaminating our sample with a large number of foreground and background field stars with large transversal velocities. (Note that the difference of at the distance of 1.5 kpc is equivalent to difference in transversal velocity. This value greatly exceeds the typical velocity dispersion in OB associations.)
Eight of 14 stars from Racine (1974) original list satisfy our proper motions criteria (Fig. 2). The extended list of possible cluster members is given in Table 2. Star identifications, proper motions and respective errors, 2MASS identifications and JHKs magnitudes, BV magnitudes (for some stars) were taken from the UCAC4 catalogue and are printed keeping original catalogue format. The columns of Table 2 contain the star number according to Racine (1974) list (with a letter ‘r’) and/or our list, its identification in the UCAC4 catalogue, proper motion components and corresponding errors, TYCHO2 catalogue (Hog et al., 2002) identification (for some stars), 2MASS catalogue identification (2Mkey) and magnitudes and errors, and magnitudes. In the bottom part of the table we show the data for stars from Racine (1974) list with motions outside of the adopted intervals (1r, 5r, 6r, 7r, 9r and 14r). Stars 1r and 5r from Racine (1974) original list, which are formally not considered as the cluster members, apparently have large velocities and move toward each other, with velocity components relative to vdB 130 and () , respectively. However, their proper motions are measured with very large errors, partly due to their asymmetric shapes in the optical images. Therefore, we cannot decisively exclude these two bright stars from the vdB 130 cluster members.
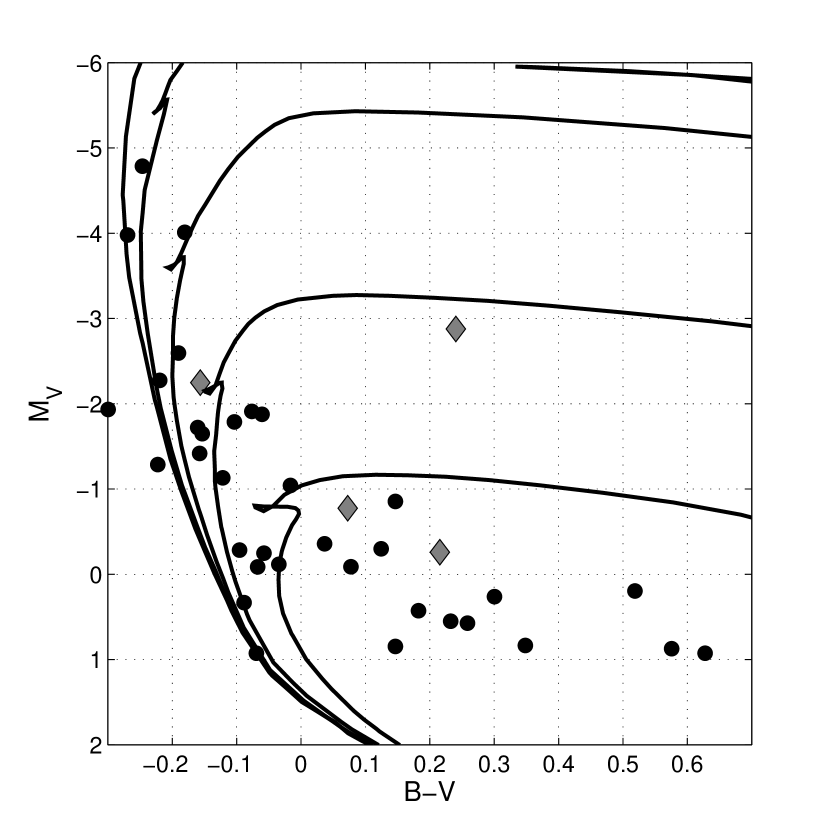
Based on the sample of stars shown in Table 2, we estimate basic characteristics (colour excess and distance) vdB 130, using and magnitudes and isochrone fitting technique. A colour-absolute magnitude diagram (CMD) vs. for 34 probable vdB 130 members with available data and Padova isochrones (Girardi et al., 2002) calculated for solar abundance and for ages Myrs are shown on the top panel of Fig. 4. If we take into account typical photometric uncertainty of mag and the real overdensity of bright stars, clearly seen on Kharchenko et al. (2013) atlas for vdB 130, the eye-fit gives an estimate for the cluster age of about 5-10 Myrs, assuming that the best-fit isochrone is a lower left envelope for stars with lowest colour indices.
Despite a relatively small scatter in proper motions, colour scatter along the axis is quite large (up to 0.6 mag for faint stars), confirming the substantial differential reddening over the cluster area. Minimal colour excess mag, and the apparent distance modulus mag. Under the assumption of a ‘normal’ extinction law (Cardelli et al., 1989; Martin & Whittet, 1990), with , true distance modulus can be estimated as mag. In this case the distance to vdB 130 stars having minimal reddening values can be estimated as kpc, in excess of Kharchenko et al. (2013) and Racine (1974) estimates. Of course, our estimates of the colour excess and the distance relate to bluest and brightest stars on the CMDs, which are expected to lie on the front side of vdB 130. It should also be noted that Schlegel et al. (1998) and Schlafly & Finkbeiner (2011) give total line-of-sight colour excess values in ranges mag and mag, respectively, for a 5 arcmin radius circle, centred in the field of the vdB 130 cluster. These data support Racine’s conclusion on possible large differential extinction in this region.
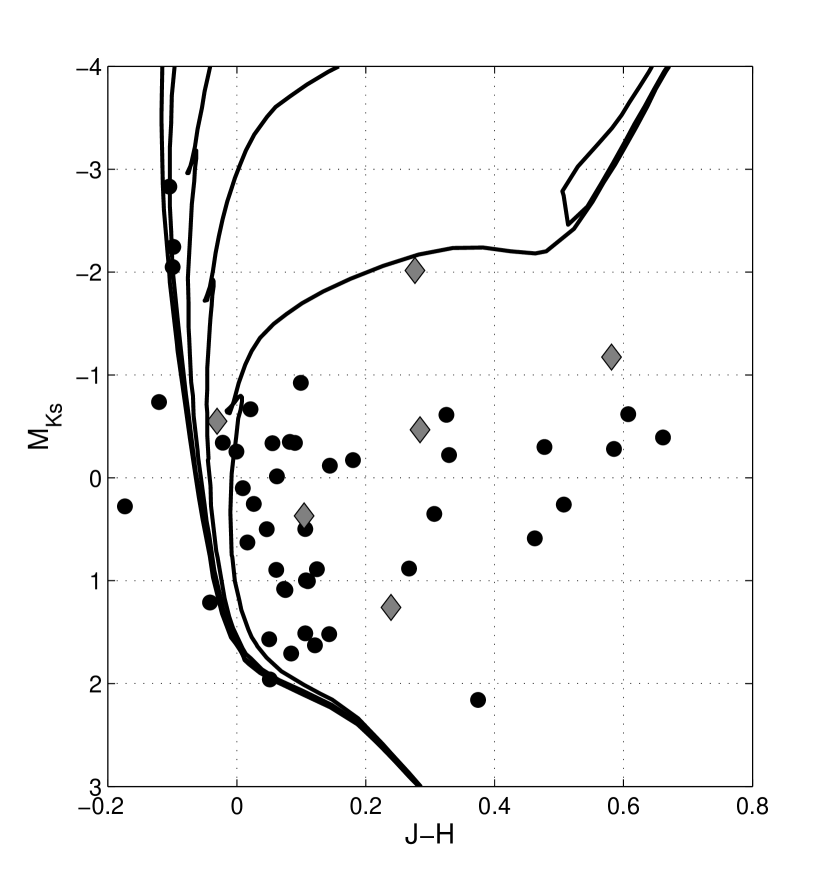
A somewhat smaller distance can be derived from infrared data. A vs. colour-magnitude diagram for 36 stars and the isochrones from (Bonatto et al., 2004), calculated for the same ages as for optics, are shown on the bottom panel of Fig. 4. Using the same fitting technique, we estimate colour excess mag and apparent distance modulus mag. Under the assumption of a ‘normal’ extinction law (Dutra et al., 2003; He et al., 1995), with , we estimate near infrared (NIR) absorption as , true distance modulus as mag, and the corresponding cluster distance as kpc, in a general agreement with the result of Kharchenko et al. (2013).
The differences between true distance moduli estimated independently from optical and NIR data can be attributed to abnormal features of the extinction law in the cluster direction. Obviously, any deviations from the generally accepted ‘normal’ extinction law should manifest themselves much stronger in the optical range than in the infrared. To match the distance estimates obtained from optical and infrared data, i.e. from vs. and vs. CMDs, we need to assume that in this field differs from the ‘standard’ value of 3.08 and reaches 4.5–4.8, in a good agreement with Moffat & Schmidt-Kaler (1976) result. Note, however, that this conclusion is rather preliminary, because distance moduli in optical and infrared have been really estimated from only 6–7 stars with the lowest colour excess. Moreover, some of these stars are located in the upper left part of the CMD, where the slope of the main sequence and isochrones is large enough and, thus, vertical shift of isochrones (i.e. apparent distance modulus) is determined not as reliably as the colour excess.
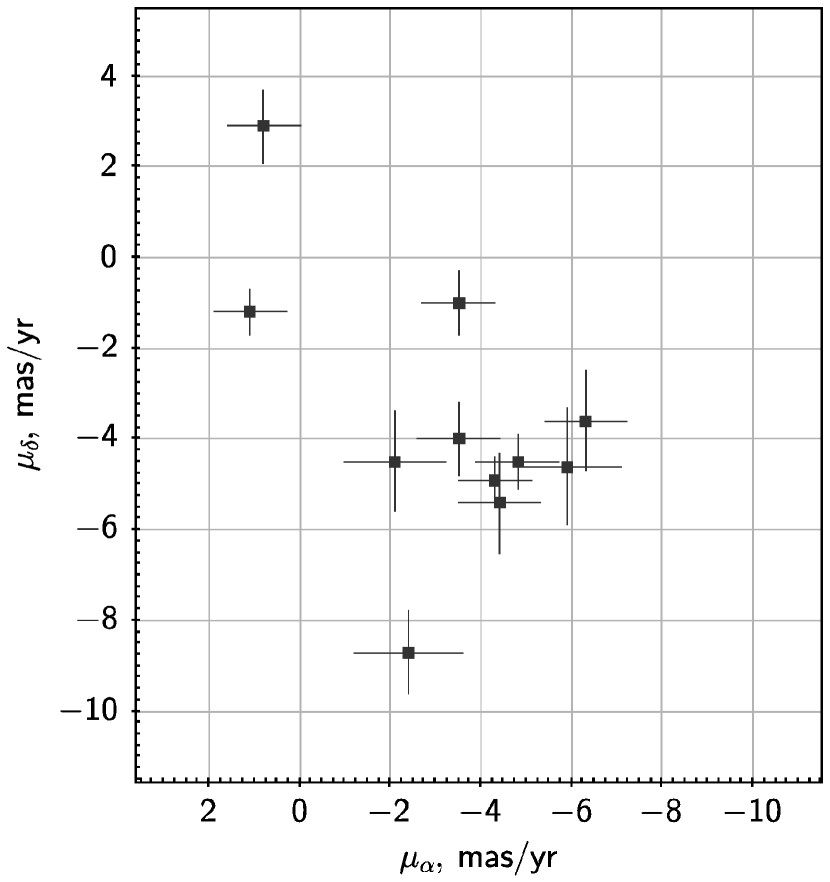
We now consider the group of stars with the most accurate measurements of proper motions. Three stars from TYCHO2 (Hog et al., 2002) are notable among them, with proper motion errors smaller than . On the proper motion () diagram seven stars form a compact group with diameter (Fig. 5). Four of them, 3r (TYC 3151-00092-1), 11r (TYC 3151-00165-1), 12r (TYC 3151-00109-1), and 19 (2MASS 305146507), are included in our list and they are the brightest stars in our sample. Mean components of their proper motion are approximately with the RMS scatter of . The difference between the mean motion and the Kharchenko et al. (2013) centroid (and, at the same time, contribution of disk differential rotation) is approximately . At the cluster distance ( kpc) this leads to difference of transversal velocities. We can conclude that these brightest members of the young open cluster vdB 130 associated with the Cyg OB1 give an idea on the apparent cluster motion on the sky. To draw more definite conclusions on the reality of the gravitationally bound young stellar group additional precise proper motions measurements and spectroscopic observations are needed that would allow refining the spectral classification and provide accurate radial velocity measurements.
3.2 Spectra of vdB 130 stars
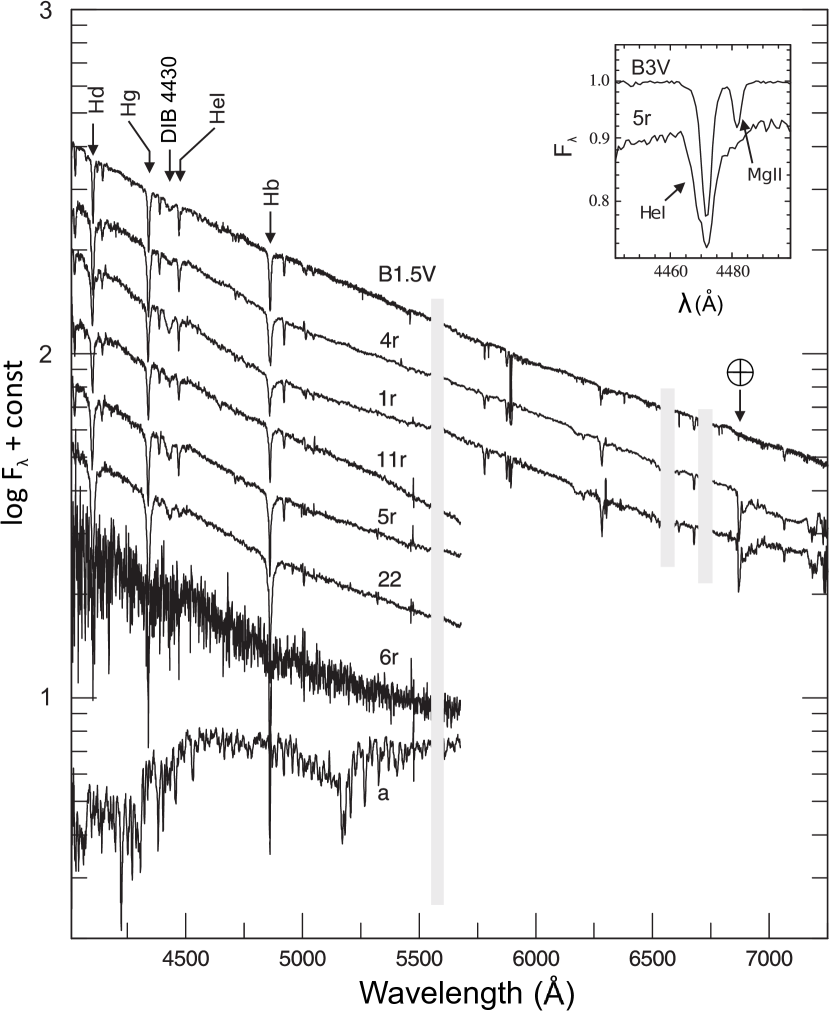
We used the spectra described in Section 2.1 to determine the spectral types of the stars 1r, 4r, 5r, 6r, 11r, and 22 (Table 2) and of the a star (Fig. 2). All the stars, except for the last one, have been classified as B stars. We analysed the a star in order to assess its possible contribution to the emission of the gas-dust nebula studied in Section 4.3 and classified it as a K4 star. Note that the spectral energy distribution of this star is practically undistorted by interstellar reddening, which is unlikely for a star located at the distance of vdB 130 (1.5–2 kpc), and this further confirms that a is a foreground field star.
According to our estimates, the spectral type of 1r and 11r is B1V up to 0.5 subtype; that of 4r and 5r is intermediate between B1V and B2V; and that of 6r and 22 is B5–B6V with an accuracy of 1 subtype. (We adopted the spectra of MK standards from Gray & Corbally 2009.) All the obtained spectra are shown in Fig. 6. According to Racine (1974), the spectral types of stars 1r, 5r, and 11r are B1–2V, B3–5V and B2III, respectively. However, in spectra of B3–5V-type stars conspicuous MgII 4481 Å absorption should be present (Gray & Corbally, 2009), while it is barely seen in the spectrum of star 5r (Fig. 6) that was obtained with a substantially higher dispersion than the spectrum obtained by Racine (1974). Racine (1974) estimated the luminosity class of the star 11r as III based on smaller widths of its Balmer absorption lines. However, the widths of these lines in our spectra of stars 11r and 5r are nearly the same (Fig. 6). Furthermore, one should take into account the presence of Balmer emission lines in the gas-dust nebulae surrounding the considered stars which can distort the actual appearance of stellar absorption lines.
Approximating the total interstellar and circumstellar extinction by the normal interstellar extinction law allows estimating the colour excess from the spectral energy distribution (SED). The colour excesses of the investigated stars differ slightly from each other, being equal to 1.1 mag for 4r and 11r, 1.3 mag for 1r, 1.4 mag for 5r and 22, and 1.5 mag for 6r. The relative continuum flux difference between the dereddened SEDs of all the studied stars and the SEDs of standard stars of the corresponding spectral types (Valdes et al., 2004; Silva & Cornell, 1992) does not exceed 10 per cent at all wavelengths in the considered spectral band.
Red spectra (up to Å) were taken only for stars 1r and 4r. In the case of the star 1r the red spectrum complements rather well the spectrum covering the 4400–5580 Å wavelength interval and yields the extinction parameters which do not differ substantially from those inferred from the bluer spectrum. On the other hand, the continuum of the 4r star is reproduced much better assuming a non-standard total-to-selective extinction ratio of , which agrees with the estimate presented in the previous section. The colour excess in this case is mag.
4 Interstellar medium in the vdB 130 area
4.1 Molecular cloud and ionized hydrogen in the vicinity of the cluster
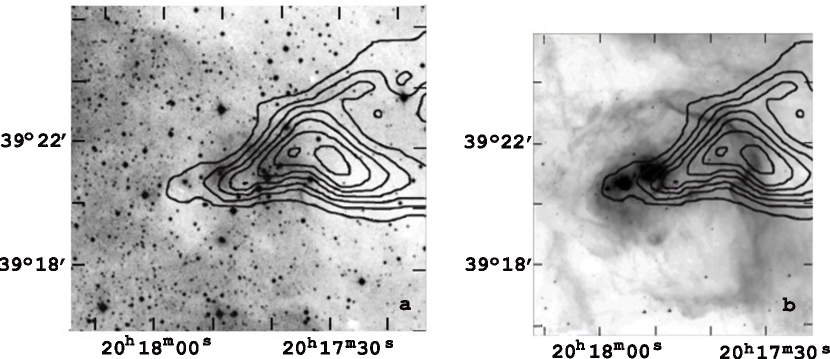
VdB 130 is located in projection near the north-western border of an extended optical, radio and IR shell around Cyg OB1 (Fig. 1)(Lozinskaya & Sitnik, 1988; Lozinskaya & Repin, 1990; , 1992). This supershell is also clearly discernible at all wavebands observed with the Spitzer space telescope (Hora et al., 2009) and at large-scale CO distribution (Schneider et al., 2007). The distance to the association is 1.5 kpc (Garmany & Stencel, 1992; Sitnik & Mel’nik, 1996). From the analysis of the cluster stellar population, we estimate that within errors Cyg OB1 and vdB 130 are located at the same distance (see sect. 3.1).
The studied region is projected onto a cometary molecular cloud (Fig. 1b, 7a) having a length of (cloud A in Schneider et al., 2007). The cloud is stretched along the galactic latitude, with its ‘head’ protruding inside the Cyg OB1 supershell. The shape of the CO cloud hints that its ‘head’ is actually a pillar on the inner supershell border. Some stars of vdB 130 are seen in the region of the cloud head, and all the other stars surround it (Figs. 2, 7a). The CO emission from the cloud spans the velocity interval (Schneider et al., 2007). The fact that the median line-of sight velocity for 34 out of 70 Cyg OB1 stars is with a standard deviation of (Sitnik, 2003) suggests that the association and the cloud are close neighbours in space. The presence of a reflection nebula and considerable scatter of interstellar extinction estimates toward cluster stars can also be an indirect indicator of a link between vdB 130 and the CO cloud (Racine, 1974).
The differential reddening could also be possible if the cluster is in the background of the cloud, but the extinction values found above are too low for this to be true. Indeed the minimum in the cluster area is 0.79 mag, which corresponds to only of the order of 2.5 mag. On the other hand, some stars, projecting onto the cloud head, have colour excesses of the order of 1.3–1.5 mag. Assuming (see Section 3), the extinction toward these stars generally agrees with the estimates from Schneider et al. (2007) for their Cloud A (5–8 mag).
Our FPI observations can be used to find kinematic evidence in favour of the physical connection between the molecular cloud and ionized hydrogen in the cluster outskirt. The data exhibit single-component H profiles toward vdB 130 with peak line-of-sight velocities ranging from 0 to . These velocities characterize gas whose motions are mostly due to Galactic rotation and streaming motions caused by spiral density waves. To analyse characteristic systematic motions of ionized hydrogen in the studied region, we use a ‘diagram of occurrence’ of line-of-sight velocities (see, e.g. Arkhipova et al. 2013 and references therein). Characteristic line-of-sight velocities of the ionized gas in the region are defined as average values at half-maximum of the corresponding diagram together with root-mean-square errors of their estimates. The obtained interval of the most commonly occurring ionized gas velocities toward vdB 130 is (based on 24 velocity measurements out of 26) and is shifted in the positive direction relative to velocities of CO emission in the head of the cloud (see Fig. 2 in Schneider et al. 2007).
Note that in the tail of the cometary molecular cloud (about arcmin westward of vdB 130), where the influence of cluster stars should be less pronounced, Hii velocities () do indeed coincide with CO velocities in the same area (). This is an evidence in favour of the physical connection between the CO cloud and ionized hydrogen in its environment. Minor differences in of molecular and ionized gas, observed in the cloud head and in its vicinity, may indicate the influence of winds and radiation from vdB 130 stars onto the surrounding gas.
Inside the supershell around Cyg OB1, profiles with multiple peaks are observed. Specifically, in addition to the main component, they exhibit weak high-velocity features in the wings of the H line. These shifted components reveal local high-velocity gas motions caused by stellar winds and/or supernova explosions (with a possible contribution from distant Hii regions in the Perseus arm at large negative velocities).
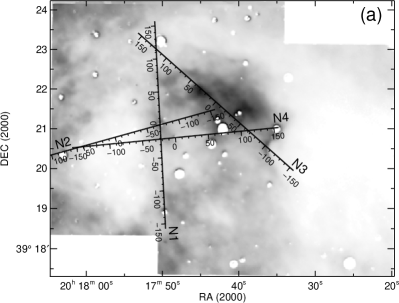
The molecular cloud can be affected by UV radiation and stellar winds from at least two association members, namely, HIP100173 (O7e) and HD193595 (O8), located approximately along the extension of the cometary cloud axis, in 16 arcmin (7 pc) and 27 arcmin (12 pc) from the considered region (Fig. 1). These stars are the nearest members of the Cyg OB1 association with strong stellar winds (Blaha & Humphreys, 1989; Garmany & Stencel, 1992). However, the entire vdB 130 star-gas-dust complex is located close to the boundary of the supershell surrounding Cyg OB1. Therefore, the projected expansion velocity of the shell should be close to zero in the considered region. Indeed, as we pointed out above, spectra taken in the vicinity of vdB 130 exhibit mostly single-peaked H profiles.
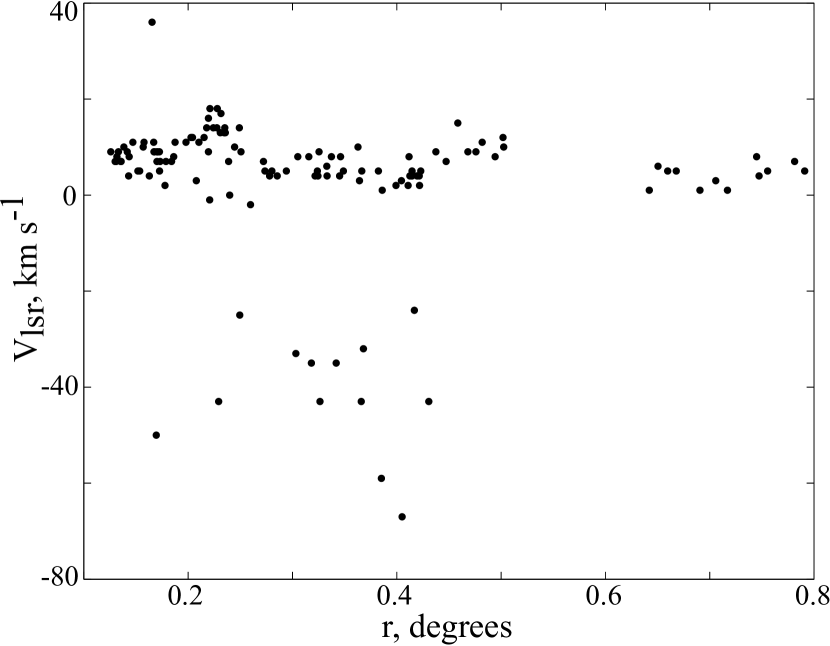
In Fig. 8 we show the PV-diagram, i.e., the plot of Hii line-of-sight velocities vs. the projected distance to the HD193595 star. (The area for which this PV-diagram is constructed is shown with a white rectangle in Fig. 1a.) High-velocity Hii motions are evident within from HD193595. This separation corresponds to the distance from the star to the outer boundary of the supershell and to vdB 130.
Thus, the cometary shape of the cloud, the close spatial location of the cloud and the cluster, highly non-uniform reddening of vdB 130 stars, and the distribution of line-of-sight velocities of ionized gas in the cloud neighbourhood are all indicative of a possible physical connection between the CO cloud, Cyg OB1, and vdB 130.
However, the exact nature of this connection is not immediately clear. CO emission implies relatively high density and correspondingly high extinction, so that some cluster stars are at least partially embedded in the absorbing material with of the order of 3–6 mag. However, the CO emission intensity in the direction of vdB 130 implies higher extinction (Schneider et al., 2007) (see above) so that at least some CO-emitting gas should be located behind the cluster. It is also possible that some CO emission comes from the dense material related to infrared features discussed below.
4.2 Emission spectrum of the interstellar medium toward vdB 130
Figure 9 shows various [Sii]6717,6731 and H emission maps of the area surrounding vdB 130, based on our observations performed with the 6-m telescope of the SAO RAS. An H image is shown in Fig. 9a. In Fig. 9b the H map is combined with a [Sii] map and an m Spitzer map.
In the interstellar medium surrounding stars 10r, 11r, 12r, and 13r a well-defined stratification of H and [Sii] emission can be seen, which is typical of Hii regions. Specifically, a ‘green region’ dominated by H emission surrounds the stars mentioned above in the centre and the lower part of Fig. 9b. (Blue halos around stars Fig. 9c are wings of a point spread function in H). In the north-western part a ‘yellow region’ is located, where both H and [Sii] lines are bright. (Note that a similar region in the south may be partly obscured by the material responsible for the cluster reddening). The periphery of the H emitting area is dominated by ‘reddish’ regions with enhanced [Sii]6717,6731/H line intensity ratio. Dark dust clouds are located to the west of the star 6r and to the east of the star 1r and around 5r, and also in the northern part of the region (these regions will be discussed in Section 4.3).
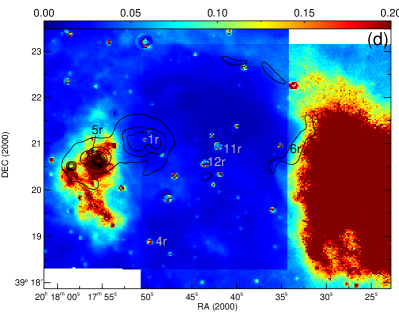
The stratification of the emission is evident in the image showing the [Sii]6717,6731/H line intensity ratio (Fig. 9c), which is traditionally used as a shock indicator. At an average electron density cm-3, as derived from the [Sii] flux ratio, [Sii]H is an evidence of a substantial contribution from the emission of gas behind the shock front (see, e.g., Allen et al. 2008). In Fig. 9c regions with shock signatures are shown in red. (Note that the [Sii]6717,6731/H flux ratios may be underestimated because the image of the region actually combines H and [Nii]6548,6584 lines (see Section 2), and this further supports our conclusion about the possible presence of shocks.)
The most expressive shock manifestation is an X-shaped structure in the eastern part of the region between stars 1r and 5r (Fig. 9c). However, high [Sii]/H intensity ratio in this area may also be due to low intensities of the lines resulting in large measurement errors. To separate the two factors (shock excitation and observational errors), in Fig. 9d we show a map of uncertainties of the derived [Sii]/H intensity ratio at each pixel. The comparison of Fig. 9c and Fig. 9d shows that the eastern part of the X-shaped structure and the western part of the observed region are characterized by significant uncertainties of the [Sii]/H ratio and that the enhanced [Sii]/H ratio in these areas most likely arises due to very low intensity of the lines. Hence only the western part of the X-shaped structure can be considered as an indication of a shock front.
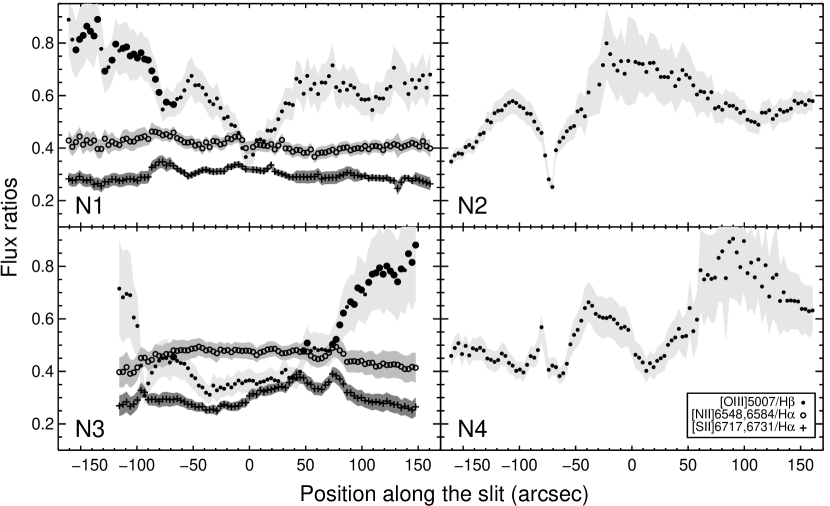
The spectroscopic observations of the area confirm that gas emission in the vdB 130 region is actually a combination of photoionized gas emission and (in some directions) shocked gas emission. The [Nii]6548,6583/H line ratio along the slits (Fig. 10) exhibits high values in the same regions where the [Sii]/H line ratio is high. The average value of the [Nii]6548,6583/H line ratio is 0.40–0.45. The [Oiii]5007/H ratio along the slits varies from 0.3 to 0.9. Local spikes of this ratio in Fig. 10 may be associated with individual stars, e. g., 4r (slit N1, –70…–150) or 11r and 12r (slit N4, 50–150) (see also Fig. 9a). The enhanced [Oiii]5007/H ratio in the region of the dust cloud to the east of the star 1r (slit N2, -70…70) may be due to large measurement errors of weak lines, as in the case of the [Sii]/H ratio.
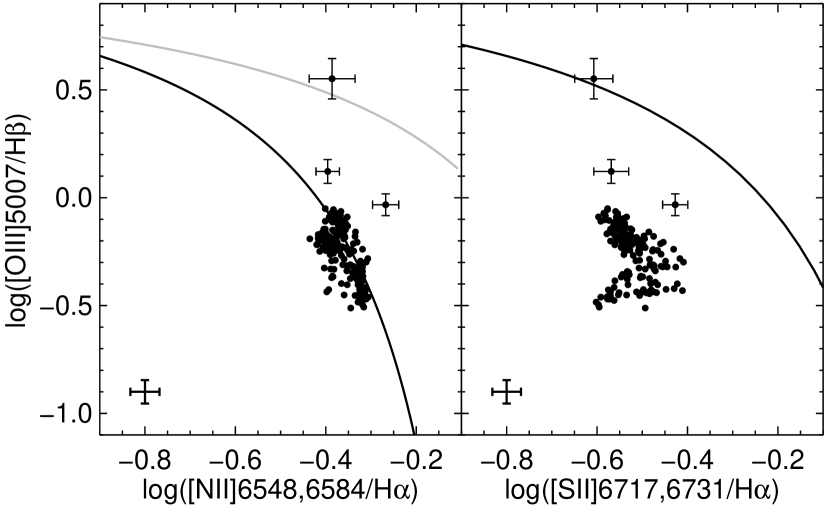
In Fig. 11 we relate our observed diagnostic diagrams vs. and vs. to theoretical photoionization models of Kewley et al. (2001) and Kauffmann et al. (2003). Black lines mark the upper boundaries for possible line intensity ratios in the case of purely photoionization excitation mechanism. A grey line in the left panel separates a domain with [Nii]/H and [Oiii]/H ratios typical of shocks (above the grey line) from the domain with the combined contribution of both mechanisms (between the black and grey lines). Evidently, in the studied region we observe mostly photoionization line excitation. However, a number of data points in the left panel fall inside the ‘composite’ domain. In Fig. 10 these points are marked by bigger circles on the profiles of the [Oiii]/H ratio. Comparing Fig. 10 (slits N1 and N3) and Fig. 9a, we see that domains with combined emission mechanism coincide with the shell that is traced by the enhanced [Sii]/H ratio (Figs. 9c,d), indicative of a possible contribution from shocks. In particular, an analysis of spectroscopic observations confirms the combined emission mechanism in the western segment of the X-shaped structure, which is a part of the shell-like pattern visible in the [Sii]/H distribution (see slit N1, -80…-70 in Fig. 10).
Thus, we conclude that an Hii region with possible shock signatures at its periphery is observed around a group of vdB 130 members. Unfortunately, we were able to perform a comprehensive analysis only for the N1 and N3 slits. The wavelength ranges for the other two slits include only [Oiii] and H lines.
We also used spectra N1 and N3 to estimate the gas metallicity. The [Oiii]4363 line that is needed for estimating was too weak and we therefore could not apply the so-called direct method, which requires the knowledge of the electron temperature. An analysis of the gas metallicity based on the empirical method from Pilyugin & Mattsson (2011) calibrated by bright [Nii] and [Sii] lines yielded a close-to-solar oxygen abundance of .
4.3 Dust emission in the vdB 130 area
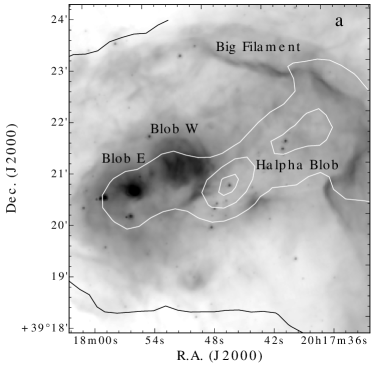
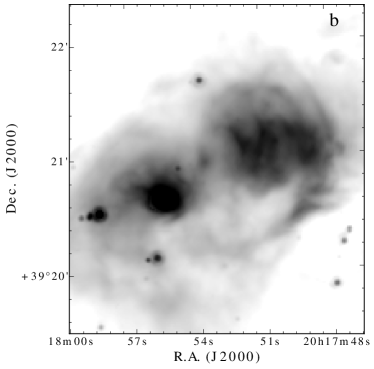
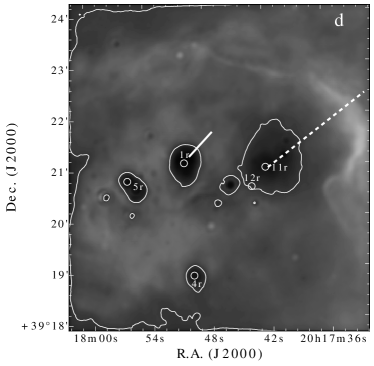
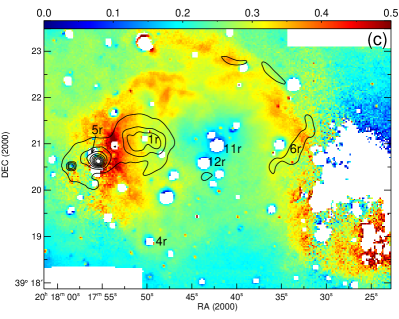
Near-infrared images of the studied region in various Spitzer and Herschel bands are presented in Figs. 1b, 7b and 12a–c. Infrared emission at 8 m and 24 m traces an unclosed shell with a diameter of arcmin (about 3 pc) and a thickness from 0.5 to 1 arcmin (about 0.4 pc), which encircles most of the stars of vdB 130. The shell is open in the direction of Cyg OB1 association toward the east and partially overlaps with the molecular cloud toward the west (Fig. 7b). The brightest part of the shell is further referred to as Big Filament. Inside the shell there is an extended area of diffuse infrared emission with two blobs (hereinafter Blob E and Blob W), easily discernible on both IRAC and MIPS (24 m) maps (Fig. 12a,b,c). These blobs and the surrounding halo of bright infrared emission coincide in projection with the head of the molecular cloud (Fig. 7b) and are embedded into the region emitting at 160 m, shown with contours in Fig. 12c. Blobs W and E have sizes of arcmin (0.4 pc) and arcmin (0.2 pc), respectively.
In Fig. 12b we show an expanded area of the 8 m emission map around the infrared blobs. Blob W (western) is more extended and represents a nearly round patch of IR emission, with a sickle-like filament extending from its southern side. The fine structure with other filaments within the blob is visible at 8 m (as shown in more detail in Fig. 12b). The eastern blob (Blob E) is more compact and actually looks almost like a point source. These blobs and a sickle-like filament are also visible on a 24 m map (Fig. 12c).
Appearances of 8 and 24 m images are similar but not identical which is evident on the plot representing their ratio (Fig. 12d). To produce this plot, we have convolved the 8 m map to the resolution of the 24 m map, using an appropriate kernel provided by Aniano et al. (2011). While over most part of the studied region the ratio exceeds 1, there are few patches where it is smaller than 1, down to about 0.2. In Fig. 12d these patches are encircled by white contours corresponding to . Smallest values of are observed toward Blob E and Blob W, but there is another quite extended region where is less than 1, located westward of Blob W, in the centre of a structure delineated by a curved part of Big Filament.
A dissimilarity between 8 m and 24 m emission is a well-known feature of the ISM both in our Galaxy (Watson et al., 2008; Deharveng et al., 2010) and in other galaxies (Bendo et al., 2008). In our Galaxy interiors of Hii regions tend to be brighter at 24 m while their borders are observed as ring-like structures on 8 m maps. It is tempting to assume that dark spots in Figure 12d, where 8 m emission is suppressed relative to 24 m emission, indicate the presence of Hii regions. Below we discuss whether or not other evidences may be presented in favour of this hypothesis.
We start from the region encircled by Big Filament, which coincides with the region of ionized gas emission discussed in the previous subsection. This region is relatively faint at 8 m and is filled with diffuse 24 m and H emission (hereinafter we refer to it as H Blob as indicated in Fig. 12a). Big Filament itself is bright at 8 m, less bright at 24 m, and dark in H emission. It is also clearly visible on 70 and 160 m images, obtained with Herschel, and stays discernible up to 500 m. The ring of infrared emission has been also mentioned in Schneider et al. (2007).
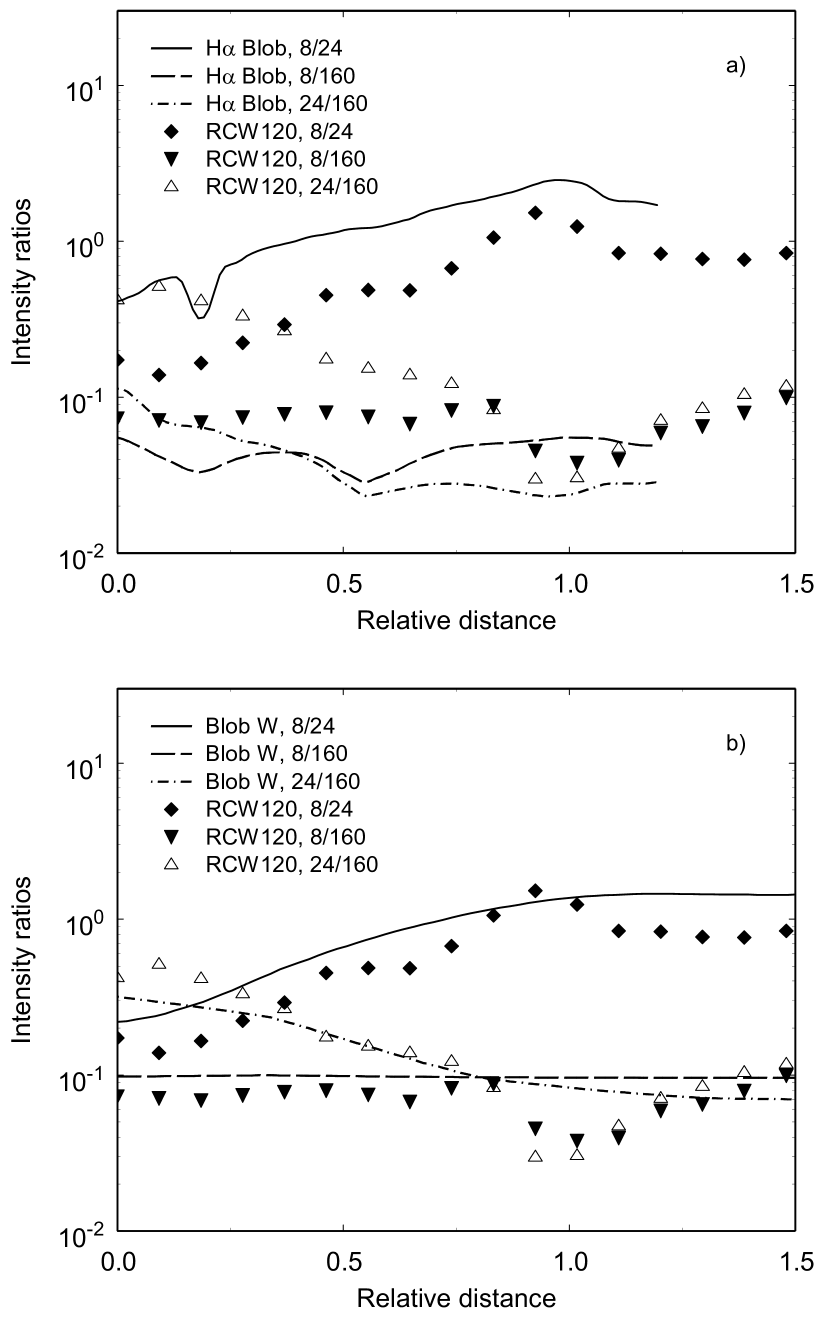
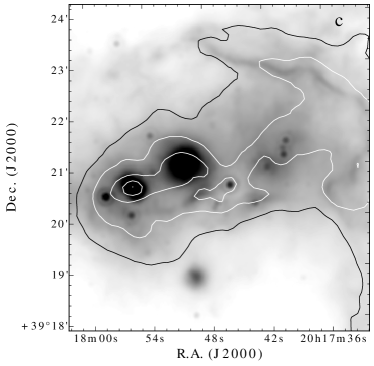
The entire infrared emission pattern looks similar to Galactic Hii regions. To emphasize this similarity, in Figure 13a we show how various infrared flux ratios change with the relative distance from the region centre along the cut shown in Figure 12d with a dashed line. Also shown in Figure 13a are the same ratios in the Hii region RCW 120, one of the best studied ‘infrared bubbles’ in our Galaxy (Deharveng et al., 2009; Anderson et al., 2010; Pavlyuchenkov et al., 2013). For all the three ratios trends are similar. The ratio steadily grows from the region centre (marked by the smallest value of ) toward its border, while the ratio decreases along the same cut down to 0.5 and then stays nearly constant. The ratio of flux to flux exhibits the smallest variation staying approximately constant over the entire region. Both 8 m and 24 m maps have been convolved to a 160 m resolution using kernels from Aniano et al. (2011).
Blob W is even more similar to RCW 120 in this respect as shown in Figure 13b, with its interior being relatively brighter at 24 m than H Blob. Intensity ratios are shown for the cut indicated with a solid line in Fig. 12d. Blob E is not resolved well enough for a detailed comparison, but it is also faint at 8 m, bright at 24 m, and shows little variation in the ratio. To ensure that this similarity is not bound exclusively to RCW 120, we have compared intensity ratios in our blobs with the corresponding ratios in a few other infrared bubbles from the Churchwell et al. (2006) catalogue and found the same distribution on the infrared fluxes. Thus, flux ratios in Spitzer and Herschel bands in all the three blobs shows spatial variations that are typical of the Hii regions in the Galaxy.
We have also performed an aperture photometry in Spitzer IRAC bands for several locations along Big Filament, along the sickle-like feature in the southern part of Blob W, and also for Blob E and a nebulosity surrounding the star 4r (with the central source contribution subtracted). In each band surface brightness was measured for a circular region with a diameter of 5 arcsec. Background emission was estimated in extended regions with the lowest surface brightness within 100 arcsec from the studied objects. The regions listed above are indicated in Fig. 14a, while their infrared colours [3.6]–[4.5] and [4.5]–[5.8] are shown in Fig. 14b.
All the regions can be separated into three groups according to their relation to the domains described in Ybarra et al. (2014). The first group comprises all the locations in Big Filament along with the w1 and w2 regions in the sickle-like feature. These regions have negative [3.6]–[4.5] colours and [4.5]–[5.8] colours exceeding 3. According to the results of Ybarra et al. (2014), these colours are typical of a photon dominated region (PDR) at a boundary of an Hii region with a moderate absorption () and of the order of –1. Here is the FUV radiation field in units of the Draine field (Draine, 1978), and is the gas density. Our estimate for the electron density of the order of 100 cm-3 implies . Note that in our picture all these regions are related to the boundary of the Hii region around vdB 130.
The second group consists of Blob E and the w3, w4, and w6 regions, that belong to Blob W. Their colours do not fall into the domain considered in the work of Ybarra et al. (2014), with the [3.6]–[4.5] colour being positive and the [4.5]–[5.8] colour being slightly below 3. Extrapolating results of Ybarra et al. (2014), we may assume that absorption in these directions is higher than and is lower than –2. We cannot expect that is low in the region of bright near-IR emission, so lower is probably caused by higher density (consistent with higher absorption). Note that extinction values inferred from Ybarra et al. (2014) diagram agree with our estimates.
Finally, the third group in our sample includes the w5 region and the nebulosity around the star 4r. Location of the w5 region nearly coincides with the location of the star 1r. According to Ybarra & Lada (2009), their colours ([3.6]–[4.5] and [4.5]–[5.8] ) can be explained by the emission of the low-temperature shocked H2 gas.

Thus, we may tentatively conclude that H Blob, Blob W, and Blob E and may be other regions with suppressed 8 m emission, also seen in Fig. 12d (like a region around the star 4r), are actually Hii regions surrounding young massive stars. In particular, the infrared emission properties of H Blob are entirely consistent with our conclusion on the Hii region that surrounds the cluster vdB 130, based on the optical spectra. Blob W and Blob E can be excited by the stars 1r (B1V) and 5r (B1V-2V), respectively (Fig. 2), while H Blob can be excited, among others, by stars 11r (B1V) and 12r, which are members of the cluster vdB 130.
Being more extended and fainter in all infrared bands up to 160 m, H Blob is probably older than the other Hii regions in this area. We note that Big Filament which borders H Blob from the west, partially encircles a ring-like feature, seen on the map of the [Sii]/H ratio (Fig. 9b), which is also visible as an absorption feature on the DSS image. The [Sii]/H ratio is somewhat enhanced along this ring-like feature relative to its interior, indicative of a shock (Fig. 9c). As we mentioned in the previous subsection, in the eastern part of the region we observe a clear signature of a shock. The sickle-like feature bordering Blob W from the west may have been formed by H Blob expansion, when the ionization front has started to engulf a parent clump for Blob W.
The presence of Hii regions in the vicinity of vdB 130 stresses the problem of its age overestimation. If H Blob is indeed excited by the cluster star(s), their interaction should have started quite recently, after the cluster itself had formed. It must be noted that the stars 1r and 5r, which we propose as exciting stars for Blob W and Blob E (as there are no other B stars in the blobs’ vicinity), may not be cluster members (see above). It is interesting that the three blobs are located at the tip of a long chain of millimetre sources that extends to the west far beyond Big Filament (Motte et al., 2007). This also hints that the CO cloud, also visible in the dust continuum, may be a remain of a bigger structure that has been destroyed by the expanding supershell. It is also possible that the interaction between the pre-existing cloud and the expanding supershell has moved some molecular material in the vicinity of the cluster B-stars, initiating the formation of H Blob.
We may ask then whether Blob W and Blob E formation has been triggered by an expansion of H Blob. Their location hints at some causal link with the shell, but the available information is definitely not sufficient for any firm conclusion.
5 Conclusions
Detailed analysis of stellar populations and the interstellar medium in the vicinity of the cluster vdB 130 was performed, using optical observations taken with the 6-m telescope of SAO RAS and the 125-cm telescope of the Crimean Laboratory of SAI MSU as well as archival data from Spitzer, Herschel Space Telescopes, 2MASS and UCAC4 projects.
The following results are obtained.
-
1..
New revision of the stellar population of vdB 130 revealed 36 stars with proper motions differing by less than from the centroid determined by Kharchenko et al. (2013) (). The sample shows large scatter of colours (0.6 mag for faint stars) that can be considered as an evidence for substantial differential reddening across the cluster. The minimum colour excess mag, and the apparent distance module mag, whereas in NIR mag and mag. Since NIR data are corrupted by large and inhomogeneous extinction in much lesser extent then in optics, we consider cluster parameters obtained from 2MASS photometric data as more reliable. Photometric data are consistent with young cluster age ranging from 5 to 10 Myrs and distance of about kpc.
-
2..
The physical relation between vdB 130, which is located near the outer boundary of a supershell surrounding the Cyg OB1 association, and the cometary molecular cloud with the size of (Schneider et al., 2007) is corroborated by (1) similar distances to the cluster and the association (1.5 – 1.8 kpc), which agree within the errors, and (2) the agreement of line-of-sight velocities of the cloud (), Cyg OB1 stars, and hydrogen ionized by these stars (). The molecular cloud is located in the region influenced by the stellar wind and radiation of Cyg OB1 and vdB 130 stars.
-
3..
Most vdB 130 stars are surrounded by an IR shell having a diameter of 3 pc, which is visible at all Spitzer bands (Figs. 7b and 12). The inner part of the shell is partially filled with diffuse emission at 8 and 24 m, with 24 m emission being brighter than 8 m emission. Such a relation between 8 m and 24 m is typical for Galactic Hii regions, so we suggest that this shell marks the location of an ionization front in an Hii region, H Blob, which is also visible on our H and [Sii] maps and is probably produced by the hottest stars of vdB 130. At the eastern border of the Hii region encircled by the IR filament signatures of a weak shock are identified.
-
4..
There are at least two other Hii regions in the area, Blob W and Blob E, which are more compact and mostly visible in infrared maps. Blob W and Blob E are excited by B1V and B1V-B2V stars, respectively. On the maps of the [Sii]/H ratio Blob W is delimited from the east by an arc-like feature which may be produced by the expansion of H Blob.
-
5..
Blob W and Blob E may represent the latest step in a star formation sequence in the area related to the pillar-like CO cloud, but in general the star formation history across the area seems to be quite complicated.
ACKNOWLEDGEMENTS
We are grateful to the anonymous referee for her/his extremely thorough reading of the manuscript and numerous comments and suggestions.
This work is based on observations obtained with the 6-m telescope of the Special Astrophysical Observatory of the Russian Academy of Sciences. The observations at the 6-metre BTA telescope were carried out with the financial support of the Ministry of Education and Science of the Russian Federation (agreement No. 14.619.21.0004, project ID RFMEFI61914X0004).
This work is based in part on observations made with the Spitzer Space Telescope, which is operated by the Jet Propulsion Laboratory, California Institute of Technology under a contract with NASA and on observations made with the Herschel, which is an ESA space observatory with science instruments provided by European-led Principal Investigator consortia and with important participation from NASA.
This publication makes use of data products from the Two Micron All Sky Survey, which is a joint project of the University of Massachusetts and the Infrared Processing and Analysis Center/California Institute of Technology, funded by the National Aeronautics and Space Administration and the National Science Foundation and the National Science Foundation.
This research has made use of the SIMBAD database, operated at CDS, Strasbourg, France.
The study of the ISM around vdB 130 was supported by the Russian Foundation for Basic Research (projects 14-02-00027, 14-02-00472 and 15-07-04512) while the stellar population analysis of the vdB 130 cluster was supported by RSCF grant No. 14-22-00041.
DSW was supported by the President of RF grant NSh-3620.2014.2 and by the OFN RAS program ‘Interstellar and Intergalactic Medium: Active and Extended Objects’.
AVM is also grateful for the financial support of the non-profit ‘Dynasty’ Foundation.
We used the results of H interference observations performed with the 125-cm reflector of the Crimean laboratory of Sternberg Astronomical Institute of Moscow State University and the results of CO line radio observations.
References
- Afanasiev & Moiseev (2005) Afanasiev V.L., Moiseev, A.V., 2005, Astron. Letters, 31, 194
- Afanasiev & Moiseev (2011) Afanasiev V.L., Moiseev A.V., 2011, Baltic Astronomy, 20, 363
- Allen et al. (2008) Allen M.G., Groves B.A., Dopita M.A., Sutherland R.S., Kewley L.J., 2008, ApJS, 178, 20
- Anderson et al. (2010) Anderson L. D. et al.,2010, A&A, 518, 99
- Arkhipova et al. (2013) Arkhipova V. P. et al., 2013 MNRAS, 432, 2273
- Aniano et al. (2011) Aniano G., Draine B.T., Gordon K.D., Sandstrom K., 2011, PASP, 123, 1218
- Bendo et al. (2008) Bendo G. J. et al., 2008, MNRAS, 389, 629
- Blaha & Humphreys (1989) Blaha C., Humphreys R., 1989, AJ, 98, 1598
- Bonatto et al. (2004) Bonatto Ch., Bica E., Girardi L., 2004, A&A, 415, 571
- Cardelli et al. (1989) Cardelli et al., 1989, ApJ, 345, 245.
- Churchwell et al. (2006) Churchwell et al., 2006, ApJ, 649, 759.
- Deharveng et al. (2009) Deharveng L., Zavagno A., Schuller F., Caplan J., Pomare‘s M., De Breuck C., 2009, A&A, 496, 177
- Deharveng et al. (2010) Deharveng L. et al, 2010, A&A, 523, 6
- Draine (1978) Draine B. T., 1978, ApJS, 36, 595
- Dutra et al. (2003) Dutra C.M., Santiago B.X., Bica E.L.D., Barbuy B. 2003, MNRAS, V.338, P.253
- Garmany & Stencel (1992) Garmany C.D.,Stencel C.D., 1992, A&ASS, 94, 214
- Girardi et al. (2002) Girardi L., Bertelli G., Bressan A., Chiosi C., Groenewegen M.A.T., Marigo P., Salasnich, B., Weiss A. 2002, A&A, 391, 195.
- Gray & Corbally (2009) Gray R.O., Corbally C.J., 2009, Stellar Spectral Classification, Princeton University Press, 565
- Gutermuth et al. (2008) Gutermuth R.A. et al, 2008, ApJ, 674, 356.
- He et al. (1995) He L., Whittet D.C.B., Kilkenny D., Spencer Jones J.H. 1995, ApJS, 101, 335.
- Hog et al. (2002) Hog E. et al, 2000, A&A, 355, 27.
- Hora et al. (2011) Hora J.L., Smith H. A., Doering R. L., Spitzer Cygnus-X Survey Team, 2011, Bulletin of AAS, 43, AAS Meeting 217, 258.07
- Hora et al. (2009) Hora J.L. et al, 2009, Bulletin of AAS, 41, 498, AAS Meeting 213, 356.01
- Kauffmann et al. (2003) Kauffmann G. et al., 2003, MNRAS, 346, 1055
- Kewley et al. (2001) Kewley L.J., Dopita M.A., Sutherland R.S., Heisler C.A., Trevena J., 2001, ApJ, 556, 121
- Kewley et al. (2006) Kewley L.J., Groves B.A., Kauffmann G., Heckman T., 2006, MNRAS, 372, 961
- Kharchenko et al. (2013) Kharchenko N.V., Piskunov A.E., Schilbach E., Roser S., Scholz R.-D., 2013, A&A, 558, A53.
- King (1962) King I.R., 1962, AJ, 67, 471
- Le Duigou & Knödlseder (2002) Le Duigou J.-M., Knödlseder J., 2002, A&A, 392, 869
- Lozinskaya & Sitnik (1988) Lozinskaya T.A., Sitnik T.G., 1988, SvAL, 14, 100
- Lozinskaya & Repin (1990) Lozinskaya T.A., Repin S.V., 1990, SvA, 34, 580
- Lozinskaya et al. (1997) Lozinskaya T. A., Pravdikova V. V., Sitnik T. G., Esipov V. F., Mel’nikov V. V., 1997, Astron. Lett., 23, 450.
- Lozinskaya et al. (1998) Lozinskaya T. A., Pravdikova V. V., Sitnik T. G., Esipov, V. F., Mel’nikov V. V., 1998, Astron. Reports, 42..453.
- Magakian (2003) Magakian T.Y., 2003, A&A, 399, 141.
- Martin & Whittet (1990) Martin, Whittet, 1990, ApJ, 357, 113.
- Melnik & Dambis (2009) Melnik A.M., Dambis A.K., 2009, MNRAS, 400, 518
- Moffat & Schmidt-Kaler (1976) Moffat A.F.J., Schmidt-Kaler T., 1976, A&A, 48, 115
- Molinari et al. (2010) Molinari et al., 2010, PASP, 122, 314
- Motte et al. (2007) Motte F., Bontemps S., Schilke P., Schneider N., Menten K. M., Broguière D., 2007, A&A, 476, 1243
- Pavlyuchenkov et al. (2013) Pavlyuchenkov Ya. N., Kirsanova M. S., Wiebe D. S. 2013, ARep, 57, 573
- Pilyugin & Mattsson (2011) Pilyugin L.S., Mattsson L., 2011, MNRAS, 412, 1145
- Racine (1968) Racine R., 1968, AJ, 73, 233
- Racine (1974) Racine R., 1974, AJ, 79, 945
- Roeser et al. (2010) Roeser S., Demleitner M., Schilbach E., 2010, AJ., 139, 2440
- (45) Saken J.M., Shull J.M., Garmany C.D., Nichols-Bohlin J., Fesen R., 1992, ApJ, 397, 537
- Schlafly & Finkbeiner (2011) Schlafly E.F., Finkbeiner D.P., 2011, ApJ 737, id.103
- Schlegel et al. (1998) Schlegel D.J., Finkbeiner D.P., Davis M., 1998, ApJ 500, 525
- Schneider et al. (2006) Schneider, N., Bontemps, S., Simon, R., Jakob, H., Motte, F., Miller, M., Kramer, C., Stutzki, J., 2006, A&A, 458, 855
- Schneider et al. (2007) Schneider N., Simon R., Bontemps S., Comeron F., Motte F., 2007, A&A, 474, 873
- Schneider et al. (2011) Schneider N. et al, 2011, A&A, 529, 1
- Skrutskie et al. (2006) Skrutskie M.F. et al, 2006, AJ, 131, 1163
- Silva & Cornell (1992) Silva D.R., Cornell M.E.,1992, ApJSS 81, 865
- Sitnik (2003) Sitnik T.G., 2003, Astron. Lett., 29, 311
- Sitnik & Mel’nik (1996) Sitnik T.G., Mel’nik A.M., 1996, Astron. Lett., 22, 122
- Valdes et al. (2004) Valdes F., Gupta R., Rose J.A., Singh, H.P., Bell, D.J., 2004, A&ASS, 152, 251
- van den Bergh (1966) van den Bergh S., 1966, AJ, 71, 990
- Watson et al. (2008) Watson C. et al, 2008, ApJ, 681, 1341
- Ybarra & Lada (2009) Ybarra J. E., Lada E. A., 2009, ApJL, 695, L120
- Ybarra et al. (2014) Ybarra J. E., Tapia, M., Roman-Zuniga, C., Lada, E., 2014, ApJL, 794, 25
- Zabolotskikh et al. (2002) Zabolotskikh M.V., Rastorguev A.S., Dambis A.K., 2002, Astron. Lett., 28, 454
- Zacharias et al. (2013) Zacharias N., Finch C.T., Girard T.M., Henden A., Bartlett J.L., Monet D.G. Zacharias M.I., 2013, AJ, 145, 44