Permission to make digital or hard copies of all or part of this work for personal or classroom use is granted without fee provided that copies are not made or distributed for profit or commercial advantage and that copies bear this notice and the full citation on the first page. Copyrights for components of this work owned by others than ACM must be honored. Abstracting with credit is permitted. To copy otherwise, or republish, to post on servers or to redistribute to lists, requires prior specific permission and/or a fee. Request permissions from Permissions@acm.org.
Cultures in Community Question Answering
Abstract
CQA services are collaborative platforms where users ask and answer questions. We investigate the influence of national culture on people’s online questioning and answering behavior. For this, we analyzed a sample of 200 thousand users in Yahoo Answers from 67 countries. We measure empirically a set of cultural metrics defined in Geert Hofstede’s cultural dimensions and Robert Levine’s Pace of Life and show that behavioral cultural differences exist in community question answering platforms. We find that national cultures differ in Yahoo Answers along a number of dimensions such as temporal predictability of activities, contribution-related behavioral patterns, privacy concerns, and power inequality.
category:
K.4.0 Computers and Society Generalcategory:
J.4 Social and Behavioural Sciences Sociologykeywords:
Community question answering; cultures; crowdsourcing1 Introduction
Cultural differences exist in almost all aspects of social interactions. For example, in some cultures in Asia it may be considered disrespectful for people to express their opinions or ask questions to authority figures (e.g., teachers, elders). In other cultures (such as USA or Canada) asking questions is expected or even encouraged.
Cross-country cultural variations have been studied in the real world via small-scale experiments and opinion surveys. Geert Hofstede [13] administered opinion surveys to a large number of IBM employees from different countries in the 1960s and 1970s. He discovered five cultural dimensions (individualism, power distance, uncertainty avoidance, masculinity, and long term orientation), that can be attributed to the existence of cultural variations. Three of these dimensions, individualism, power distance, and uncertainty avoidance, have been used to assess cultural differences in online contexts such as Twitter communication [8], emoticon usage [27] and online scheduling [30]. In brief, individualism reflects the extent to which an individual is integrated into a group (e.g., individualistic cultures like USA emphasizes mostly on their individual goals, as opposed to collectivist cultures like China that emphasizes on group harmony and loyalty). Power distance is the extent to which the less powerful members of an organization or society expect and accept that power is distributed unequally (e.g., in high power distance countries subordinates simply comply with their leaders). Uncertainty avoidance defines the extent to which society members feel uncomfortable with uncertainty and ambiguity (e.g., the stereotypical Swiss plans everything ahead supposedly to avoid uncertainty).
Psychologist Robert V. Levine [21] proposed the Pace of Life metric based on the walking speed of city people over a distance of 60 feet, the service time for standard requests for stamps, and the clock accuracy of city banks. During the 1990s, Levine employed 19 experimenters in large cities from 31 countries and computed country-specific Pace of Life ranks. He found significant differences in Pace of Life across cultures and ranked the cultures based on that.
Such cross-cultural variations that sociologists and psychologists already found in the offline world lead to our main research question: Does national culture determine how we participate in online Community Question Answering (CQA) platforms? CQAs such as Yahoo Answers (YA), Quora and Stack Overflow have been popular in the last decade. These platforms are rich and mature repositories of user-contributed questions and answers. For example, YA, launched in December 2005, has more than one billion posted answers,111http://www.yanswersbloguk.com/b4/2010/05/04/1-billion-answers-served/ and Quora, one of the fastest growing CQA sites has seen three times growth in 2013.222http://www.goo.gl/MfK83y
National cross-cultural variations have been studied in a number of online contexts, including social networks (e.g., Twitter [10], Facebook [29]), location search and discovery (e.g., Foursquare [34]) and online scheduling (e.g., Doodle [30]). While CQA platforms have been intensively studied [32, 6, 28, 16], to the best of our knowledge, there has been no study focusing on users’ cultural differences and how they shape asking, answering, or reporting abuses in CQA platforms. If cultural variations exist in CQA platforms, they could be used for more informed system design, including question recommendation, follow recommendation, and targeted ads.
To fill this gap, we analyzed about 200 thousand sampled YA users from 67 countries who were active between 2012 and 2013. We tested a number of hypotheses associated with Hofstede’s cultural dimensions and Levine’s Pace of Life. Our results show that YA is not a homogeneous subcultural community: considerable behavioral differences exist between the users from different countries. We find that users from individualistic countries provide more answers, have higher contribution than take away, and are more concerned about their privacy than those from collective cultures. Users from individualistic countries are also less likely to provide an answer that violates community norms. We also find that higher power distance countries show more indegree imbalance in following relationships compared to lower power distance countries. Finally, we find that users from higher Pace of Life and lower uncertainty avoidance countries have more temporally predictable activities.
The rest of the paper is structured as follows. Section 2 discusses previous analysis of CQA platforms and the existing body of work on online cultural variations. Section 3 presents the YA functionalities relevant to this study and the dataset used. We introduce the hypotheses and present the results relating to Levine’s Pace of Life and Hofstede’s cultural dimensions in YA in Section 4 and Section 5, respectively. We discuss the impact of these results in Section 6.
2 Related Work
Golder and Macy [10] studied collective mood in Twitter across countries from 509 million Twitter posts by 2.4 million users over a 2-year period. Despite having different cultures, geographies, and religions, all countries (USA, Canada, UK, Australia, India, and English-speaking Africa) in their study showed similar mood rhythms—people tended to be more positive on weekends and early in the morning. Park et al. [27] examined the variation of Twitter users’ emoticon usage patterns in cross cultures. They used Hofstede’s national culture scores of 78 countries and found that collectivist cultures favor vertical and eye-oriented emoticons, where people within individualistic cultures favor horizontal and mouth-oriented emoticons. Hofstede’s cultural dimensions have also been used to study whether culture of a country is associated with the way people use Twitter [9]. In another study on cross-country Twitter communication, Garcia et al. showed that cultural variables such as Hofstede’s indices, language and intolerance have an impact on Twitter communication volume [8].
Silva et al. [34] used food and drink check-ins in Foursquare to identify cultural boundaries and similarities across populations. They showed that online footprints of foods and drinks are good indicators of cultural similarities between users, e.g., lunch time is the perfect time for Brazilians to go for slow food places more often, whereas Americans and English people go for slow foods more at dinner time. Extracted features like these allow them to apply simple clustering algorithms such as K-means to draw cultural boundaries across the countries.
Quercia [29] used Satisfaction With Life tests and measured happiness of 32,787 Facebook users from 12 countries (Australia, Canada, France, Germany, Ireland, Italy, New Zealand, Norway, Singapore, Sweden, UK, USA ). He found that despite comparative economic status, country-level happiness significantly varies across the countries and that it strongly correlates with official well-being scores.
Reinecke et al. [30] used about 1.5 million Doodle polls from 211 countries and territories and studied the influence of national culture on people’s scheduling behavior. Using Hofstede’s cultural dimensions, they found that Doodle poll participants from collectivist countries find more consensus than those from predominantly individualist societies.
CQA platforms have also attracted much research interest focusing on content, user behavior and applications. Research on CQA content has analyzed textual aspects of questions and answers. Researchers have proposed algorithmic solutions to automatically determine the quality of questions [23] and answers [32]. Research on CQA user behavior has been mostly about understanding why users contribute content: that is, why users ask questions (askers are failed searchers, in that, they use CQA sites when web search fails [24]); and why they don’t answer questions (e.g., they refrain from answering sensitive questions to avoid being reported for abuse and potentially lose access to the community [6]). As for applications, researchers have proposed effective ways of recommending questions to the most appropriate answerers [28], automatically answering questions based on past answers [33], and retrieving factual answers [1] or factual bits within an answer [39]. Our previous work [16] used user-provided rule violation reports and user social network features to detect the content abusers in YA.
However, there has been no empirical cross-cultural analysis of CQA platforms. This paper is a first step in this direction and it verifies whether cultural differences are manifested in one such platform, YA.
3 Yahoo Answers
After years of activity, YA has M monthly visitors (U.S. only).333http://www.listofsearchengines.org/qa-search-engines The functionalities of the YA platform and the dataset used in this analysis are presented next.
3.1 The Platform
YA is a CQA platform in which community members ask and answer questions on various topics. Users ask questions and assign them to categories selected from a predefined taxonomy, e.g., Business & Finance, Health, and Politics & Government. YA has about categories. Users can find questions by searching or browsing through this hierarchy of categories. A question has a title (typically, a short summary of the question), and a body with additional details.
A user can answer any question but can post only one answer per question. Questions remain open for four days for others to answer. However, the asker can select a best answer before the end of this 4-day period, which automatically resolves the question and archives it as a reference question. The best answer can also be rated between one to five, known as answer rating. If the asker does not choose a best answer, the community selects one through voting. The asker can extend the answering duration for an extra four days. The questions left unanswered after the allowed duration are deleted from the site. In addition to questions and answers, users can contribute comments to questions already answered and archived.
YA has a system of points and levels to encourage and reward participation.444https://answers.yahoo.com/info/scoring_system A user is penalized five points for posting a question, but if she chooses a best answer for her question, three points are given back. A user who posts an answer receives two points; a best answer is worth points.
A leaderboard, updated daily, ranks users based on the total number of points they collected. Users are split into seven levels based on their acquired points (e.g., 1-249 points: level 1, 250-999 points: level 2, …, 25000+ points: level 7). These levels are used to limit user actions, such as posting questions, answers, comments, follows, and votes: e.g., first level users can ask questions and provide answers in a day.
YA requires its users to follow the Community Guidelines that forbid users to post spam, insults, or rants, and the Yahoo Terms of Service that limit harm to minors, harassment, privacy invasion, impersonation and misrepresentation, fraud and phishing. Users can flag content (questions, answers or comments) that violates the Community Guidelines and Terms of Service using the “Report Abuse” functionality. Users click on a flag sign embedded with the content and choose a reason between violation of the community guidelines and violation of the terms of service. Reported content is then verified by human inspectors before it is deleted from the platform.
Users in YA can choose to follow other users, thus creating a follower-followee relationship used for information dissemination. The followee’s actions (e.g., questions, answers, ratings, votes, best answer, awards) are automatically posted on the follower’s newsfeed. In addition, users can follow questions, in which case all responses are sent to the followers of that question.
3.2 Dataset
We studied a random sample of about k users from YA who were active between 2012 and 2013. These users posted about million questions (about questions/user), 43 million answers (about answers/user), and 4.5 million abuse reports (about reports/user). They are connected via k follower-followee relationships in a social network. The indegree and outdegree distributions of the social network follow power-law distributions, with an exponential fitting parameter of and , respectively.
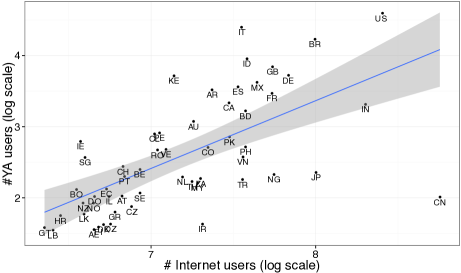
In our dataset, we have users from countries. Figure 1 shows the number of users in our dataset as a function of the number of Internet users taken from the World Bank.555http://www.data.worldbank.org/indicator/IT.NET.USER.P2 We find a linear relationship between the number of users per country in our YA dataset and the number of Internet users in the World Bank dataset for each country. It means that the YA users from our dataset are not skewed by country. Instead, they represent a sample of global Internet users.
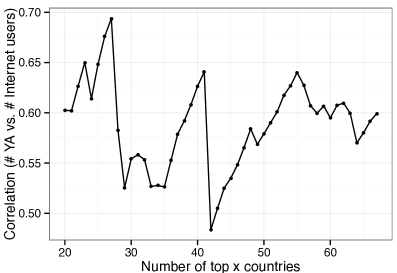
To investigate how sensitive this correlation is to the number of users per country, we computed the Pearson correlation between the number of YA users in countries and their respective internet population. The countries were ranked based on the number of YA users found in the dataset, and was varied from top 20 to all 67 countries. Figure 2 shows that there are several peaks in the correlation, but the values are high and between 0.5 and 0.7. We select as a threshold the second highest correlation peak and thus included in the study countries which have at least 150 users per country.
4 Levine’s Pace of Life
In this section, we analyze Levine’s Pace of Life cultural dimension in the context of YA and show how it relates to user activities such as questioning, answering and reporting. In his book [20], psychologist Robert Levine defines Pace of Life as “the flow or movement of time that people experience”. With the help of 19 experimenters, he collected and compared three indicators of the Pace of Life in 36 large cities from 31 countries around the world during a warm summer month between 1992 and 1995 [21]. The indicators are:
-
•
Walking speed: They measured walking speed of 35 men and 35 women over a distance of 60 feet in main downtown areas in each city. Measurements were done during prime business hours after controlling a number of variables such as sidewalks, crowd, effects of socialization. They found significant differences in pedestrians walking speed—for example, pedestrians in Rio de Janeiro, Brazil walked only two-thirds as fast as pedestrians in Zurich, Switzerland.
-
•
Postal speed: In each city, they measured the time it took postal workers to serve a standard request for stamps and considered this time as a proxy for work speed. They handed each clerk money and a note written in the local language requesting a common stamp. For example, in the United States, the clerk was handed a 5 dollar bill with a request for one 32-cent stamp. They found that overall Western Europe was the fastest to serve a standard request.
-
•
Clock accuracy: To quantitatively measure time concerns, the researchers checked the clock accuracy of randomly selected 15 downtown banks in each city. The reported times were then compared to those reported by the telephone company, which was considered accurate.
Levine combined these three scores into a country-specific Pace of Life score and concluded that “the Pace of Life was fastest in Japan and the countries of Western Europe and was slowest in economically undeveloped countries. The pace was significantly faster in colder climates, economically productive countries, and in individualistic cultures” [21].
Intuitively, to cope with the rigid perception of time, people from the higher Pace of Life countries have to be planned and organized in their daily activities. On the other hand, people from lower Pace of Life countries might allow some unstructured activities, as in those countries the expectation of following the ‘right’ time is more relaxed.
Applying these findings to online communities such as CQA platforms, we expect that people from higher Pace of Life countries, such as the USA, will be less likely to ask or answer questions during busy hours of the day, e.g., office hours.
From these ideas, we hypothesize the following in YA:
[H1] Users from countries with a higher Pace of Life score show more temporally predictable activities.
To test this hypothesis, we calculate how probable a country’s users are in asking, answering and reporting at different times of day and correlate that with that country’s Pace of Life rank. For example, if a user only asks or answers questions in the evening, he is temporally more predictable than a user who asks or answers in the morning, afternoon and night. In a Twitter study [10], Golder and Macy also find diurnal mood rhythms in different cultures.
In order to calculate temporal predictability, we only consider working days, as weekends are less predictable. More specifically, similar to [9], we divide the working day in five time intervals: morning (6:00 - 8:59), office time (9:00-17:59), evening (18:00-20:59), late night (21:00- 23:59), sleeping time (00:00 - 05:59). All the reported times are users’ local time. We use information entropy [3], a measure of disorder, to calculate the temporal predictability.
For a given activity (asking, answering, or reporting) and intervals, we can compute , the probability of an activity belonging to interval . We measure the normalized entropy for user for all activities as:
| (1) |
We calculate users’ normalized entropies for all their questions, answers and abuse reports and refer to them as question, answer and report entropy, respectively. In our dataset, each country has on average k questions, k answers and k abuse reports. Normalized entropy ranges from 0 to 1. A normalized question entropy close to 0 indicates that most of the questions the user asked are within one time interval of the day, whereas the closer to 1, the more likely is that the user asked questions during all intervals. Finally, the question/answer/report entropy for a country , , is defined as the geometric mean of all computed for the users of that country:
| (2) |
where is the set of users in country . We use geometric mean to account for the skewed distribution of the entropy scores, something that the regular arithmetic mean cannot handle.
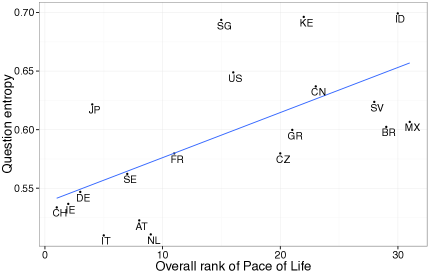
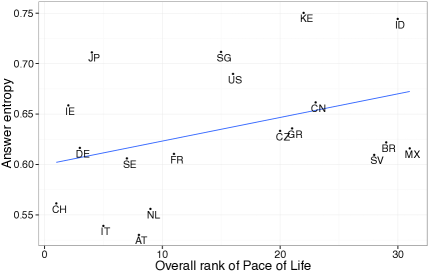
Table 1 shows Pearson correlations between question, answer, report entropy and Pace of Life ranks, where lower ranks mean higher Pace of Life. For both questions and answers, the overall Pace of Life ranks have positive correlations with question and answer entropy with and , respectively. These positive relationships are seen in the Figures 3 and 4. We find positive correlations between walking speed rank, post office service time rank, and clock accuracy time rank with question entropy with , and , respectively. For answers, we find positive correlations between post office service time rank, and clock accuracy time rank with entropy with and , respectively. However, we do not find any statistically significant relationships between report entropy and Pace of Life ranks.
These results confirm that users from countries with a higher Pace of Life score show more temporally predictable asking and answering behavior in YA.
| Entropy | |||
|---|---|---|---|
| Pace of Life | Question | Answer | Report |
| Overall | 0.67*** | 0.37* | 0.18 |
| Walking speed | 0.48** | 0.18 | 0.06 |
| Post office | 0.60** | 0.38* | 0.19 |
| Clock accuracy | 0.48** | 0.29* | 0.21 |
5 Hofstede’s Cultural Dimensions
In this section, we analyze a number of cultural dimensions in YA proposed by Geert Hofstede. We show how three cultural dimensions defined by Hofstede—individualism, power distance and uncertainty avoidance are manifested in the ecosystem of YA.
Hofstede’s cultural dimensions theory is a framework for analyzing cultural variability. In his original model [12], Hofstede proposed four primary dimensions by surveying in the 1960s and 1970s a large number of IBM employees from 40 countries: power distance (PDI), individualism (IDV), uncertainty avoidance (UAI) and masculinity (MAS). Later [13], he added two more dimensions: long-term orientation (LTO) and indulgence versus restraint (IVR). Three of the dimensions, individualism, power distance, and uncertainty avoidance, have been used in a number of recent studies of online behavior [8, 27, 30]. We also use these three Hofstede’s cultural dimensions and relate them to a number of hypotheses in the context of YA.
5.1 Individualism (IDV)
Individualism is the extent to which an individual is integrated into a group. In individualistic societies (high IDV) such as the USA and England, personal achievements and individual rights are emphasized; an individual is expected to take care of only himself and his immediate family.
In collectivist countries such as those of India, China, and Japan, individuals are expected to place the family and group goals above those of self. In this work, we investigate how individualism is related to users’ contribution, (un)ethical behavior and privacy settings in YA.
Individualism and contribution.
The usage of the Internet takes time from a number of daily activities including face-to-face socialization.
In collectivist countries, people are expected to give a fair amount of time on sociability, hence traditionally they seem to spend less time on the Internet compared to the people from the individualistic cultures [5].
In YA we expect that users from individualistic countries spend more time online, hence they can provide more answers and eventually they can contribute more to the community than their direct benefits from the community.
We hypothesize the following:
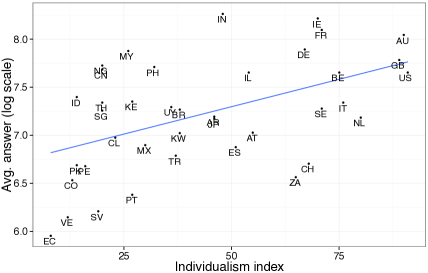
[H2] Users from countries with higher individualism index provide more answers.
[H3] Users from countries with higher individualism index contribute more to the community than what they take away from the community.
We correlate the geometric mean of the number of answers posted by the users from a country with that country’s individualism index (a higher score means higher individuality). We use geometric mean as an average because of the skewed distributions of the number of answers. In the calculation of the geometric mean, we exclude the users who have not provided any answers. We observe a positive correlation, shown in Figure 5, with . This means that, on average, users from individualistic countries provide more answers.
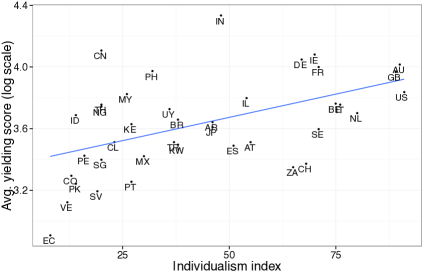
To quantify users’ contribution compared to their take away, we compute yielding scores of the users. The yielding score of a user is simply a difference between his contribution and his take away. For yielding scores, we consider YA’s point system, which awards two points for an answer, ten points for a best answer, and penalizes five points for a question:
| (3) |
where is the number of questions posted by user , is the number of answers posted by , and is the number of best answers posted by .
Finally, a country’s yielding score is defined as the geometric mean of all computed for the users of each country :
| (4) |
where is the set of users in country and we take only those users having yielding scores more than zero.
We correlate a country’s geometric mean of the yielding score with the country’s individualism index and we obtain a positive correlation (Figure 6) with .
This result suggests that the more individualistic a country is, the more its users contribute to YA than what they take away from the community.
There might be multiple explanations about why users from individualistic countries contribute more to the community as reflected by hypotheses H2 and H3. One explanation is that individualistic cultures have a more favorable collaborative environment [35], so individuals feel the urge to contribute to the community. Another explanation could be that users from individualistic cultures simply want more points than collectivist cultures. As points are awarded for contribution (e.g., an answer earns two points) and participation (e.g., each login earns one point), users might be tempted to contribute more. In fact, we obtain a positive and significant correlation () between a country’s points (calculated as geometric mean of the country’s user points) and its individualism index. Finally, there might be other confounding factors (e.g., internet penetration) that affect the contribution of a country’s users on the platform. Thus, it is difficult to confirm whether the users’ behavioral differences on contribution are due to their cultural differences.
Individualism and (un)ethical behavior. The degree to which a culture is collectivist or individualistic has an implication on its users’ online (un)ethical behavior. For example, the more individualistic (less collectivistic) a culture, the lower the rate of software piracy [14] and online music piracy [19]. Personal rights are paramount in individualistic cultures, where people do not feel obligated to engage in group cooperation that involves conspiracy. Group cooperation and conspiracy are two key elements for the real world unethical behaviors such as corruption [26]. Triandis et al. [37] used Hofstede’s individualism index and found that the countries with higher collectivist scores show the most corruption.
Based on this online and offline user unethical behavior that is influenced by culture, our intuition is that we could observe a similar trend in YA.
In CQA platforms, the expectation is that users would provide helpful answers to posted questions.
As such, users are required to follow the Community Guidelines and the Yahoo Terms of Service while answering.
When users post bad answers, community members flag them.
Later, human moderators check whether these flags are applied correctly or not.
We expect that the more collective a culture is, the more probable the answers from its users will be flagged as abusive.
Formally, we hypothesize that:
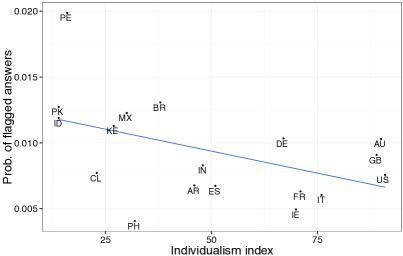
[H4] Users from more collective (less individualistic) cultures have higher probability to violate CQA norms.
To this end, for each user , we first calculate , the probability that his answers violate community norms (and thus are correctly flagged by other users):
| (5) |
Finally, , the geometric average of all probabilities computed for each country :
| (6) |
where is the set of users in country .
The Pearson correlation shows that the probability of abuses in answers provided by the users from a particular country is negatively correlated with that country’s individualism index. Figure 7 indeed shows that the probability decreases with an increasing individualism index, meaning that if an answer comes from an individualistic country, it is less probable to violate community rules.
Individualism and privacy concerns.
Although online privacy concerns are global, the extent to which people perceive these concerns as real varies across cultures.
For example, in the United States, privacy is a basic human right, endorsed by the American Bill of Rights, while Asian countries show little or no recognition on privacy in their legal systems [5].
A survey of Internet users from five big cities—Bangalore, Seoul, Singapore, Sydney and New York—shows that Internet users from individualistic cultures are more concerned about privacy than those in collective cultures [2].
We expect that a similar trend also exists in CQA platforms.
We hypothesize that:
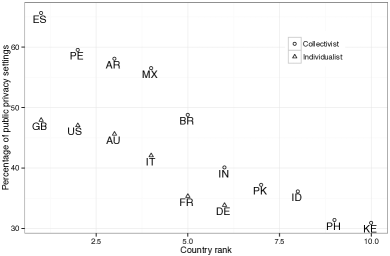
[H5] Users from higher individualism index countries exhibit higher level of concern about their privacy.
We use the modifications of the privacy settings on users’ YA accounts as a proxy of privacy concern. In YA, privacy settings are typically available for users to personalize for content (questions or answers) and follower-followee network. Intuitively, privacy-concerned users would take the opportunity to change the default privacy settings. So, we consider the fraction of public privacy profiles in a country to draw a conclusion on how concerned its users are about their privacy. However, the default privacy in YA is public. It might be possible that many of the users in the public group are dormant: users who signed up, asked and answered some questions, and disappeared quickly. These users might skew the results of our study, thus, we only consider active users from our dataset— users who have asked and answered more than 10 questions during our observation interval. These active users are about 79% of our dataset. We note that our conclusions remain the same if we consider more active users by filtering users who have asked and answered more than 20 questions.
Based on Hofstede’s Individualism index, the Hofstede Centre666http://geert-hofstede.com/countries.html has tagged countries as individualistic or collectivist. In our study, we use this classification. Figure 8 shows the percentage of user profiles with public privacy settings in a country, as function of the country’s ranking in the collectivist and individualistic class. The figure shows that, on average, collectivist countries have a higher percentage of public profiles: collectivist countries such as Spain, Peru, Argentina, and Mexico have higher percentage of public profiles than individualistic countries such as United Kingdom, United States, Australia or Italy.
5.2 Power Distance Index (PDI)
PDI is the extent to which the less powerful members of an organization or society expect and accept that power is distributed unequally. This dimension sheds light on how a society handles inequalities among its members. In countries with high PDI, such as countries from Latin, Asian, African and Arab world, everybody has a place in the social hierarchy and people accept the situation without questioning it. However, in Anglo and Germanic countries, which are low power distance countries, people seek distribution of power and ask for justifications of power inequality.
PDI essentially measures the distribution of wealth and power between people in a country or culture.
In YA, we can use the indegree (number of followers) as a proxy of wealth and power.
For example, the larger the number of followers users have, the larger an audience they have for direct communication.
Higher indegree users are also found to be more central (thus more retained [18]) across a number of network centrality metrics [17].
Moreover, these users’ questions are forwarded to more users, hence more likely to be getting an answer.
A study [16] on YA shows that users receive more answers from close neighborhoods.
Given the high number of questions that remain unanswered (42% in YA reported by a study [31]) in CQA platforms, bringing answers not only shows a user’s potential capability, but also makes the platform mature and informative.
Taking ideas from the unequal distribution of wealth and power in higher power distance countries, we expect that in YA, users from those countries also have inequality in their indegrees.
Garcia et al. [8] have found similar indegree inequality in Twitter.
We hypothesize the following in YA:
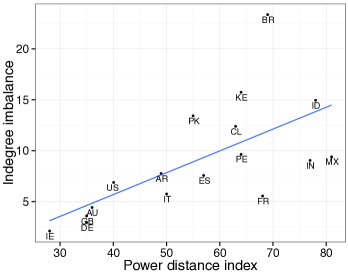
[H6] Users from higher power distance countries show a larger indegree imbalance in follow relationships.
We correlate countries power distance index (higher index means power distance is high) with their users’ indegree imbalance. A user’s indegree imbalance is calculated as the difference between her friends’ average indegree and her indegree. Finally, a country’s indegree imbalance is the geometric mean of the indegree imbalance of its users.
For all countries, except Panama and Philippines, we obtained a positive indegree imbalance, meaning that for those countries, on average, a user’s contacts have more contacts than the user. This supports a well-known hypothesis friendship paradox in sociology. The friendship paradox states that your friends have on average more friends than you have, however, most people think that they have more friends than their friends have [7]. It has been shown that the paradox holds for both Twitter [11] and Facebook [38]. Now we also show it for YA.
Figure 9 shows the relation between PDI and indegree imbalance (excluding Panama and Philippines). The figure indeed shows a positive correlation. We obtained a positive correlation between indegree imbalance and PDI for all countries (including Panama and Philippines). This supports the hypothesis that users from countries with higher PDI are more comfortable with indegree imbalance.
5.3 Uncertainty Avoidance Index (UAI)
UAI is the extent to which people feel uncomfortable with uncertainty and ambiguity. Individuals from countries exhibiting strong UAI tend to minimize uncertainty and ambiguity by careful planning, and enforcing rules and regulations. On the other hand, low uncertainty avoidance cultures maintain a more relaxed attitude in unstructured situations.
For example, Switzerland has a reasonably high uncertainty avoidance index (58) compared to countries such as Singapore (8) and Sweden (29).
In fact, an online scheduling behavior study [30] on Doodle (http://doodle.com/) shows that Switzerland and Germany have a high advance planning time of 28 days.
In YA, our related hypothesis is:
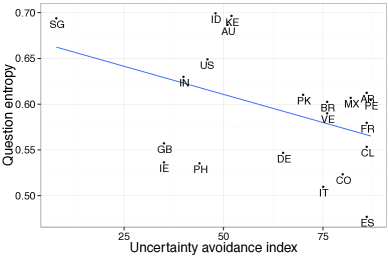
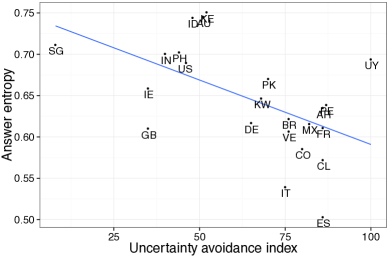
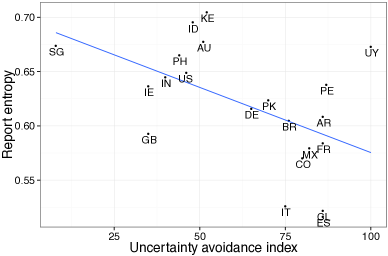
[H7] Users from countries with higher uncertainty avoidance index exhibit more temporally predictable activities.
Figures 10, 11, 12 show the relationship between question, answer and abuse report entropy vs. uncertainty avoidance index, respectively. Note that a higher UAI means lower uncertainty and ambiguity. The negative relations in the figures indicate that users from countries with higher uncertainty avoidance index tend to have lower question, answer and abuse report entropies, thus they are more temporarily predictable. All the entropies have negative relation to uncertainty avoidance index: for questions, for answers, and for abuse reports. All correlation values are statistically significant with .
6 Summary and Discussion
Observing the global spread of information and communication technologies, researchers sometimes predicted that the online world would be converging into a “one-world culture” [22]. With the advent of the large-scale online behavioral datasets in the past decade from online platforms like Twitter, Facebook and Foursquare, researchers showed that the Internet does not have a homogeneous culture. Instead, country-specific cultural variations do exist. We showed the same non-homogeneity, but in a very different online context—community question answering.
In this work, we analyzed about 200 thousand sampled Yahoo Answers users from 67 countries. We studied users’ behavioral patterns such as temporal predictability of activities, engagement, (un)ethical behavior, privacy concerns, and power inequality and how they compare with a number of cultural dimensions (Pace of Life, Individualism, Uncertainty Avoidance and Power Distance). We find that behavioral differences exist across cultures in YA. Table 2 shows a summary of all the hypotheses involving cultural indices and the results found.
| Pace of Life | Correlation |
| Users from countries with a higher Pace of Life score show more temporally predictable activities (asking, answering and reporting) | *** ** |
| Individualism | Correlation |
| Users from higher individualism index countries provide more answers | *** |
| Users from countries with higher individualism index contribute more to the community than what they take away from the community | ** |
| Users from more collective (less individualistic) cultures have higher probability to violate CQA norms | ** |
| Users from higher individualism index countries exhibit higher level of concern about their privacy | NA |
| Power distance | Correlation |
| Users from higher power distance countries show larger indegree imbalance in follow relationships | *** |
| Uncertainty Avoidance | Correlation |
| Users from countries with higher uncertainty avoidance index exhibit more temporally predictable activities (asking, answering and reporting) | ** ** ** |
We acknowledge that our study is observational and lacks controlled experimental ground truth data. Therefore, we cannot draw causal conclusions whether cultures shape the ecosystem of YA. However, our results hint at the importance of culture-aware CQA moderation. Note that CQA platforms like YA employ human moderators to evaluate reported abuses and determine the appropriate responses, from removing content to suspending user accounts. We find that collective cultures are more probable to provide bad answers. At a minimum, more attention of moderators are expected in these cultures to keep the environment clean.
We find that individualistic cultures are more engaged in YA, e.g., by providing more answers and contributing more than their take away. These results confirm the generalization that individualistic cultures are highly attracted to the Internet. Researchers often attribute the egalitarian, democratic nature of the Internet to this engagement [4].
The evidence of different engagement patterns and difference in pace of life across cultures in CQA platforms imply that some core functionalities such as question recommendation and follow recommendation could benefit from exploiting cultural factors. In question recommendation, questions are routed to the most appropriate answerers. To find out such answerers, factors such as followers, interests, question diversity and freshness [36] are considered. Our study suggests that including cultural variables such as individualism can be useful. For example, as users from collective cultures are less probable to answer, questions from those communities should be routed to a larger number of potential answerers.
Another variable, Pace of Life, could also be a factor in question recommendation. Our results show that users from countries with a higher pace of life are temporally more predictable. In those cultures, if questions are forwarded to answerers during the busy hours of the day (e.g., during office hours), the questions are less likely to get an answer. Solutions could include routing questions to a larger number of potential answerers, diversifying the set of answerers to include users from countries with a lower Pace of Life, or delaying routing for after work hours.
In the follow recommendation, CQA platforms recommend which other users one can follow based on shared interests, common contacts, and other related factors. We find that in YA, lower power distance countries show less indegree imbalance in follow relationships. For follow recommendation in those countries, users to be followed may be recommended to a user with the same level of indegree as them.
CQA platforms could also exploit cultural differentiations to improve targeted ads. Okazaki and Alonso [25] analyzed online advertising appeals such as “soft sell” appeal (that works by creating emotions and atmosphere via visuals and symbols) and “hard sell” appeal (that provides focus product features, explicit information, and competitive persuasion) across a number of cultures. They found individualistic cultures like the USA are more attracted to “hard sell” appeal, where collective cultures like Japan are attracted to “soft sell” appeal. Ju-Pak’s study [15] also confirms that fact-based appeal is dominant in the USA, but text-limited, visual layouts are popular in collective cultures like South Korea. Linguistic aspects in the ads might also be important. For example, focusing on ‘I’, ‘me’ in individualistic cultures and ‘us’ and ‘we’ in collective cultures. Finally, CQA sites could leverage cultural variations in their platforms by, for example, placing textual, informative feature ads to users from individualistic cultures and visual and symbolic ads to users from collective cultures.
7 Acknowledgments
The work was funded by the National Science Foundation under the grant CNS 0952420, and by the Yahoo’s Faculty Research and Engagement Program.
References
- [1] J. Bian, Y. Liu, E. Agichtein, and H. Zha. Finding the right facts in the crowd: Factoid question answering over social media. In Proceedings of the 17th International Conference on World Wide Web, pages 467–476, 2008.
- [2] H. Cho, M. Rivera-Sánchez, and S. S. Lim. A multinational study on online privacy: global concerns and local responses. New media & society, 11(3):395–416, 2009.
- [3] T. M. Cover and J. A. Thomas. Elements of information theory 2nd edition. Willey-Interscience: NJ, 2006.
- [4] M. De Mooij. The future is predictable for international marketers: converging incomes lead to diverging consumer behaviour. International Marketing Review, 17(2):103–113, 2000.
- [5] M. De Mooij. Global marketing and advertising: Understanding cultural paradoxes. Sage Publications, 2013.
- [6] D. Dearman and K. N. Truong. Why users of yahoo!: Answers do not answer questions. In Proceedings of the SIGCHI Conference on Human Factors in Computing Systems, pages 329–332, 2010.
- [7] S. L. Feld. Why your friends have more friends than you do. American Journal of Sociology, pages 1464–1477, 1991.
- [8] R. Garcia-Gavilanes, Y. Mejova, and D. Quercia. Twitter ain’t without frontiers: Economic, social, and cultural boundaries in international communication. In Proceedings of the 17th ACM conference on Computer supported cooperative work & social computing, pages 1511–1522, 2014.
- [9] R. Garcia-Gavilanes, D. Quercia, and A. Jaimes. Cultural dimensions in twitter: Time, individualism and power. Proceedings of the 7th International AAAI Conference on Weblogs and Social Media, 13, 2013.
- [10] S. A. Golder and M. W. Macy. Diurnal and seasonal mood vary with work, sleep, and day length across diverse cultures. Science, 333(6051):1878–1881, 2011.
- [11] N. O. Hodas, F. Kooti, and K. Lerman. Friendship paradox redux: Your friends are more interesting than you. In Proceedings of the 7th International AAAI Conference on Weblogs and Social Media, 2013.
- [12] G. Hofstede. National cultures in four dimensions: A research-based theory of cultural differences among nations. International Studies of Management & Organization, pages 46–74, 1983.
- [13] G. Hoftede, G. J. Hofstede, and M. Minkov. Cultures and organizations: software of the mind: intercultural cooperation and its importance for survival. McGraw-Hill, 2010.
- [14] B. W. Husted. The impact of national culture on software piracy. Journal of Business Ethics, 26(3):197–211, 2000.
- [15] K.-H. Ju-Pak. Content dimensions of web advertising: a cross-national comparison. International Journal of Advertising, 18(2):207–231, 1999.
- [16] I. Kayes, N. Kourtellis, D. Quercia, A. Iamnitchi, and F. Bonchi. The social world of content abusers in community question answering. In Proceedings of the 24th International World Wide Web Conference, pages 570–580, 2015.
- [17] I. Kayes, X. Qian, J. Skvoretz, and A. Iamnitchi. How influential are you: Detecting influential bloggers in a blogging community. In Proceedings of the 4th international conference on Social Informatics, pages 29–42, 2012.
- [18] I. Kayes, X. Zuo, D. Wang, and C. Jacob. To blog or not to blog: Characterizing and predicting retention in community blogs. In Proceedings of the 7th ACM/ASE International Conference on Social Computing (SocialCom’14), 2014.
- [19] E.-J. Ki, B.-H. Chang, and H. Khang. Exploring influential factors on music piracy across countries. Journal of Communication, 56(2):406–426, 2006.
- [20] R. Levine. A Geography of Time: The Temporal Misadventures of a Social Psychologist or How Every Culture Keeps Time Just a Little Bit Differently. University Press, 2006.
- [21] R. V. Levine and A. Norenzayan. The pace of life in 31 countries. Journal of cross-cultural psychology, 30(2):178–205, 1999.
- [22] T. Levitt. The globalization of markets. International Business: Strategic management of multinationals, 3:18, 2002.
- [23] B. Li, T. Jin, M. R. Lyu, I. King, and B. Mak. Analyzing and predicting question quality in community question answering services. In Proceedings of the 21st International Conference Companion on World Wide Web, pages 775–782, 2012.
- [24] Q. Liu, E. Agichtein, G. Dror, Y. Maarek, and I. Szpektor. When web search fails, searchers become askers: Understanding the transition. In Proceedings of the 35th International ACM SIGIR Conference on Research and Development in Information Retrieval, pages 801–810, 2012.
- [25] S. Okazaki and J. Alonso. Right messages for the right site: on-line creative strategies by japanese multinational corporations. Journal of Marketing Communications, 9(4):221–239, 2003.
- [26] H. Park. Determinants of corruption: A cross-national analysis. Multinational Business Review, 11(2):29–48, 2003.
- [27] J. Park, Y. M. Baek, and M. Cha. Cross-cultural comparison of nonverbal cues in emoticons on twitter: Evidence from big data analysis. Journal of Communication, 64(2):333–354, 2014.
- [28] M. Qu, G. Qiu, X. He, C. Zhang, H. Wu, J. Bu, and C. Chen. Probabilistic question recommendation for question answering communities. In Proceedings of the 18th International Conference on World Wide Web, pages 1229–1230, 2009.
- [29] D. Quercia. Don’t worry, be happy: The geography of happiness on facebook. In Proceedings of the 5th Annual ACM Web Science Conference, pages 316–325, 2013.
- [30] K. Reinecke, M. K. Nguyen, A. Bernstein, M. Näf, and K. Z. Gajos. Doodle around the world: Online scheduling behavior reflects cultural differences in time perception and group decision-making. In Proceedings of the conference on Computer supported cooperative work, pages 45–54, 2013.
- [31] M. Richardson and R. W. White. Supporting synchronous social q&a throughout the question lifecycle. In Proceedings of the 20th international conference on World wide web, pages 755–764, 2011.
- [32] C. Shah and J. Pomerantz. Evaluating and predicting answer quality in community qa. In Proceedings of the 33rd International ACM SIGIR Conference on Research and Development in Information Retrieval, pages 411–418, 2010.
- [33] A. Shtok, G. Dror, Y. Maarek, and I. Szpektor. Learning from the past: Answering new questions with past answers. In Proceedings of the 21st International Conference on World Wide Web, pages 759–768, 2012.
- [34] T. H. Silva, P. O. Vaz de Melo, J. M. Almeida, M. Musolesi, and A. A. Loureiro. You are what you eat (and drink): Identifying cultural boundaries by analyzing food and drink habits in foursquare. In Proceedings of the 8th International AAAI Conference on Weblogs and Social Media, 2014.
- [35] J. J. Sosik and D. I. Jung. Work-group characteristics and performance in collectivistic and individualistic cultures. The Journal of social psychology, 142(1):5–23, 2002.
- [36] I. Szpektor, Y. Maarek, and D. Pelleg. When relevance is not enough: Promoting diversity and freshness in personalized question recommendation. In Proceedings of the 22Nd International Conference on World Wide Web, pages 1249–1260, 2013.
- [37] H. C. Triandis, P. Carnevale, M. Gelfand, C. Robert, A. Wasti, T. Probst, E. Kashima, T. Dragonas, D. Chan, X. Chen, et al. Culture, personality and deception: A multilevel approach. International Journal of Cross-Cultural Management, 1:73–90, 2001.
- [38] J. Ugander, B. Karrer, L. Backstrom, and C. Marlow. The anatomy of the facebook social graph. arXiv preprint arXiv:1111.4503, 2011.
- [39] I. Weber, A. Ukkonen, and A. Gionis. Answers, not links: Extracting tips from yahoo! answers to address how-to web queries. In Proceedings of the 5th ACM International Conference on Web Search and Data Mining, pages 613–622, 2012.