Theoretical analysis of cross-validation for estimating the risk of the -Nearest Neighbor classifier
Abstract
The present work aims at deriving theoretical guaranties on the behavior of some cross-validation procedures applied to the -nearest neighbors (NN) rule in the context of binary classification. Here we focus on the leave--out cross-validation (LO) used to assess the performance of the NN classifier. Remarkably this LO estimator can be efficiently computed in this context using closed-form formulas derived by Celisse and Mary-Huard (2011).
We describe a general strategy to derive moment and exponential concentration inequalities for the LO estimator applied to the NN classifier. Such results are obtained first by exploiting the connection between the LO estimator and U-statistics, and second by making an intensive use of the generalized Efron-Stein inequality applied to the LO estimator. One other important contribution is made by deriving new quantifications of the discrepancy between the LO estimator and the classification error/risk of the NN classifier. The optimality of these bounds is discussed by means of several lower bounds as well as simulation experiments.
Keywords: Classification, Cross-validation, Risk estimation
1 Introduction
The -nearest neighbor (NN) algorithm (Fix and Hodges, 1951) in binary classification is a popular prediction algorithm based on the idea that the predicted value at a new point is based on a majority vote from the nearest labeled neighbors of this point. Although quite simple, the NN classifier has been successfully applied to many difficult classification tasks (Li et al., 2004; Simard et al., 1998; Scheirer and Slaney, 2003). Efficient implementations have been also developed to allow dealing with large datasets (Indyk and Motwani, 1998; Andoni and Indyk, 2006).
The theoretical performances of the NN classifier have been already extensively investigated. In the context of binary classification preliminary theoretical results date back to Cover and Hart (1967); Cover (1968); Györfi (1981). More recently, Psaltis et al. (1994); Kulkarni and Posner (1995) derived an asymptotic equivalent to the performance of the 1NN classification rule, further extended to NN by Snapp and Venkatesh (1998). Hall et al. (2008) also derived asymptotic expansions of the risk of the NN classifier assuming either a Poisson or a binomial model for the training points, which relates this risk to the parameter . By contrast to the aforementioned results, the work by Chaudhuri and Dasgupta (2014) focuses on the finite sample framework. They typically provide upper bounds with high probability on the risk of the NN classifier where the bounds are not distribution-free. Alternatively in the regression setting, Kulkarni and Posner (1995) provide a finite-sample bound on the performance of 1NN that has been further generalized to the NN rule () by Biau et al. (2010a), where a bagged version of the NN rule is also analyzed and then applied to functional data Biau et al. (2010b). We refer interested readers to Biau and Devroye (2016) for an almost thorough presentation of known results on the NN algorithm in various contexts.
In numerous (if not all) practical applications, computing the cross-validation (CV) estimator (Stone, 1974, 1982) has been among the most popular strategies to evaluate the performance of the NN classifier (Devroye et al., 1996, Section 24.3). All CV procedures share a common principle which consists in splitting a sample of points into two disjoint subsets called training and test sets with respective cardinalities and , for any . The training set data serve to compute a classifier, while its performance is evaluated from the left out data of the test set. For a complete and comprehensive review on cross-validation procedures, we refer the interested reader to Arlot and Celisse (2010).
In the present work, we focus on the leave--out (LO) cross-validation. Among CV procedures, it belongs to exhaustive strategies since it considers (and averages over) all the possible such splittings of into training and test sets. Usually the induced computation time of the LO is prohibitive, which gives rise to its surrogate called fold cross-validation (V-FCV) with (Geisser, 1975). However, Steele (2009); Celisse and Mary-Huard (2011) recently derived closed-form formulas respectively for the bootstrap and the LO procedures applied to the NN classification rule. Such formulas allow one to efficiently compute the LO estimator. Moreover since the V-FCV estimator suffers a larger variance than the LO one (Celisse and Robin, 2008; Arlot and Celisse, 2010), LO (with ) strictly improves upon V-FCV in the present context.
Although being favored in practice for assessing the risk of the NN classifier, the use of CV comes with very few theoretical guarantees regarding its performance. Moreover probably for technical reasons, most existing results apply to Hold-out and leave-one-out (L1O), that is LO with (Kearns and Ron, 1999). In this paper we rather consider the general LO procedure (for ) used to estimate the risk (alternatively the classification error rate) of the NN classifier. Our main purpose is then to provide distribution-free theoretical guarantees on the behavior of LO with respect to influential parameters such as , , and . For instance we aim at answering questions such as: “Does it exist any regime of (with some function of ) where the LO estimator is a consistent estimate of the risk of the NN classifier?”, or “Is it possible to describe the convergence rate of the LO estimator with respect to ?”
Contributions.
The main contribution of the present work is two-fold: we describe a new general strategy to derive moment and exponential concentration inequalities for the LO estimator applied to the NN binary classifier, and these inequalities serve to derive the convergence rate of the LO estimator towards the risk of the NN classifier.
This new strategy relies on several steps. First exploiting the connection between the LO estimator and U-statistics (Koroljuk and Borovskich, 1994) and the Rosenthal inequality (Ibragimov and Sharakhmetov, 2002), we prove that upper bounding the polynomial moments of the centered LO estimator reduces to deriving such bounds for the simpler L1O estimator. Second, we derive new upper bounds on the moments of the L1O estimator using the generalized Efron-Stein inequality (Boucheron et al., 2005, 2013, Theorem 15.5). Third, combining the two previous steps provides some insight on the interplay between and in the concentration rates measured in terms of moments. This finally results in new exponential concentration inequalities for the LO estimator applying whatever the value of the ratio . In particular while the upper bounds increase with , it is no longer the case if . We also provide several lower bounds suggesting our upper bounds cannot be improved in some sense in a distribution-free setting.
The remainder of the paper is organized as follows. The connection between the LO estimator and -statistics is clarified in Section 2, where we also recall the closed-form formula of the LO estimator (Celisse and Mary-Huard, 2011) applied to the NN classifier. Order- moments () of the LO estimator are then upper bounded in terms of those of the L1O estimator. This step can be applied to any classification algorithm. Section 3 then specifies the previous upper bounds in the case of the NN classifier, which leads to the main Theorem 3.2 characterizing the concentration behavior of the LO estimator with respect to , , and in terms of polynomial moments. Deriving exponential concentration inequalities for the LO estimator is the main concern of Section 4 where we highlight the strength of our strategy by comparing our main inequalities with concentration inequalities derived with less sophisticated tools. Finally Section 5 exploits the previous results to bound the gap between the LO estimator and the classification error of the NN classifier. The optimality of these upper bounds is first proved in our distribution-free framework by establishing several new lower bounds matching the upper ones in some specific settings. Second, empirical experiments are also reported which support the above conclusions.
2 -statistics and LO estimator
2.1 Statistical framework
Classification
We tackle the binary classification problem where the goal is to predict the unknown label of an observation . The random variable has an unknown joint distribution defined by for any Borelian set , where denotes a probability distribution. In what follows no particular distributional assumption is made regarding . To predict the label, one aims at building a classifier on the basis of a set of random variables called the training sample, where represent copies of drawn independently from . In settings where no confusion is possible, we will replace by .
Any strategy to build such a classifier is called a classification algorithm or classification rule, and can be formally defined as a function that maps a training sample onto the corresponding classifier , where is the set of all measurable functions from to . Numerous classification rules have been considered in the literature and it is out of the scope of the present paper to review all of them (see Devroye et al. (1996) for many instances). Here we focus on the -nearest neighbor rule (NN) initially proposed by Fix and Hodges (1951) and further studied for instance by Devroye and Wagner (1977); Rogers and Wagner (1978).
The NN algorithm
For , the NN rule, denoted by , consists in classifying any new observation using a majority vote decision rule based on the label of the points closest to among the training sample . In what follows these nearest neighbors are chosen according to the distance associated with the usual Euclidean norm in . Note that other adaptive metrics have been also considered in the literature (see for instance Hastie et al., 2001, Chap. 14 ). But such examples are out of the scope of the present work that is, our reference distance does not depend on the training sample at hand. Let us also emphasize that possible ties are broken by using the smallest index among ties, which is one possible choice for the Stone lemma to hold true (Biau and Devroye, 2016, Lemma 10.6, p.125).
Formally, given the set of indices of the nearest neighbors of among , the kNN classification rule is defined by
| (2.4) |
where is the label of the -th nearest neighbor of for , and denotes a Bernoulli random variable with parameter 1/2.
Leave--out cross-validation
For a given sample , the performance of any classifier (respectively of any classification algorithm ) is assessed by the classification error (respectively the risk ) defined by
In this paper we focus on the estimation of (and its expectation ) by use of the Leave--Out (LO) cross-validation for (Zhang, 1993; Celisse and Robin, 2008). LO successively considers all possible splits of into a training set of cardinality and a test set of cardinality . Denoting by the set of all possible subsets of with cardinality , any defines a split of into a training sample and a test sample , where . For a given classification algorithm , the final LO estimator of the performance of is the average (over all possible splits) of the classification error estimated on each test set, that is
| (2.5) |
where is the classifier built from . We refer the reader to Arlot and Celisse (2010) for a detailed description of LO and other cross-validation procedures. In the sequel, the lengthy notation is replaced by in settings where no confusion can arise about the algorithm or the training sample , and by if the training sample has to be kept in mind.
Exact LO for the NN classification algorithm
Usually due to its seemingly prohibitive computational cost, LO is not applied except with where it reduces to the well known leave-one-out. However unlike this widespread idea Celisse and Robin (2008); Celisse (2008, 2014) proved that the LO estimator can be efficiently computed by deriving closed-form formulas in several statistical frameworks. The NN classification rule is another instance for which efficiently computing the LO estimator is possible with a time complexity linear in as previously established by Celisse and Mary-Huard (2011). Let us briefly recall the main steps leading to the closed-form formula.
-
1.
From Eq. (2.5) the LO estimator can be expressed as a sum (over the observations of the complete sample) of probabilities:
Here means that the integration is computed with respect to the random variable , which follows the uniform distribution over the possible subsets with cardinality in . For instance since it is the proportion of subsamples with cardinality which do not contain a given prescribed index , which equals . (See also Lemma D.4 for further examples of such calculations.)
-
2.
For any , let be the ordered sequence of neighbors of . This list depends on , i.e. should be noted , but this dependency is skipped here for the sake of readability.
The key in the derivation is to condition with respect to the random variable which denotes the rank (in the whole sample ) of the th neighbor of in the , that is means that is the -th neighbor of in . Then
where the sum involves terms since only are candidates for being the -th neighbor of in at least one training subset .
-
3.
Observe that the resulting probabilities can be easily computed (see Lemma D.4):
with , , and , where denotes the hypergeometric distribution and is the number of 1’s among the nearest neighbors of in .
The computational cost of LO for the NN classifier is the same as that of LO for the NN classifier whatever , that is . This contrasts with the usual prohibitive computational complexity seemingly suffered by LO.
2.2 -statistics: General bounds on LO moments
The purpose of the present section is to describe a general strategy allowing to derive new upper bounds on the polynomial moments of the LO estimator. As a first step of this strategy, we establish the connection between the LO risk estimator and U-statistics. Second, we exploit this connection to derive new upper bounds on the order- moments of the LO estimator for . Note that these upper bounds, which relate moments of the LO estimator to those of the L1O estimator, hold true with any classifier.
Let us start by introducing -statistics and recalling some of their basic properties that will serve our purposes. For a thorough presentation, we refer to the books by Serfling (1980); Koroljuk and Borovskich (1994). The first step is the definition of a -statistic of order as an average over all -tuples of distinct indices in .
Definition 2.1 (Koroljuk and Borovskich (1994)).
Let (or ) denote any Borelian function where is an integer. Let us further assume is a symmetric function of its arguments. Then any function such that
where , is a -statistic of order and kernel .
Before clarifying the connection between LO and -statistics, let us introduce the main property of -statistics our strategy relies on. It consists in representing any U-statistic as an average, over all permutations, of sums of independent variables.
Proposition 2.1 (Eq. (5.5) in Hoeffding (1963)).
With the notation of Definition 2.1, let us define by
| (2.6) |
where denotes the integer part of . Then
where denotes the summation over all permutations of .
We are now in position to state the key remark of the paper. All the developments further exposed in the following result from this connection between the LO estimator defined by Eq. (2.5) and -statistics.
Theorem 2.1.
For any classification rule and any such that the following quantities are well defined, the LO estimator is a U-statistic of order with kernel defined by
where denotes the sample with withdrawn.
Proof of Theorem 2.1.
From Eq. (2.5), the LO estimator of the performance of any classification algorithm computed from satisfies
since there is a unique set of indices with cardinality such that . Then
Furthermore for and fixed, since there is a unique set of indices such that . One gets
by noticing
∎
The kernel is a deterministic and symmetric function of its arguments that does only depend on . Let us also notice that reduces to the L1O estimator of the risk of the classification rule computed from , that is
| (2.7) |
In the context of testing whether two binary classifiers have different error rates, this fact has already been pointed out by Fuchs et al. (2013).
We now derive a general upper bound on the -th moment () of the LO estimator that holds true for any classification rule as long as the following quantities remain meaningful.
Theorem 2.2.
For any classification rule , let and be the corresponding classifiers built from respectively and , where . Then for every such that the following quantities are well defined, and any ,
| (2.8) |
Furthermore as long as , one also gets
-
•
for
(2.9) -
•
for every
(2.10) where is a numeric constant and denotes the optimal constant defined in the Rosenthal inequality (Proposition D.2).
The proof is given in Appendix A.1. Eq. (2.8) and Eq. (2.9) straightforwardly result from the Jensen inequality applied to the average over all permutations provided in Proposition 2.1. If , the integer part becomes larger than 1 and Eq. (2.9) becomes better than Eq. (2.8) for . As a consequence of our strategy of proof, the right-hand side of Eq. (2.9) is equal to the classical upper bound on the variance of U-statistics which suggests it cannot be improved without adding further assumptions.
Unlike the above ones, Eq. (• ‣ 2.2) is derived from the Rosenthal inequality, which enables us to upper bound a sum of independent and identically centered random variables in terms of and . Let us remark that, for , both terms of the right-hand side of Eq. (• ‣ 2.2) are of the same order as Eq. (2.9) up to constants. Furthermore using the Rosenthal inequality allows us to take advantage of the integer part when , unlike what we get by using Eq.(2.8) for . In particular it provides a new understanding of the behavior of the LO estimator when as highlighted later by Proposition 4.2.
3 New bounds on LO moments for the NN classifier
Our goal is now to specify the general upper bounds provided by Theorem 2.2 in the case of the NN classification rule () introduced by (2.4).
Since Theorem 2.2 expresses the moments of the LO estimator in terms of those of the L1O estimator computed from (with ), the next step consists in focusing on the L1O moments. Deriving upper bounds on the moments of the L1O is achieved using a generalization of the well-known Efron-Stein inequality (see Theorem D.1 for Efron-Stein’s inequality and Theorem 15.5 in Boucheron et al. (2013) for its generalization). For the sake of completeness, we first recall a corollary of this generalization that is proved in Section D.1.4 (see Corollary D.1).
Proposition 3.1.
Let denote independent random variables and , where is any Borelian function. With independent copies of the s, there exists a universal constant such that for any ,
Then applying Proposition 3.1 with (LO estimator computed from with ) leads to the following Theorem 3.1, which finally allows us to control the order- moments of the L1O estimator applied to the NN classifier.
Theorem 3.1.
For every , let () denote the NN classifier learnt from and be the corresponding LO estimator given by Eq. (2.5). Then
-
•
for ,
(3.1) -
•
for every ,
(3.2)
with and , where is a constant (arising from Stone’s lemma, see Lemma D.5) that grows exponentially with dimension , and is defined in Proposition 3.1.
Its proof (detailed in Section A.2) involves the use of Stone’s lemma (Lemma D.5), which upper bounds, for a given , the number of points in having among their nearest neighbors by . The dependence of our upper bounds with respect to (see explicit constants and ) induces their strong deterioration as the dimension grows since . Therefore the larger the dimension , the larger the required sample size for the upper bound to be small (at least smaller than 1). Note also that the tie breaking strategy (based on the smallest index) is chosen so that it ensures Stone’s lemma to hold true.
In Eq. (3.1), the easier case enables to exploit exact calculations (rather than upper bounds) of the variance of the L1O. Further noticing (risk of the NN classifier learnt from ), the resulting rate is a strict improvement upon the usual upper bound in which is derived from using the sub-Gaussian exponential concentration inequality provided by Theorem 24.4 in Devroye et al. (1996).
By contrast the larger in Eq. (3.2) comes from the difficulty to derive a tight upper bound with for the expectation of , where (resp. ) denotes the sample where has been (resp. and have been) removed.
We are now in position to state the main result of this section. It follows from the combination of Theorem 2.2 (connecting moments of the LO estimator to those of the L1O) and Theorem 3.1 (providing an upper bound on the order- moments of the L1O).
Theorem 3.2.
For every such that , let denote the LO risk estimator (see (2.5)) of the NN classifier defined by (2.4). Then there exist (known) constants such that for every ,
-
•
for ,
(3.3) -
•
for every ,
(3.4)
with and , where denotes the constant arising from Stone’s lemma (Lemma D.5). Furthermore in the particular setting where , then
-
•
for ,
(3.5) -
•
for every ,
(3.6) where .
The straightforward proof is detailed in Section A.3. Let us start by noticing that both upper bounds in Eq. (3.3) and (3.4) deteriorate as grows. This is no longer the case for Eq. (3.5) and (3.6), which are specifically designed to cover the setup where , that is where is no longer equal to 1. Therefore unlike Eq. (3.3) and (3.4), these last two inequalities are particularly relevant in the setup where , as , which has been investigated in different frameworks by Shao (1993); Yang (2006, 2007); Celisse (2014). Eq. (3.5) and (3.6) lead to respective convergence rates at worse (for ) and (for ). In particular this last rate becomes approximately equal to as gets large.
One can also emphasize that, as a U-statistic of fixed order , the LO estimator has a known Gaussian limiting distribution, that is (see Theorem A, Section 5.5.1 Serfling, 1980)
where , with . Therefore the upper bound given by Eq. (3.5) is non-improvable in some sense with respect to the interplay between and since one recovers the right magnitude for the variance term as long as is assumed to be constant.
Finally Eq. (3.6) has been derived using a specific version of the Rosenthal inequality (Ibragimov and Sharakhmetov, 2002) stated with the optimal constant and involving a “balancing factor”. In particular this balancing factor has allowed us to optimize the relative weight of the two terms between brackets in Eq. (3.6). This leads us to claim that the dependence of the upper bound with respect to cannot be improved with this line of proof. However we cannot conclude that the term in cannot be improved using other technical arguments.
4 Exponential concentration inequalities
This section provides exponential concentration inequalities for the LO estimator applied to the NN classifier. Our main results heavily rely on the moments inequalities previously derived in Section 3, that is Theorem 3.2. In order to emphasize the gain allowed by this strategy of proof, we start this section by successively proving two exponential inequalities obtained with less sophisticated tools. We then discuss the strength and weakness of each of them to justify the additional refinements we introduce step by step along the section.
A first exponential concentration inequality for can be derived by use of the bounded difference inequality following the line of proof of Devroye et al. (1996, Theorem 24.4) originally developed for the L1O estimator.
Proposition 4.1.
The proof is given in Appendix B.1.
The upper bound of Eq. (4.1) strongly exploits the facts that: (i) for to be one of the nearest neighbors of in at least one subsample , it requires to be one of the nearest neighbors of in the complete sample, and (ii) the number of points for which may be one of the nearest neighbors cannot be larger than by Stone’s Lemma (see Lemma D.5).
This reasoning results in a rough upper bound since the denominator in the exponent exhibits a factor where and play the same role. The reason is that we do not distinguish between points for which is among or above the nearest neighbors of in the whole sample, although these two setups lead to strongly different probabilities of being among the nearest neighbors in the training resample. Consequently the dependence of the convergence rate on and in Proposition 4.1 can be improved, as confirmed by forthcoming Theorems 4.1 and 4.2.
Based on the previous comments, a sharper quantification of the influence of each neighbor among the ones leads to the next result.
Theorem 4.1.
The proof is given in Section B.2.
Let us remark that unlike Proposition 4.1, taking into account the rank of each neighbor in the whole sample enables to considerably reduce the weight of (compared to that of ) in the denominator of the exponent. In particular, one observes that letting as (with assumed to be fixed for instance) makes the influence of the factor asymptotically negligible. This would allow to recover (up to numeric constants) a similar upper bound to that of Devroye et al. (1996, Theorem 24.4), achieved with .
However the upper bound of Theorem 4.1 does not reflect the right dependencies with respect to and compared with what has been proved for polynomial moments in Theorem 3.2. The upper bound seems to strictly deteriorate as increases, which contrasts with the upper bounds derived for in Theorem 3.2. This drawback is overcome by the following result, which is our main contribution in the present section.
Theorem 4.2.
The proof has been postponed to Appendix B.3. It involves different arguments for the two inequalities (4.2) and (4.3) depending on the range of values of . Firstly for , a simple argument is applied to derive Ineq. (4.2) from the two corresponding moment inequalities of Theorem 3.2 characterizing the sub-Gaussian behavior of the LO estimator in terms of its even moments (see Lemma D.2). Secondly for , we rather exploit: the appropriate upper bounds on the moments of the LO estimator given by Theorem 3.2, and a dedicated Proposition D.1 which provides exponential concentration inequalities from general moment upper bounds.
In accordance with the conclusions drawn about Theorem 3.2, the upper bound of Eq. (4.2) increases as grows, unlike that of Eq. (4.3) which improves as increases. In particular the best concentration rate in Eq. (4.3) is achieved as , whereas Eq. (4.2) turns out to be useless in that setting. Let us also notice that Eq. (4.2) remains strictly better than Theorem 4.1 as long as , as . Note also that the constants and are the same as in Theorem 3.1. Therefore the same comments regarding their dependence with respect to the dimension apply here.
In order to facilitate the interpretation of the last Ineq. (4.3), we also derive the following proposition (proved in Appendix B.3) which focuses on the description of each deviation term in the particular case where .
Proposition 4.2.
The present inequality is very similar to the well-known Bernstein inequality (Boucheron et al., 2013, Theorem 2.10) except the second deviation term of order instead of (for the Bernstein inequality).
With respect to , the first deviation term is of order , which is the same as with the Bernstein inequality. The second deviation term is of a somewhat different order, that is , as compared with the usual in the Bernstein inequality. Note that we almost recover this rate by choosing for instance , which leads to . Therefore varying allows to interpolate between the and the rates.
Note also that the dependence of the first (sub-Gaussian) deviation term with respect to is only , which improves upon the usual resulting from Ineq. (4.2) in Theorem 4.2 for instance. However this remains certainly too large for being optimal even if this question remains widely open at this stage in the literature.
More generally one strength of our approach is its versatility. Indeed the two above deviation terms directly result from the two upper bounds on the moments of the L1O stated in Theorem 3.1. Therefore any improvement of the latter upper bounds would immediately lead to enhance the present concentration inequality (without changing the proof).
5 Assessing the gap between LO and classification error
5.1 Upper bounds
First, we derive new upper bounds on different measures of the discrepancy between and the classification error or the risk . These bounds on the LO estimator are completely new for , some of them being extensions of former ones specifically derived for the L1O estimator applied to the NN classifier.
Theorem 5.1.
By contrast with the results in the previous sections, a new restriction on arises in Theorem 5.1, that is . It is the consequence of using Lemma D.6 in the above proof to quantify how different two classifiers respectively computed from the same and points can be. Indeed this lemma, which provides an upper bound on the stability of the NN classifier previously proved by Devroye and Wagner (1979b), only remains meaningful as long as .
Proof of Theorem 5.1.
Keeping in mind that , the right-hand side of Ineq. (5.1) is an upper bound on the bias of the LO estimator, that is on the difference between the risks of the classifiers built from respectively and points. Therefore, the fact that this upper bound increases with is reliable since the classifiers and can become more and more different from one another as increases. More precisely, the upper bound in Ineq. (5.1) goes to 0 provided does. With the additional restriction , this reduces to the usual condition as (see Devroye et al., 1996, Chap. 6.6 for instance). The monotonicity of this upper upper bound with respect to can seem somewhat unexpected. One could think that the two classifiers would become more and more “similar” to each other as increases. However it can be proved that, in some sense, this dependence cannot be improved in the present distribution-free framework (see Proposition 5.1 and Figure 1).
Note that an upper bound similar to that of Ineq. (5.2) can be easily derived for any order- moment () at the price of increasing the constants by using , for every . We also emphasize that Ineq. (5.2) allows us to control the discrepancy between the LO estimator and the risk of the NN classifier, that is the expectation of its classification error. Ideally we would have liked to replace the risk by the prediction error . But with our strategy of proof, this would require an additional distribution-free concentration inequality on the prediction error of the NN classifier. To the best of our knowledge, such a concentration inequality is not available up to now.
Upper bounding the squared difference between the LO estimator and the prediction error is precisely the purpose of Ineq. (5.3). Proving the latter inequality requires a completely different strategy which can be traced back to an earlier proof by Rogers and Wagner (1978, see the proof of Theorem 2.1) applying to the L1O estimator. Let us mention that Ineq. (5.3) combined with the Jensen inequality lead to a less accurate upper bound than Ineq. (5.1).
Finally the apparent difference between the upper bounds in Ineq. (5.2) and (5.3) results from the completely different schemes of proof. The first one allows us to derive general upper bounds for all centered moments of the LO estimator, but exhibits a worse dependence with respect to . By contrast the second one is exclusively dedicated to upper bounding the mean squared difference between the prediction error and the LO estimator and leads to a smaller . However (even if probably not optimal), the upper bound used in Ineq. (5.2) still enables to achieve minimax rates over some Hölder balls as proved by Proposition 5.3.
5.2 Lower bounds
5.2.1 Bias of the LO estimator
The purpose of the next result is to provide a counter-example highlighting that the upper bound of Eq. (5.1) cannot be improved in some sense. We consider the following discrete setting where with , and we define and . In what follows this two-class generative model will be referred to as the discrete setting DS.
Note that the 3 parameters and fully describe the joint distribution , and the distribution of DS satisfies the strong margin assumption of Massart and Nédélec (2006) if both and are chosen away from 1/2. However this favourable setting has no particular effect on the forthcoming lower bound except a few simplifications along the calculations.
Proposition 5.1.
Let us consider the DS setting with , and , and assume that is odd. Then there exists a numeric constant independent of and such that, for all , the NN classifiers and satisfy
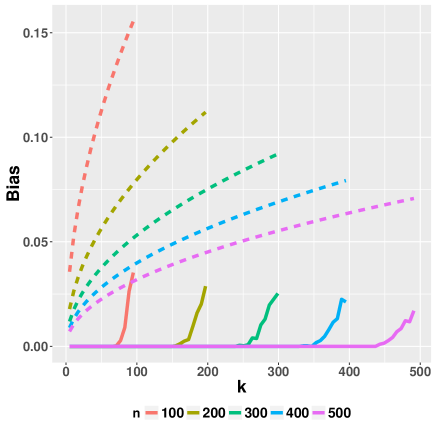
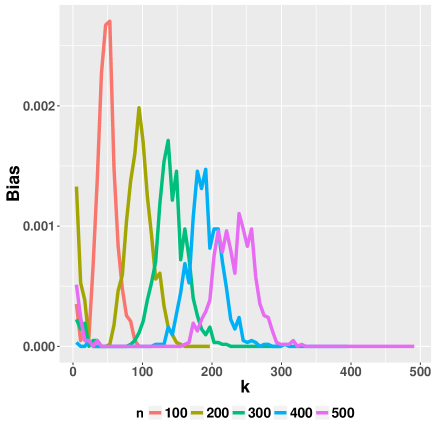
The proof of Proposition 5.1 is provided in Appendix C.2. The rate in the right-hand side of Eq. (5.1) is then achieved under the generative model DS for any . As a consequence this rate cannot be improved without any additional assumption, for instance on the distribution of the s. See also Figure 1 below and related comments.
Empirical illustration
To further illustrate the result of Proposition 5.1, we simulated data according to the DS setting, for different values of ranging from 100 to 500 and different values of ranging from 5 to .
Figure 1 (a) displays the evolution of the absolute bias as a function of , for several values of (plain curves). The absolute bias is a nondecreasing function of , as suggested by the upper bound provided in Eq. (5.1) which is also plotted (dashed lines) to ease the comparison. Importantly, the non-decreasing behavior of the absolute bias is not always restricted to high values of (w.r.t. ), as illustrated in Figure 1 (b) which corresponds to the same DS setting but with parameter values . In particular the non-decreasing behavior now appears for a range of values of that are lower than .
Note that a rough idea about the location of the peak, denoted by , can be deduced as follows in the simple case where and .
-
•
For the peak to arise, the two classifiers (based on and respectively observations) have to disagree the most strongly.
-
•
This requires one of the two classifiers – say the first one – to have ties among the nearest neighbors of each label in at least one of the two cases or .
-
•
With , then ties will most likely occur for the case . Therefore the discrepancy between the two classifiers will be the highest at any new observation .
-
•
For the tie situation to arise at , half of its neighbors have to be 1. This only occurs if (with the number of observations such that in the training set), and , where (resp. ) is the number of neighbors of such that (resp. ).
-
•
Since , one has and the last expression boils down to
-
•
For large values of , one should have , that is the peak should appear at
In the setting of Proposition 5.1, this reasoning remarkably yields , while it leads to in the setting of Figure 1 (b), which is close to the location of the observed peaks. This also suggests that even smaller values of can arise by tuning the parameter close to 0. Let us mention that very similar curves have been obtained for a Gaussian mixture model with two disjoint classes (not reported here). On the one hand this empirically illustrates that the rate is not limited to the discrete setting DS. On the other hand, all of this confirms that this rate cannot be improved in the present distribution-free framework.
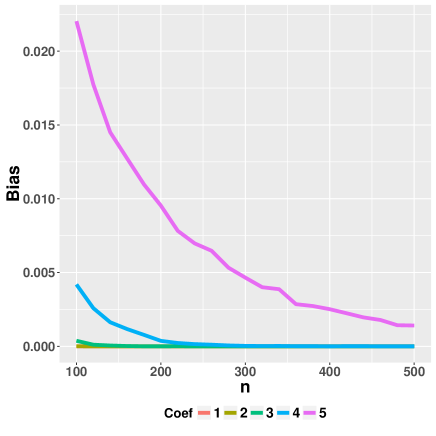
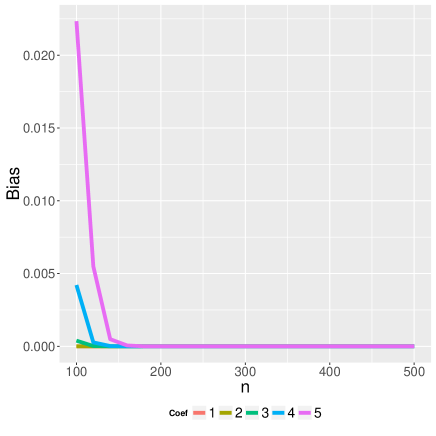
Let us finally consider Figure 1 (c), which displays the absolute bias as a function of where for different values of Coef, where denotes the integer part. With this choice of , Proposition 5.1 implies that the absolute bias should decrease at a rate, which is supported by the plotted curves. By contrast, panel (d) of Figure 1 illustrates that choosing smaller values of , that is , leads to a faster decreasing rate.
 |
 |
| (a) | (b) |
 |
 |
| (c) | (d) |
5.2.2 Mean squared error
Following an example described by Devroye and Wagner (1979a), we now provide a lower bound on the minimal convergence rate of the mean squared error (see also Devroye et al., 1996, Chap. 24.4, p.415 for a similar argument).
Proposition 5.2.
Let us assume is even, and that is independent of . Then for ( odd), it results
5.3 Minimax rates
Let us conclude this section with a corollary, which provides a finite-sample bound on the gap between and with high probability. It is stated under the same restriction on as the previous Theorem 5.1 it is based on, that is for .
Corollary 5.1.
Proof of Corollary 5.1.
Note that the right-hand side of Ineq. (5.4) could be used to derive bounds on that seem similar to confidence bounds. However we do not recommend doing this in practice for several reasons. On the one hand, Ineq. (5.4) results from the repeated use of concentration inequalities where numeric constants are not optimized at all, which leads to require a large sample size for the deviation terms to be small in practice. On the other hand, explicit numeric constants such as in Corollary 5.1 exhibit a dependence on , which becomes exponentially large as increases. Proving that this dependence can be weakened or not remains a completely open question at this stage. Nevertheless one can highlight that, for a given , increasing will quickly make the deviation term larger than 1, whereas both and belong to .
The right-most term of order in Ineq. (5.4) results from the bias. This is a necessary price to pay which cannot be improved in the present distribution-free framework according to Proposition 5.1. Besides combining the restriction with the usual consistency constraint leads to the conclusion that small values of (w.r.t. ) have almost no effect on the convergence rate of the LO estimator. Weakening the key restriction would be necessary to potentially nuance this conclusion.
In order to highlight the interest of the above deviation inequality, let us deduce an optimality result in terms of minimax rate. In the following statement, Corollary 5.1 is used to prove that, uniformly with respect to , the LO estimator and the risk of the NN classifier remain close to each other with high probability.
Proposition 5.3.
With the same notation as Corollary 5.1, for every and , there exists an event of probability at least on which, for any such that , , and , the LO estimator of the NN classifier satisfies
| (5.5) |
where denotes the classification error of the Bayes classifier.
Furthermore if one assumes the regression function belongs to a Hölder ball for some (recall that ) and , then choosing leads to
| (5.6) |
Ineq. (5.5) gives a uniform control (over ) of the gap between the excess risk and the corresponding LO estimator with high probability. The decreasing rate (in ) of this probability is directly related to the factor in the lower and upper bounds. This decreasing rate could be made faster at the price of increasing the exponent of the factor. In a similar way the numeric constant has no precise meaning and can be chosen as close to 0 as we want, leading to increase one of the other deviation terms by a numeric factor . For instance one could choose , which would replace the by a .
The equivalence stated by (5.6) results from knowing that this choice makes the NN classifier achieve the minimax rate over Hölder balls with smoothness parameter (see Theorems 3.3 and 3.5 in Audibert and Tsybakov, 2007). Therefore it is not difficult to check that the other deviation terms are negligible with respect to the excess risk for .
Proof of Proposition 5.3.
Let us define as the maximum value of and assume (for some constant ) for any . Let us also introduce the event
Then , as , since a union bound leads to
Let us now choose . Then Theorems 3.3 and 3.5 in Audibert and Tsybakov (2007) combined with Theorem 7 in Chaudhuri and Dasgupta (2014) provide that the minimax rate of the NN classifier is
where means there exist numeric constants such that .
It is then easy to check that
-
•
,
-
•
.
The desired conclusion (5.6) finally results from choosing . ∎
6 Discussion
The present work provides several new results quantifying the performance of the LO estimator applied to the NN classifier. By exploiting the connexion between LO and U-statistics (Section 2), the polynomial and exponential inequalities derived in Sections 3 and 4 give some new insight on the concentration of the LO estimator around its expectation for different regimes of . In Section 5, these results serve for instance to conclude to the consistency of the LO estimator towards the risk (or the classification error rate) of the NN classifier (Theorem 5.1). They also allow us to establish the asymptotic equivalence between the LO estimator (shifted by the Bayes risk ) and the excess risk over some Hölder class of regression functions (Proposition 5.3).
It is worth mentioning that the upper-bounds derived in Sections 4 and 5 — see for instance Theorem 5.1 — can be minimized by choosing , suggesting that the L1O estimator is optimal in terms of risk estimation when applied to the NN classification algorithm. This observation corroborates the results of the simulation study presented in Celisse and Mary-Huard (2011), where it is empirically shown that small values of (and in particular ) lead to the best estimation of the risk, whatever the value of parameter or the level of noise in the data. The suggested optimality of L1O (for risk estimation) is also consistent with results by Burman (1989) and Celisse (2014), where it is proved that L1O is asymptotically the best cross-validation procedure to perform risk estimation in the context of low-dimensional regression and density estimation respectively.
Alternatively, the LO estimator can also be used as a data-dependent calibration procedure to choose : the value leading to the minimum LO estimate is selected. Although the focus of the present paper is different, it is worth mentioning that the concentration results established in Section 4 are a significant early step towards deriving theoretical guarantees on LO as a model selection procedure. Indeed, exponential concentration inequalities have been a key ingredient to assess model selection consistency or model selection efficiency in various contexts (see for instance Celisse (2014) or Arlot and Lerasle (2012) in the density estimation framework). Still theoretically investigating the behavior of requires some further dedicated developments. One first step towards such results is to derive a tighter upper bound on the bias between the LO estimator and the risk. The best known upper bound currently available is derived from Devroye and Wagner (1980, see Lemma D.6 in the present paper). Unfortunately it does not fully capture the true behavior of the LO estimator with respect to (at least as becomes large) and could be improved in particular for as emphasized in the comments following Theorem 5.1. Another important direction for studying the model selection behavior of the LO procedure is to prove a concentration inequality for the classification error rate of the NN classifier around its expectation. While such concentration results have been established for the NN algorithm in the (fixed-design) regression framework (Arlot and Bach, 2009), deriving similar results in the classification context remains a challenging problem to the best of our knowledge.
References
- Andoni and Indyk [2006] A. Andoni and P. Indyk. Near-optimal hashing algorithms for approximate nearest neighbor in high dimensions. In Foundations of Computer Science, 2006. FOCS’06. 47th Annual IEEE Symposium on, pages 459–468. IEEE, 2006.
- Arlot [2007] S. Arlot. Resampling and Model Selection. PhD thesis, University Paris-Sud 11, December 2007. URL http://tel.archives-ouvertes.fr/tel-00198803/en/. oai:tel.archives-ouvertes.fr:tel-00198803_v1.
- Arlot and Bach [2009] S. Arlot and F. Bach. Data-driven calibration of linear estimators with minimal penalties. Advances in Neural Information Processing Systems (NIPS), 2:46–54, 2009.
- Arlot and Celisse [2010] S. Arlot and A. Celisse. A survey of cross-validation procedures for model selection. Statistics Surveys, 4:40–79, 2010.
- Arlot and Lerasle [2012] S. Arlot and M. Lerasle. Why v= 5 is enough in v-fold cross-validation. arXiv preprint arXiv:1210.5830, 2012.
- Audibert and Tsybakov [2007] J.-Y. Audibert and A. Tsybakov. Fast learning rates for plug-in estimators under the margin condition. The Annals of Statistics, 35(2), 2007.
- Biau and Devroye [2016] G. Biau and L. Devroye. Lectures on the nearest neighbor method. Springer, 2016.
- Biau et al. [2010a] G. Biau, F. Cérou, and A. Guyader. On the rate of convergence of the bagged nearest neighbor estimate. The Journal of Machine Learning Research, 11:687–712, 2010a.
- Biau et al. [2010b] G. Biau, F. Cérou, and A. Guyader. Rates of convergence of the functional-nearest neighbor estimate. Information Theory, IEEE Transactions on, 56(4):2034–2040, 2010b.
- Boucheron et al. [2005] S. Boucheron, O. Bousquet, G. Lugosi, and P. Massart. Moment inequalities for functions of independent random variables. Ann. Probab., 33(2):514–560, 2005. ISSN 0091-1798.
- Boucheron et al. [2013] S. Boucheron, G. Lugosi, and P. Massart. Concentration Inequalities: A Nonasymptotic Theory of Independence. Oxford University Press, 2013.
- Burman [1989] P. Burman. Comparative study of Ordinary Cross-Validation, v-Fold Cross-Validation and the repeated Learning-Testing Methods. Biometrika, 76(3):503–514, 1989.
- Celisse [2008] A. Celisse. Model selection via cross-validation in density estimation, regression and change-points detection. (In English). PhD thesis, University Paris-Sud 11. http://tel.archives-ouvertes.fr/tel-00346320/en/., December 2008. URL http://tel.archives-ouvertes.fr/tel-00346320/en/.
- Celisse [2014] A. Celisse. Optimal cross-validation in density estimation with the -loss. The Annals of Statistics, 42(5):1879–1910, 2014.
- Celisse and Mary-Huard [2011] A. Celisse and T. Mary-Huard. Exact cross-validation for knn: applications to passive and active learning in classification. JSFdS, 152(3), 2011.
- Celisse and Robin [2008] A. Celisse and S. Robin. Nonparametric density estimation by exact leave-p-out cross-validation. Computational Statistics and Data Analysis, 52(5):2350–2368, 2008.
- Chaudhuri and Dasgupta [2014] K. Chaudhuri and S. Dasgupta. Rates of convergence for nearest neighbor classification. In Advances in Neural Information Processing Systems, pages 3437–3445, 2014.
- Cover [1968] T. M. Cover. Rates of convergence for nearest neighbor procedures. In Proceedings of the Hawaii International Conference on Systems Sciences, pages 413–415, 1968.
- Cover and Hart [1967] T. M. Cover and P. E. Hart. Nearest neighbor pattern classification. Information Theory, IEEE Transactions on, 13(1):21–27, 1967.
- Devroye and Wagner [1979a] L. Devroye and T. Wagner. Distribution-free performance bounds for potential function rules. IEEE Transactions on Information Theory, 25:601–604, 1979a.
- Devroye et al. [1996] L. Devroye, L. Györfi, and G. Lugosi. A Probilistic Theory of Pattern Recognition. Springer Verlag, 1996.
- Devroye and Wagner [1977] L. P. Devroye and T. J. Wagner. The strong uniform consistency of nearest neighbor density estimates. Ann. Statist., 5(3):536–540, 1977. ISSN 0090-5364.
- Devroye and Wagner [1979b] L. P. Devroye and T. J. Wagner. Distribution-free inequalities for the deleted and holdout error estimates. Information Theory, IEEE Transactions on, 25(2):202–207, 1979b.
- Devroye and Wagner [1980] L.P. Devroye and T.J. Wagner. Distribution-free consistency results in nonparametric discrimination and regression function estimation. Ann. Statist., 8(2):231–239, 1980.
- Fix and Hodges [1951] E. Fix and J. Hodges. Nearest Neighbor (NN) Norms: NN Pattern Classification Techniques, chapter Discriminatory analysis- nonparametric discrimination: Consistency principles. IEEE Computer Society Press, Los Alamitos, CA, 1951. Reprint of original work from 1952.
- Fuchs et al. [2013] M. Fuchs, R. Hornung, R. De Bin, and A.-L. Boulesteix. A u-statistic estimator for the variance of resampling-based error estimators. Technical report, arXiv, 2013.
- Geisser [1975] S. Geisser. The predictive sample reuse method with applications. J. Amer. Statist. Assoc., 70:320–328, 1975.
- Györfi [1981] L. Györfi. The rate of convergence of -nn regression estimates and classification rules. IEEE Trans. Commun, 27(3):362–364, 1981.
- Hall et al. [2008] P. Hall, B. U. Park, and R. J. Samworth. Choice of neighbor order in nearest-neighbor classification. The Annals of Statistics, pages 2135–2152, 2008.
- Hastie et al. [2001] T. Hastie, R. Tibshirani, and J. Friedman. The elements of statistical learning. Springer Series in Statistics. Springer-Verlag, New York, 2001. ISBN 0-387-95284-5. Data mining, inference, and prediction.
- Hoeffding [1963] W. Hoeffding. Probability inequalities for sums of bounded random variables. Journ. of the American Statistical Association, 58(301):13–30, 1963.
- Ibragimov and Sharakhmetov [2002] R. Ibragimov and S. Sharakhmetov. On extremal problems and best constants in moment inequalities. Sankhyā: The Indian Journal of Statistics, Series A, pages 42–56, 2002.
- Indyk and Motwani [1998] P. Indyk and R. Motwani. Approximate nearest neighbors: towards removing the curse of dimensionality. In Proceedings of the thirtieth annual ACM symposium on Theory of computing, pages 604–613. ACM, 1998.
- Kearns and Ron [1999] M. Kearns and D. Ron. Algorithmic Stability and Sanity-Check Bounds for Leave-One-Out Cross-Validation. Neural Computation, 11:1427–1453, 1999.
- Koroljuk and Borovskich [1994] V. S. Koroljuk and Y. V. Borovskich. Theory of U-statistics. Springer, 1994.
- Kulkarni and Posner [1995] S. R. Kulkarni and S. E. Posner. Rates of convergence of nearest neighbor estimation under arbitrary sampling. Information Theory, IEEE Transactions on, 41(4):1028–1039, 1995.
- Li et al. [2004] L. Li, D. M. Umbach, P. Terry, and J. A. Taylor. Application of the ga/knn method to seldi proteomics data. Bioinformatics, 20(10):1638–1640, 2004.
- Massart and Nédélec [2006] Pascal Massart and Élodie Nédélec. Risk bounds for statistical learning. The Annals of Statistics, pages 2326–2366, 2006.
- Psaltis et al. [1994] D. Psaltis, R. R. Snapp, and S. S. Venkatesh. On the finite sample performance of the nearest neighbor classifier. Information Theory, IEEE Transactions on, 40(3):820–837, 1994.
- Rogers and Wagner [1978] W. H. Rogers and T. J. Wagner. A finite sample distribution-free performance bound for local discrimination rules. Annals of Statistics, 6(3):506–514, 1978.
- Scheirer and Slaney [2003] E. D. Scheirer and M. Slaney. Multi-feature speech/music discrimination system, May 27 2003. US Patent 6,570,991.
- Serfling [1980] R. J. Serfling. Approximation Theorems of Mathematical Statistics. John Wiley & Sons Inc., 1980.
- Shao [1993] J. Shao. Linear model selection by cross-validation. J. Amer. Statist. Assoc., 88(422):486–494, 1993. ISSN 0162-1459.
- Simard et al. [1998] P. Y. Simard, Y. A. LeCun, J. S. Denker, and B. Victorri. Transformation invariance in pattern recognition tangent distance and tangent propagation. In Neural networks: tricks of the trade, pages 239–274. Springer, 1998.
- Snapp and Venkatesh [1998] R. R Snapp and S. S. Venkatesh. Asymptotic expansions of the nearest neighbor risk. The Annals of Statistics, 26(3):850–878, 1998.
- Steele [2009] B. M. Steele. Exact bootstrap k-nearest neighbor learners. Machine Learning, 74(3):235–255, 2009.
- Stone [1982] C. J. Stone. Optimal global rates of convergence for nonparametric regression. Ann. Statist., 10(4):1040–1053, 1982. ISSN 0090-5364.
- Stone [1974] M. Stone. Cross-validatory choice and assessment of statistical predictions. J. Roy. Statist. Soc. Ser. B, 36:111–147, 1974. ISSN 0035-9246. With discussion by G. A. Barnard, A. C. Atkinson, L. K. Chan, A. P. Dawid, F. Downton, J. Dickey, A. G. Baker, O. Barndorff-Nielsen, D. R. Cox, S. Giesser, D. Hinkley, R. R. Hocking, and A. S. Young, and with a reply by the authors.
- Yang [2006] Y. Yang. Comparing learning methods for classification. Statist. Sinica, 16(2):635–657, 2006. ISSN 1017-0405.
- Yang [2007] Y. Yang. Consistency of cross-validation for comparing regression procedures. The Annals of Statistics, 35(6):2450–2473, 2007.
- Zhang [1993] P. Zhang. Model selection via multifold cross validation. Ann. Statist., 21(1):299–313, 1993. ISSN 0090-5364.
A Proofs of polynomial moment upper bounds
A.1 Proof of Theorem 2.2
The proof relies on Proposition 2.1 that allows to relate the LO estimator to a sum of independent random variables. In the following, we distinguish between the two settings (where exact calculations can be carried out), and where only upper bounds can be derived.
When , our proof deals separately with the cases and . In the first one, a straightforward use of Jensen’s inequality leads to the result. In the second setting, one has to be more cautious when deriving upper bounds. This is done by using the more sophisticated Rosenthal’s inequality, namely Proposition D.2.
A.1.1 Exploiting Proposition 2.1
According to the proof of Proposition 2.1, it arises that the LO estimator can be expressed as a -statistic since
with
where denotes the classifier based on sample . Further centering the LO estimator, it comes
where .
Then with , one gets
| (A.1) | ||||
A.1.2 The setting
If , then by independence it comes
which leads to the result.
A.1.3 The setting
If :
A straightforward use of Jensen’s inequality from (A.1) provides
If :
Let us now use Rosenthal’s inequality (Proposition D.2) by introducing symmetric random variables such that
where are i.i.d. copies of . Then it comes for every
which implies
Then using for every that
it comes
Hence, it results for every
which concludes the proof.
A.2 Proof of Theorem 3.1
Our strategy of proof follows several ideas. The first one consists in using Proposition 3.1 which says that, for every ,
where by Eq. (2.7), and . The second idea consists in deriving upper bounds of
by repeated uses of Stone’s lemma, that is Lemma D.5 which upper bounds by the maximum number of s that can have a given among their nearest neighbors. Finally, for technical reasons we have to distinguish the case where we get tighter bounds, and .
A.2.1 Upper bounding
For the sake of readability let us now use the notation (see Theorem 2.1), and let denote the set where the -th coordinate has been removed. Then, is now upper bounded by
| (A.2) |
Furthermore, let us introduce for every ,
where and denote the indices of the nearest neighbors of respectively among and . Setting , one obtains
| (A.3) |
From now on, we distinguish between and because we will be able to derive a tighter bound for than for .
A.2.2 Case
Summing over and applying ( and ), it comes
hence
This leads for every to
which enables to conclude.
A.2.3 Case
It is possible to obtain a slightly better upper bound in the case with the following reasoning. With the same notation as above and from (A.3), one has
Lemma D.5 implies , which allows to conclude
Summing over and introducing an independent copy of denoted by , one derives
| (A.4) |
where the last but one inequality results from Lemma D.6.
A.3 Proof of Theorem 3.2
The idea is to plug the upper bounds previously derived for the L1O estimator, namely Ineq. (2.8) and (2.9) from Theorem 2.2, in the inequalities proved for the moments of the LO estimator in Theorem 2.2.
Proof of Ineq. (3.3), (3.4), and (3.5):
These inequalities straightforwardly result from the combination of Theorem 2.2 and Ineq. (2.8) and (2.9) from Theorem 3.1.
Proof of Ineq. (3.6):
It results from the upper bounds proved in Theorem 3.1 and plugged in Ineq. (• ‣ 2.2) (derived from Rosenthal’s inequality with optimized constant , namely Proposition D.3).
Then it comes
with
Finally introducing provides the result.
B Proofs of exponential concentration inequalities
B.1 Proof of Proposition 4.1
The proof relies on two successive ingredients: McDiarmid’s inequality (Theorem D.3), and Stone’s lemma (Lemma D.5).
First with and , let us start by upper bounding for every .
Using Eq. (2.5), one has
where denotes the set of random variables among having indices in , and (resp. ) denotes the set of indices of the nearest neighbors of among (resp. ).
B.2 Proof of Theorem 4.1
In this proof, we use the same notation as in that of Proposition 4.1.
The goal of the proof is to provide a refined version of previous Proposition 4.1 by taking into account the status of each as one of the nearest neighbors of a given (or not).
To do so, our strategy is to prove a sub-Gaussian concentration inequality by use of Lemma D.2, which requires the control of the even moments of the LO estimator .
Such upper bounds are derived
-
•
First, by using Ineq. (D.4) (generalized Efron-Stein inequality), which amounts to control the -th moments of the differences
-
•
Second, by precisely evaluating the contribution of each neighbor of a given , that is by computing quantities such as , where denotes the probability measure with respect to the uniform random variable over , and denotes the indices of the nearest neighbors of among .
B.2.1 Upper bounding
For every , one gets
Absolute values and Jensen’s inequality then provide
where the notation means the integration is carried out with respect to the random variable , which follows a discrete uniform distribution over the set of all distinct indices among .
Let us further notice that , where denotes the set of indices of the nearest neighbors of among with the notation of the proof of Proposition 4.1. Then it results
which leads to
Summing over the square of the above quantity, it results
B.2.2 Evaluating the influence of each neighbor
Further using that
let us now successively deal with each of these two terms.
Upper bound on
First, we start by partitioning the sum over depending on the rank of as a neighbor of in the whole sample . It comes
Then Lemma D.4 leads to
where the upper bound results from , for . It results
Upper bound on
Let us now apply the same idea to the second sum, partitioning the sum over depending on the rank of as a neighbor of in the whole sample. Then,
We then apply Stone’s lemma (Lemma D.5) to get
Gathering the upper bounds
The two previous bounds provide
which enables to conclude
B.2.3 Generalized Efron-Stein inequality
B.3 Proof of Theorem 4.2 and Proposition 4.2
B.3.1 Proof of Theorem 4.2
If :
In what follows, we exploit a characterization of sub-Gaussian random variables by their -th moments (Lemma D.2).
If :
This part of the proof relies on Proposition D.1 which provides an exponential concentration inequality from upper bounds on the moments of a random variable.
B.3.2 Proof of Proposition 4.2
As in the previous proof, the derivation of the deviation terms results from Proposition D.1.
C Proofs of deviation upper bounds
C.1 Proof of Ineq. (5.3) in Theorem 5.1
The proof follows the same strategy as that of Theorem 2.1 in [40].
Along the proof, we will repeatedly use some notation that we briefly introduce here. First, let us define and that are independent copies of . Second to ease the reading of the proof, we also use several shortcuts: , and for every set of indices (with cardinality ).
Finally along the proof, denote two random variables which are sets of distinct indices with discrete uniform distribution over . The notation (resp. ) means the integration is made with respect to the sample and also the random variable (resp. and also the random variables ). and are teh corresponding expectations. Note that the sample and the random variables are independent from each other, so that computing for instance amounts to integrating with respect to the random variable only.
C.1.1 Main part of the proof
With the notation , let us start from
let us notice that
and
It immediately comes
| (C.1) | |||
| (C.2) |
The proof then consists in successively upper bounding the two terms (C.1) and (C.2) of the last equality.
Upper bound of (C.1)
First, we have
Let us now introduce the five following events where we emphasize and are random variables with the discrete uniform distribution over :
Then,
Furthermore since
it comes
| (C.3) |
where
Upper bound for :
To upper bound , simply notice that:
Upper bound of (C.2)
First observe that
where is built on sample . One has
where we used Lemma D.6 again to obtain the last inequality.
Conclusion:
C.1.2 Combinatorial lemmas
All the lemmas of the present section are proved with the notation introduced at the beginning of Section C.1.
Lemma C.1.
For any ,
Proof of Lemma C.1.
Along the proof, we repeatedly exploit the independence of the random variables and , which are set of distinct indices with the discrete uniform distribution over .
Note also that an important ingredient is that the probability of each one of the following events does not depend on the particular choice of the indices , but only on the fact that .
∎
Lemma C.2.
With the above notation, for , it comes
Proof of Lemma C.2.
First remind that as a test sample element cannot belong to either or . Consequently, an exhaustive formulation of
Then it results
where is built on sample .
Hence Lemma D.6 implies
∎
Lemma C.3.
With the above notation, for , it comes
Proof of Lemma C.3.
As for the previous lemma, first notice that
where is built on sample with observation replaced with . Then
∎
C.2 Proof of Proposition 5.1
The bias of the L1O estimator is equal to
where denotes the -th neighbor of .
Then, a few remarks lead to simplify the above expression.
-
•
On the one hand it is easy to check that
since all of the nearest neighbors share the same label.
-
•
On the other hand, let us notice
Then knowing and are not equal implies the only way for and to differ is that the numbers of nearest neighbors of each label are almost equal, that is either equal to or to ( is odd by assumption).
With (respectively ) denoting the number of 1s among th nearest neighbors of among (resp. ), the proof of Theorem 3 in [17] leads to
where denotes a hypergeometric random variable with successes in a population of cardinality , and draws, and .
Following the same reasoning for and recalling that and by assumption, it results
-
•
Similar calculations applied to finally lead to
-
•
The conclusion then follows from considering which entails that , and also by noticing that
where denotes a numeric constant independent of and .
D Technical results
D.1 Main inequalities
D.1.1 From moment to exponential inequalities
Proposition D.1 (see also [2], Lemma 8.10).
Let denote a real valued random variable, and assume there exist , , and () such that for every ,
Then for every ,
| (D.1) |
Furthermore for every , it results
| (D.2) |
D.1.2 Sub-Gaussian random variables
Lemma D.1 (Theorem 2.1 in [11] first part).
Any centered random variable such that satisfies
for all in .
Lemma D.2 (Theorem 2.1 in [11] second part).
Any centered random variable such that
for some and in satisfies with .
D.1.3 The Efron-Stein inequality
Theorem D.1 (Efron-Stein’s inequality [11], Theorem 3.1).
Let be independent random variables and let be a square-integrable function. Then
Moreover if denote independent copies of and if we define for every
then
D.1.4 Generalized Efron-Stein’s inequality
Theorem D.2 (Theorem 15.5 in [11]).
Let independent random variables, a measurable function, and define and , with independent copies of . Furthermore let and . Then there exists a constant such that for all in ,
Corollary D.1.
With the same notation, it comes
| (D.3) |
Moreover considering for every , it results
| (D.4) |
D.1.5 McDiarmid’s inequality
Theorem D.3.
Let be independent random variables taking values in a set , and assume that satisfies
Then for all , one has
A proof can be found in [21] (see Theorem 9.2).
D.1.6 Rosenthal’s inequality
Proposition D.2 (Eq. (20) in [32]).
Let denote independent real random variables with symmetric distributions. Then for every and ,
where (), and denotes a positive constant only depending on and . Furthermore, the optimal value of is given by
where denotes a standard Gaussian variable, and are i.i.d. random variables with Poisson distribution .
Proposition D.3.
Let denote independent real random variables with symmetric distributions. Then for every ,
Proof of Proposition D.3.
From Lemma D.3, let us observe
-
•
if , choosing provides
-
•
if , leads to
Plugging the previous upper bounds in Rosenthal’s inequality (Proposition D.2), it results for every
∎
Lemma D.3.
With the same notation as Proposition D.2 and for every , it comes
-
•
for every ,
-
•
for every ,
D.2 Technical lemmas
D.2.1 Basic computations for resampling applied to the NN algorithm
Lemma D.4.
For every and , one has
| (D.5) | ||||
| (D.6) | ||||
| (D.7) |
Proof of Lemma D.4.
The first equality is straightforward. The second one results from simple calculations as follows.
For the last equality, let us notice every satisfies
hence
∎
D.2.2 Stone’s lemma
Lemma D.5 ([21], Corollary 11.1, p. 171).
Given points in , any of these points belongs to the nearest neighbors of at most of the other points, where increases on .
D.2.3 Stability of the NN classifier when removing observations
D.2.4 Exponential concentration inequality for the L1O estimator
D.2.5 Moment upper bounds for the L1O estimator
Lemma D.8.
D.2.6 Upper bound on the optimal constant in the Rosenthal’s inequality
Lemma D.9.
Let denote a real-valued standard Gaussian random variable. Then for every , one has
Proof of Lemma D.9.
If is even (), then
Then using for any positive integer
it results
which implies
If is odd (), then
by setting . In particular, this implies
∎
Lemma D.10.
Let denote a binomial random variable such that (). Then for every , it comes
Proof of Lemma D.10.
Since is symmetric, it comes
Using Chernoff’s inequality and setting , it results
If is even, then is odd and the same calculations as in the proof of Lemma D.9 apply, which leads to
If is odd, then is even and another use of the calculations in the proof of Lemma D.9 provides
Let us notice
and also that
This implies
hence
∎
Lemma D.11.
Let be two i.i.d. random variables with Poisson distribution (). Then for every , it comes
Proof of Lemma D.11.
Let us first remark that
where . Furthermore, the conditional distribution of given is a binomial distribution . Then Lemma D.10 provides that
which entails that
It only remains to upper bound the last expectation where is a Poisson random variable (since are i.i.d. ):
by Jensen’s inequality. Further introducing Touchard polynomials and using a classical upper bound, it comes
Finally, one concludes
∎