22institutetext: INAF – Istituto di Astrofisica Spaziale e Fisica Cosmica di Palermo, via U. La Malfa 153, I-90146, Palermo, Italy
A search for Galactic transients disguised as gamma–ray bursts
Abstract
Context. A significant fraction of cosmological gamma–ray bursts (GRBs) are characterised by a fast rise and exponential decay (FRED) temporal structure. This is not a distinctive feature of this class, since it is observed in many Galactic transients and is likely descriptive of a sudden release of energy followed by a diffusion process. Possible evidence has recently been reported by Tello et al. (2012) for a Galactic contamination in the sample of FRED GRBs discovered with Swift.
Aims. We searched for possible Galactic intruders disguised as FRED GRBs in the Swift catalogue up to September 2014.
Methods. We selected 181 FRED GRBs (2/3 with unknown redshift) and considered different subsamples. We tested the degree of isotropy through the dipole and the quadrupole moment distributions, both with reference to the Galaxy and in a coordinate-system—independent way, as well as with the two–point angular autocovariance function. In addition, we searched for possible indicators of a Galactic origin among the spectral and temporal properties of individual GRBs.
Results. We found marginal () evidence for an excess of FREDs with unknown redshift towards the Galactic plane compared with what is expected for an isotropic distribution corrected for the non-uniform sky exposure. However, when we account for the observational bias against optical follow-up observations of low-Galactic latitude GRBs, the evidence for anisotropy decreases to . In addition, we found no statistical evidence for different spectral or temporal properties from the bulk of cosmological GRBs.
Conclusions. We found marginal evidence for the presence of a disguised Galactic population among Swift GRBs with unknown redshift. The estimated fraction is %, with an upper limit of 34% (90% confidence).
Key Words.:
gamma-ray burst: general – methods: statistical1 Introduction
Gamma–ray bursts (GRBs) are known to be cosmological transient sources that signal the very final stage of some kind of massive stars for the long duration ones, and likely the act of merging for a compact binary system for short duration ones (see Mészáros & Gehrels 2012 for a review). Owing to their extreme luminosity they are routinely detected from cosmological distances up to redshifts (Cucchiara et al., 2011). The consequent highly isotropic sky distribution was interpreted as evidence for a cosmological origin prior to the first redshift measurements (Hartmann & Epstein, 1989; Hartmann & Blumenthal, 1989; Briggs et al., 1996). Once the cosmological nature of long-duration GRBs was finally established, a number of studies reported evidence for anisotropy in the distribution of short-duration ones (Balazs et al. 1998; Magliocchetti et al. 2003; Vavrek et al. 2008; but see also Bernui et al. 2008), or evidence for a correlation between short GRBs and galaxies in the local Universe (Tanvir et al., 2005).
Recently, Tello et al. (2012; hereafter T12) exploited the real-time arcmin-sized localisation capabilities of the Swift Burst Alert Telescope (BAT; Barthelmy et al. 2005) to test the isotropy of a special class of long GRBs, the so-called fast-rise exponential-decay (FRED) ones. Not only is their time profile quite common in GRBs (Norris et al., 1996), but it is also descriptive of various high-energy outbursts from Galactic sources, such as X–ray binaries (Remillard & McClintock, 2006), X–ray bursters (Lewin et al., 1993), magnetars (Mereghetti, 2008), as well as unidentified Galactic transients (Kasliwal et al., 2008; Castro-Tirado et al., 2008; Stefanescu et al., 2008). Such universality is observed across different wavelengths all the way to the radio bands, where analogous flares are observed over timescales from seconds or less, up to years, due to a broad range of astrophysical sources (Pietka et al., 2015). The ubiquity of FRED-like transient profiles is explained by its being descriptive of a sudden energy release, followed by some cooling and diffusion process. T12 found some evidence ( confidence) for a deviation from isotropy of the sky distribution of Swift FREDs with unknown . They attribute it to the presence of Galactic unidentified sources which would make up to % of the observed unknown- FRED population.
Motivated by their results, we carried out a similar investigation on an updated sample of Swift FRED catalogue, adopting independent selection criteria. We analysed the degree of isotropy both with reference to the Galactic plane and in a reference-system–independent way. In addition, to further characterise the nature of the Galactic candidates, we examined on a statistical basis the spectral and temporal properties of the –ray prompt and X–ray afterglow emission as observed with Swift BAT and X–ray Telescope (XRT; Burrows et al. 2005) and compared with a sample of cosmological GRBs. The paper is organised as follows: the sample selection and data analysis are described in Sections 2 and 3, respectively. Section 4 presents the results, which are discussed in Section 5.
2 Sample selection
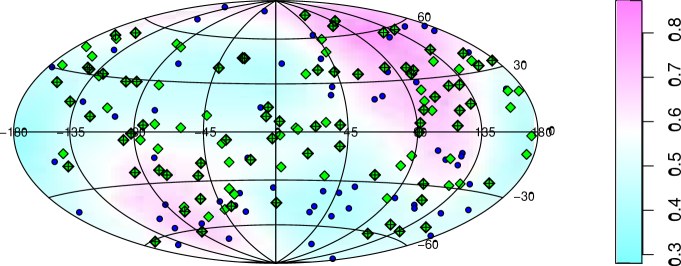
Starting from a sample of 904 GRBs detected by Swift-BAT in the time interval January 2005 to September 2014, we selected those which had explicitly been tagged by the BAT team as FREDs in the GCN circulars. We ended up with 181 FREDs out of 904 GRBs, whereas T12 found 111 FREDs out of 596 GRBs. We further characterised the number of peaks of each GRB by means of the MEPSA code (Guidorzi, 2015), capable of identifying relatively faint peaks at very different timescales. We set a threshold of on the minimum signal–to–noise as yielded by MEPSA, which ensures a negligible false positive rate for our light curve sample. We then considered three different samples: i) the full one; ii) the subsample of GRBs with unknown redshift ; iii) the subsample of GRBs with unknown and with a single peak detected with MEPSA. Hereafter these samples are referred to as S1, S2, and S3, including 181, 119, and 71 GRBs, respectively. Their sky distributions in Galactic coordinates are shown in Fig. 1.
To assess the role of observational biases, for comparison we also consider two additional samples detected in the same time interval: (i) all 904 BAT-discovered GRBs, and (ii) the complementary sample of 506 non–FREDs GRBs with unknown . Hereafter, we refer to them as STot and SnFnZ, respectively. Table 1 summarises the samples’ sizes and the corresponding values of T12.
| Sample | Description | Size | Size |
|---|---|---|---|
| (this work) | (T12) | ||
| S1 | all FREDs | 181 | 111 |
| S2 | all FREDs, no | 119 | 77 |
| S3 | all FREDs, no , 1 peak | 71 | 49 |
| STot | all GRBs | 904 | - |
| SnFnZ | all non-FREDs, no | 506 | - |
3 Data analysis
For each real sample we calculated the three Galactic dipole moments (, , ), and the five quadrupole moments (, , , , ) with an emphasis on the ones related to the Galactic plane, i.e. and . We also calculated the somewhat redundant equatorial dipole and quadrupole moments to better evaluate possible anisotropies connected with observational biases. In addition, we calculated the two–point angular correlation function (Hartmann & Blumenthal, 1989). We also carried out a reference-system–independent search for anisotropies possibly unrelated with our Galaxy by evaluating the Rayleigh–Watson and the Bingham statistics (Briggs, 1993). Everything was then compared with the expectations for isotropy following two independent approaches: through Monte Carlo simulations and sky pixelisation.
The exposure map of Swift-BAT (Fig. 1) was obtained from the limiting flux map for the considered time interval, processing the BAT data with the Bat_Imager software (Segreto et al., 2010), and following the procedure described in Cusumano et al. (2010).
3.1 Monte Carlo simulations (method 1)
For each sample we generated synthetic samples, each having as many positions as the corresponding real one. Each fake position was generated according to the following procedure: i) a random position is drawn from an isotropic distribution; ii) the position is accepted/rejected depending on the outcome of a binomial variate, whose acceptance probability was set to the fractional exposure of that position. The procedure ends as soon as the desired number of positions is achieved.
3.2 Sky pixelisation (method 2)
The entire sky was split into a homogeneous grid of 5292 pixels following the technique described by Tegmark (1996), with angular resolution of . Each pixel was then assigned the corresponding fractional exposure value. The choice of the angular resolution was driven by the need to ensure an adequate coverage of the BAT exposure map. The expected moments were calculated over the entire sky grid by weighting the contribution of each sky pixel by the associated fractional exposure. The uncertainties affecting the observed moments were calculated from the expected variances in the Gaussian limit ensured by the central limit theorem due to events: , for the term, for the other quadrupole terms (Briggs, 1993).
| Sample | Moment | Observed | Expected(a)𝑎(a)(a)𝑎(a)footnotemark: | Discrepancy | Expected Interval (MC)(b)𝑏(b)(b)𝑏(b)footnotemark: | |
|---|---|---|---|---|---|---|
| (sky pix.; ) | () | () | () | |||
| S1 | ||||||
| S1 | ||||||
| S1 | ||||||
| S1 | ||||||
| S1 | ||||||
| S2 | ||||||
| S2 | ||||||
| S2 | ||||||
| S2 | ||||||
| S2 | ||||||
| S2(c)𝑐(c)(c)𝑐(c)footnotemark: | ||||||
| S2(c)𝑐(c)(c)𝑐(c)footnotemark: | ||||||
| S2(c)𝑐(c)(c)𝑐(c)footnotemark: | ||||||
| S2(c)𝑐(c)(c)𝑐(c)footnotemark: | ||||||
| S2(c)𝑐(c)(c)𝑐(c)footnotemark: | ||||||
| S3 | ||||||
| S3 | ||||||
| S3 | ||||||
| S3 | ||||||
| S3 | ||||||
| SnFnZ | ||||||
| SnFnZ | ||||||
| SnFnZ | ||||||
| SnFnZ | ||||||
| SnFnZ | ||||||
| STot | ||||||
| STot | ||||||
| STot | ||||||
| STot | ||||||
| STot | ||||||
4 Results
4.1 Dipole and quadrupole moments
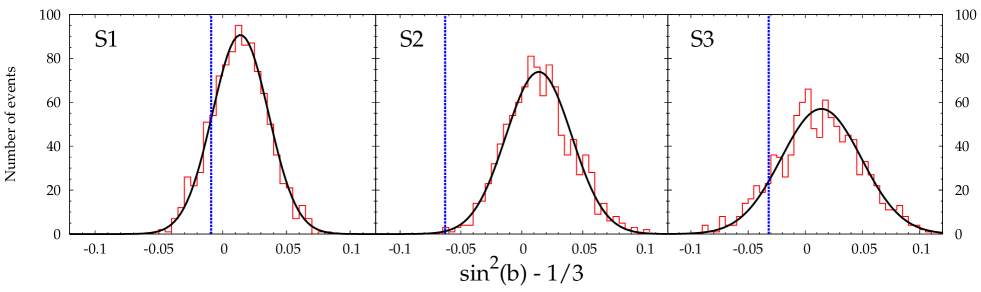
Table 2 reports the observed moments along with the expected values and intervals. While none of the dipole moments deviate by from isotropy, the Galactic quadrupole moment of S2 is marginally () lower than the isotropic–expected one. Analogous result is obtained for SnFnZ with a less significant deviation though (). This suggests that the unknown- FREDs tend to cluster at low Galactic latitudes, or equivalently, that they are rarely found at high latitudes. Among the other Galactic quadrupole moments, only exhibits two deviations from isotropy, () for S1 (S2). Figure 2 shows the Galactic quadrupole moment for each of the three samples obtained with both methods assuming isotropy, corrected for the non-uniform exposure map, to be compared with the value observed in the corresponding real sample.
4.2 and statistics
Following Briggs (1993), for each position we considered the associated unit vector and calculated the Rayleigh-Watson statistic defined as
| (1) |
This statistic characterises the dipole moment and in the absence of any preferred direction is asymptotically distributed as for large . The Bingham statistic is defined as
| (2) |
where are the eigenvalues of the so-called “orientation” matrix, that is equivalent to the quadrupole one and is defined as
| (3) |
measures the deviation of the eigenvalues from the value expected for isotropy and is asymptotically distributed as . Because of the non-uniform sky exposure we applied just method 1 to derive the expected intervals for both statistics. Table 3 reports the observed values and the corresponding intervals for isotropy. Like for the Galactic moments we did not find evidence for any preferred direction with a non-zero dipole moment, all within confidence. As for the quadrupole term, although all of them lie within , S2 shows the largest deviation. In particular, it mildly suggests a clustering of unknown- FREDs along the Galactic direction , (, , J2000) and its antipodal one, i.e. close to celestial poles. From Table 2 the equatorial quadrupole moment exceeds by the expected isotropic value only for S2, thus lending support to the enhanced presence of unknown- FREDs towards the celestial poles.
| Sample | Statistics | Observed | Expected Interval (MC)a𝑎aa𝑎aEstimated through the sky pixelisation (method 2) in the Gaussian limit ensured by the central limit theorem. | ||||
| () | () | ||||||
| S1 | |||||||
| S2 | |||||||
| S3 | |||||||
| S1 | |||||||
| S2 | |||||||
| S3 | |||||||
The unknown- non-FREDs GRBs (SnFnZ) show a similar behaviour: their Galactic quadrupole moment deviates by from isotropy. In contrast, in spite of the best statistical sensitivity the whole BAT–detected sample (STot) shows no evidence at all for non-zero quadrupole moments.
4.3 Two-point angular autocovariance
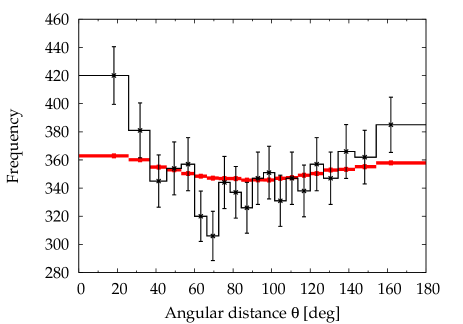
Finally, we calculated the distribution of the two-point angular autocovariance function by taking all the pairs within a given sample. In particular, we considered rather than (angular distance between a pair), given that for isotropy and uniform exposure the expected distribution is uniform in . Likewise, the expected distribution for isotropy was derived only through method 1 to account for the non-uniform exposure map. The most remarkable deviations are observed for S2, as shown in Fig. 3.
The thick line shows the isotropic-expected value as a function of the angular distance. The displayed uncertainties on the observed numbers are their square root values, under the assumption of Poisson statistics. Strictly speaking, this is not correct: the ensemble of values are not fully independent of each other, since the entire set of possible pairs is not. However, given the large number of pairs the degree of correlation is relatively small, so as a matter of fact Poissonian uncertainties are realistic.
Unknown- FREDs seem to cluster on angular scales (between and significance) at the expense of those in the range –. A test yields a p–value of 15% (). However, this must be taken as a loose indication, for the lack of statistical independence of the different bins.
4.4 Observational biases connected with redshift measurement
In the light of the previous results, we tried to account for the observational biases involved in measuring that come into play when one considers the samples of unknown- GRBs with some evidence for anisotropy, S2 and SnFnZ. To this aim, using method 1 we generated another set of 1000 synthetic samples with the same size as S2, which took into account two main sources of bias:
-
•
Galactic dust extinction disfavours optical observations of low–Galactic-latitude GRBs;
-
•
ground-based follow-up observations are less probable around the celestial poles (Fynbo et al., 2009).
To model the first bias, we considered the Galactic extinction as measured by Schlafly & Finkbeiner (2011) in terms of .333Available at http://irsa.ipac.caltech.edu/applications/DUST/ We then obtained the distribution for the positions of all the GRBs belonging to STot and split it into two groups, with and without measured respectively. For each bin we calculated the fraction of GRBs with unknown over the total. The result is shown in Fig. 4.

As long as it is mag the fraction is about , i.e. the same value that is obtained over the entire Swift catalogue. However, for mag almost all of the GRBs have no redshift. In generating the synthetic samples analogous to S2, each random position was accepted depending on the outcome of a binomial variate: the acceptance probability was set to 1 if mag, to otherwise.
To model the effect of the second bias, we preliminarily compiled a list of the ground facilities that mostly contributed to measuring GRB redshifts. For each declination, we considered the visibility from each location by calculating the fraction of time that a generic source at the given declination spends at above the local horizon. Such threshold value matches average observational constraints. We then averaged it over the full set of locations, weighting by the multiplicity of the number of telescopes at a given location (e.g., in La Palma there are several telescopes which provided GRB redshift measurements). We have therefore come up with a probability of having measured as a function of declination. This bias was incorporated in the MC simulations as a further criterion for a random position to be accepted, depending on the outcome of a binomial variate: the acceptance probability was set to the complement to one of the probability of having measured for that declination.
We also applied method 2 by weighting each sky pixel by the product of the sky exposure and the two above probabilities. We then calculated the mean value for each moment and the corresponding uncertainties as in Section 3.2 under the same assumptions. The results are reported in Table 2. Both methods gave fully consistent results as was the case for the other samples.
It is noteworthy that the deviation from isotropy of the Galactic quadrupole moment tapers off from to when observational biases are accounted for. Likewise, the equatorial quadrupole moment decreases from to .
We also considered the Galactic dust correction alone and found that it accounts for 90% of the total change in the expected Galactic quadrupole moment, so it dominates over the correction for the locations of ground telescopes.
4.5 Constraining the fraction of a possible Galactic population
The Galactic quadrupole moment of unknown- events is marginally deviating from isotropy: this holds both for the FREDs (S2) and, to somewhat lower extent for the non-FREDs (SnFnZ). This would imply an excess of events at low Galactic latitudes. Taken at face value, when one overlooks the impact of the observational biases discussed in Section 4.4 and plainly assumes that this is mostly due to the presence of a Galactic population as T12 did, one can estimate its fraction within the sample of unknown- FREDs.
We did so by generating 100 synthetic samples with as many events as in S2, a fraction of which was obtained from an isotropic distribution, and the remaining one from a random selection of a sample of 334 known Galactic sources from the BAT catalogue by Cusumano et al. (2010).444We made use of known sources just to mimic in a credible way what the distribution of a Galactic population should look like. Clearly, such possible unrecognised Galactic sources must obviously be different from the known ones. Both populations were selected compatibly with the exposure map.
By varying every time the fraction of the Galactic component, we ended up with the best match between observations and simulations. This turned into an estimated fraction of Galactic intruders in S2 of % (), similar to T12’s conclusions. In practice, given that the evidence for anisotropy is only marginal, we provided a 90%-confidence upper limit of % by demanding that at least % of the synthetic samples had a non-zero quadrupole moment at .
However, neglecting the observational biases has the effect of overestimating the weight of the possible Galactic population. We therefore repeated the same test by accounting for those biases. Following the procedure of Section 4.4 we came up with a more realistic estimate of % with a % upper limit of %.
5 Discussion
We found no evidence for a significant dipole moment in the different FRED samples observed by Swift. However, we point out that this does not clash with T12’s claim: in contrast with what they assert, is by no means a dipole, since a dipole moment is the cosine of the angle between a generic direction and a fixed one in the sky, not a plane. Thus, the tension is just in the claim but not in the results, which do agree. In particular, significant dipole moment was found neither along the Galactic poles (), nor towards the Galactic centre ().
In contrast, and in agreement with T12, we found that the Galactic quadrupole moment of unknown- events marginally deviates from isotropy, implying an excess of events at low Galactic latitudes.
However, before giving credence to the possible existence of such a relatively abundant disguised Galactic community, one must carefully evaluate the impact of observational biases other than the non-uniform exposure map. That not just FREDs, but all GRBs with unknown tend to cluster towards the Galactic plane, likely suggests that the impact of the process of measuring might be far from negligible. This possibility appears to be corroborated by the absence of non-zero quadrupole moments in the entire sample of BAT events (STot), in spite of its having the best statistical sensitivity. Low-Galactic–latitude GRBs are notoriously disfavoured in their optical counterpart detection and consequent measurement because of the strong Galactic dust extinction. Moreover, our result that unknown- events tend to cluster around the celestial poles (), where ground-based follow-up observations are less probable (Fynbo et al., 2009), lends further support to the -related observational bias explanation. In the light of these considerations, we modelled the impact of both effects in shaping the unknown- sample S2 by preliminarily studying how the measurement of is hampered by the amount of Galactic dust content for the entire sample of Swift GRBs. Furthermore, we modelled the probability for a generic source at a given declination to be followed up spectroscopically by estimating its visibility from the most frequently used ground facilities. As a result, we found that the deviation from isotropy of the Galactic quadrupole moment decreased from to , thus deflating the body of evidence of a significant contamination due to a disguised population of Galactic transients.
We delved deeper into such matter by estimating the contaminating fraction of a Galactic population that would yield the same Galactic quadrupole moment as the one observed in the sample of unknown- FREDs. When the observational biases are properly accounted for, we estimate % (1) with a % upper limit of %.
To gain further insight, we examined the spectral and temporal properties of the –ray prompt emission along with the X–ray afterglow of the S2 sample as a function of the Galactic position and compared their distributions with those derived for a sample of cosmological GRBs with measured . Specifically, we estimated the rise and the decay times of the –ray profiles as well as the photon index in the 15–150 keV range of the spectrum extracted over the interval. The X–ray afterglow properties were taken from the classifications provided by Swift-XRT catalogues (Evans et al., 2009; Margutti et al., 2013) and from the online Leicester catalogue555http://www.swift.ac.uk/ for the recent GRBs. For none of these observables we found evidence for a different distribution between S2 and cosmological GRBs.
Noteworthy is that the fraction of short-duration GRBs in S2 is less than 7% (8/119), i.e. far from enough to account for the deviation from isotropy that we observe. Several investigations on past short and very short GRB catalogues brought evidence for anisotropy (Balazs et al., 1998; Magliocchetti et al., 2003; Vavrek et al., 2008; Cline et al., 2003, 2005). However, the low fraction of short GRBs in our Swift samples rules them out as the main cause for the marginally observed anisotropy.
6 Conclusions
Triggered by previous results, we searched for the possible presence of disguised Galactic transients in the catalogue of GRBs detected by Swift-BAT up to September 2014. We focused on FRED GRBs, given that their light curves are often observed in a broad range of Galactic high-energy transients. The search was based on the statistical analysis of the sky distribution both with reference to our Galaxy and in a reference-system–independent way. While no deviation from isotropy was found in the dipole moment, we found marginal () evidence for a non-zero Galactic quadrupole moment for FREDs with unknown redshift , suggesting a clustering at low Galactic latitudes, in particular towards the celestial poles (). Should this possible clustering on the Galactic plane be due the presence of an unidentified Galactic population, we constrain its fraction to %.
However, non-FRED GRBs with unknown also show a similar behaviour, even though with lower statistical significance (). If one drops the unknown- condition, such evidence disappears. It is known that there are observational biases that disfavour the measurement of : the large dust extinction towards the Galactic plane along with the lower probability of ground-based observations of polar () events, can contribute to enhance the degree of anisotropy. Once such biases are accounted for, the evidence for a clustering near the Galactic plane decreases from to , thus weakening the claim for a Galactic contamination. Furthermore, comparing the properties of the –ray prompt emission as well as of the X–ray afterglow with those of GRBs with measured did not reveal any statistical difference. Hence, our results suggest marginal evidence for the presence of an unrecognised Galactic population among the GRBs with unknown redshift.
In conclusion, when -measurement–related biases are accounted for, the fraction of a possible disguised Galactic population of high-energy transients among Swift-BAT GRBs with unknown redshift is estimated %, with a 90%-confidence upper limit of %.
Acknowledgements.
We are grateful to the referee for comments which improved the paper. We thank G. Cusumano, S. Dichiara, F. Frontera, C. Koen, P. Rosati, for useful discussions. PRIN MIUR project on “Gamma Ray Bursts: from progenitors to physics of the prompt emission process”, P. I. F. Frontera (Prot. 2009 ERC3HT) is acknowledged. This work made use of data supplied by the UK Swift Science Data Centre at the University of Leicester.References
- Balazs et al. (1998) Balazs, L. G., Meszaros, A., & Horvath, I. 1998, A&A, 339, 1
- Barthelmy et al. (2005) Barthelmy, S. D., Barbier, L. M., Cummings, J. R., et al. 2005, Space Sci. Rev., 120, 143
- Bernui et al. (2008) Bernui, A., Ferreira, I. S., & Wuensche, C. A. 2008, ApJ, 673, 968
- Briggs (1993) Briggs, M. S. 1993, ApJ, 407, 126
- Briggs et al. (1996) Briggs, M. S., Paciesas, W. S., Pendleton, G. N., et al. 1996, ApJ, 459, 40
- Burrows et al. (2005) Burrows, D. N., Hill, J. E., Nousek, J. A., et al. 2005, Space Sci. Rev., 120, 165
- Castro-Tirado et al. (2008) Castro-Tirado, A. J., de Ugarte Postigo, A., Gorosabel, J., et al. 2008, Nature, 455, 506
- Cline et al. (2005) Cline, D. B., Czerny, B., Matthey, C., Janiuk, A., & Otwinowski, S. 2005, ApJ, 633, L73
- Cline et al. (2003) Cline, D. B., Matthey, C., & Otwinowski, S. 2003, Astroparticle Physics, 18, 531
- Cucchiara et al. (2011) Cucchiara, A., Levan, A. J., Fox, D. B., et al. 2011, ApJ, 736, 7
- Cusumano et al. (2010) Cusumano, G., La Parola, V., Segreto, A., et al. 2010, A&A, 524, A64
- Evans et al. (2009) Evans, P. A., Beardmore, A. P., Page, K. L., et al. 2009, MNRAS, 397, 1177
- Fynbo et al. (2009) Fynbo, J. P. U., Jakobsson, P., Prochaska, J. X., et al. 2009, ApJS, 185, 526
- Guidorzi (2015) Guidorzi, C. 2015, Astronomy and Computing, 10, 54
- Hartmann & Blumenthal (1989) Hartmann, D. & Blumenthal, G. R. 1989, ApJ, 342, 521
- Hartmann & Epstein (1989) Hartmann, D. & Epstein, R. I. 1989, ApJ, 346, 960
- Kasliwal et al. (2008) Kasliwal, M. M., Cenko, S. B., Kulkarni, S. R., et al. 2008, ApJ, 678, 1127
- Lewin et al. (1993) Lewin, W. H. G., van Paradijs, J., & Taam, R. E. 1993, SSRv, 62, 223
- Magliocchetti et al. (2003) Magliocchetti, M., Ghirlanda, G., & Celotti, A. 2003, MNRAS, 343, 255
- Margutti et al. (2013) Margutti, R., Zaninoni, E., Bernardini, M. G., et al. 2013, MNRAS, 428, 729
- Mereghetti (2008) Mereghetti, S. 2008, A&ARv, 15, 225
- Mészáros & Gehrels (2012) Mészáros, P. & Gehrels, N. 2012, Research in Astronomy and Astrophysics, 12, 1139
- Norris et al. (1996) Norris, J. P., Nemiroff, R. J., Bonnell, J. T., et al. 1996, ApJ, 459, 393
- Pietka et al. (2015) Pietka, M., Fender, R. P., & Keane, E. F. 2015, MNRAS, 446, 3687
- Remillard & McClintock (2006) Remillard, R. A. & McClintock, J. E. 2006, ARAA, 44, 49
- Schlafly & Finkbeiner (2011) Schlafly, E. F. & Finkbeiner, D. P. 2011, ApJ, 737, 103
- Segreto et al. (2010) Segreto, A., Cusumano, G., Ferrigno, C., et al. 2010, A&A, 510, A47
- Stefanescu et al. (2008) Stefanescu, A., Kanbach, G., Słowikowska, A., et al. 2008, Nature, 455, 503
- Tanvir et al. (2005) Tanvir, N. R., Chapman, R., Levan, A. J., & Priddey, R. S. 2005, Nature, 438, 991
- Tegmark (1996) Tegmark, M. 1996, ApJ, 470, L81
- Tello et al. (2012) Tello, J. C., Castro-Tirado, A. J., Gorosabel, J., et al. 2012, A&A, 548, L7
- Vavrek et al. (2008) Vavrek, R., Balázs, L. G., Mészáros, A., Horváth, I., & Bagoly, Z. 2008, MNRAS, 391, 1741