Teaching critical thinking
Abstract
The ability to make decisions based on data, with its inherent uncertainties and variability, is a complex and vital skill in the modern world. The need for such quantitative critical thinking occurs in many different contexts, and while it is an important goal of education, that goal is seldom being achieved. We argue that the key element for developing this ability is repeated practice in making decisions based on data, with feedback on those decisions. We demonstrate a structure for providing suitable practice that can be applied in any instructional setting that involves the acquisition of data and relating that data to scientific models. This study reports the results of applying that structure in an introductory physics lab course. Students in an experimental condition were repeatedly instructed to make and act on quantitative comparisons between datasets, and between data and models, an approach that is common to all science disciplines. These instructions were slowly faded across the course. After the instructions had been removed, students in the experimental condition were 12 times more likely to spontaneously propose or make changes to improve their experimental methods than a control group, who performed traditional experimental activities. They were also four times more likely to identify and explain a limitation of a physical model using their data. Students in the experimental condition also showed much more sophisticated reasoning about their data. These differences between the groups were seen to persist into a subsequent course taken the following year.
Significance Statement: Understanding and thinking critically about scientific evidence is a crucial skill in the modern world. We present a simple learning framework that employs cycles of decisions about making and acting on quantitative comparisons between datasets or data and models. With opportunities to improve the data or models, this structure is appropriate for use in any data-driven science learning setting. This structure led to significant and sustained improvement in students’ critical thinking behaviours, compared to a control group, with effects far beyond that of statistical significance.
Keywords: critical thinking — scientific reasoning — scientific teaching — teaching experimentation — undergraduate education
A central goal of science education is to teach students to think critically about scientific data and models. It is crucial for scientists, engineers, and citizens in all walks of life to be able to critique data, to identify whether or not conclusions are supported by evidence, and to distinguish a significant effect from random noise and variability. There are many indications of how difficult it is for people to master this type of thinking as evidenced by many societal debates. Although teaching quantitative critical thinking is a fundamental goal of science education, particularly the laboratory portion, the evidence indicates this is seldom, if ever, being achieved KanariMillar ; Kumassah ; KungLinder ; RyderLeach ; RyderRight ; Sere1993 . To address this educational need, we have analyzed the explicit cognitive processes involved in such critical thinking and then developed an instructional design to incorporate these processes.
We argue that scientists engage in such critical thinking through a process of repeated comparisons and decisions: comparing new data to existing data and/or models, and then deciding how to act on those comparisons based on analysis tools that embody appropriate statistical tests. Those actions typically lead to further iterations involving improving the data and/or modifying the experiment or model. In a research setting, common decisions are to improve the quality of measurements (in terms of accuracy or precision) to determine whether an effect is hidden by large variability, to embrace, adjust or discard a model based on the scientific evidence, or to devise a new experiment to answer the question. In other settings, such as medical policy decisions, there may be fewer options but corresponding decisions are made as to the consistency of the model and the data and what conclusions are justified by the data.
We hypothesize that much of the reason students do not engage in these behaviours is because the educational environment provides few opportunities for this process. Students ought to be explicitly exposed to how experts engage in critical thinking in each specific discipline, which should, in turn, expose them to the nature of knowledge in that discipline Baron1993 . Demonstrating the critical thinking process, of course, is insufficient for students to use it on their own. Students need practice engaging in the critical thinking process themselves, and this practice should be deliberate and repeated with targeted feedback Baron1993 ; DeliberatePractice ; Kuhn2008 . We do not expect first year university students to engage in expert-level thinking processes. We can train them to think more like scientists by simplifying the expert decision tree described above. Making it explicit to students, demonstrating how it allows them to learn or make discoveries, and having them practice in a deliberate way with targeted feedback, will help students understand the nature of scientific measurement and data uncertainty, and, in time, adopt the new ways of thinking.
The decision tree and iterative process we have described could be provided in any setting in which data and models are introduced to students. Virtually all instructional labs in science offer such opportunities as students collect data and use it to explore various models and systems. Such labs are an ideal environment for developing students’ critical thinking and this is arguably their greatest value beyond simply skills-training.
We have tested this instructional concept in the context of a calculus-based introductory laboratory course in physics at a research-intensive university. The students repeatedly and explicitly make decisions and act on comparisons between data sets or between data and models as they work through a series of simple, introductory physics experiments. Although this study is in the context of a physics course, we believe the effect would be similar using experiments from any subject that involve quantitative data, opportunities to quantitatively compare data and models, and opportunities to improve data and models. With this simple intervention, we observed dramatic long-term improvements in students’ quantitative critical thinking behaviours when compared with a control group that carried out the same lab experiments, but with a structure more typical of instructional labs.
In our study, students in the experiment condition were explicitly instructed to (and received grades to) quantitatively compare multiple collected data sets or a collected data set and a model, and to decide how to act on the comparisons (figure 1). While a variety of options for acting on comparisons, as listed above, were presented to students, striving to improve the quality of their data was the most rigorously enforced. For example, in one of the earliest experiments, students were told to make two sets of measurements and compare them quantitatively. They were then prompted to devise a plan to improve the quality of their measurements, to discuss this plan with other groups, and to carry out the revised measurements and analysis. This explicit focus on measurements, rather than improving models, was intended to address the fact that students in a lab course often assume data they collect is inherently low quality compared to expert results Allie1998 . This can lead them to ignore disagreements between measurements or to artificially inflate uncertainties to disguise them PERC . When disagreements do arise, students often attribute them to what they refer to as ‘human error’ Sere2001 or simply blame the equipment being used. As such, students are unlikely to adjust or discard an authoritative model, since they do not trust that their data is sufficiently high quality to make such a claim. We hypothesize that the focus on high-quality data will, over time, encourage students to critique models without explicit support.
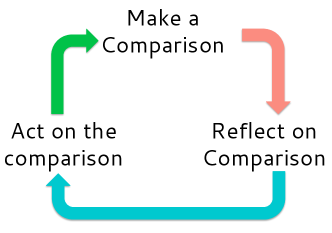
To compare measurements quantitatively, students were taught a number of analysis tools used regularly by scientists in any field. Students were also taught a framework for how to use these tools to make decisions about how to act on the comparisons. For example, they were shown weighted calculations for least squares fitting of data to models and then were given a decision tree for interpreting the outcome. If they obtain a low they would decide whether it means their data is in good agreement with the model or whether it means they have overestimated their uncertainties. If they obtain a large they would decide whether there is an issue with the model or with the data. From these interpretations, the decision tree expands into deciding what to do. In both cases, students were encouraged to improve their data: to improve precision and decrease their uncertainties in the case of low , or to identify measurement or systematic errors in the case of a large . While they were told that a large might reflect an issue with the model, they were not told what to do about it, leaving room for autonomous decision making. Regardless of the outcome of the comparison, therefore, students had guidelines for how to act on the comparison, typically leading to additional measurements. This naturally led to iterative cycles of making and acting on comparisons, which could be used for any type of comparison.
Before working with fitting and models, students were first introduced to an index for comparing pairs of measured values with uncertainty (the ratio of the difference between two measured values to the uncertainty in the difference, see S1.1 for more details). Students were also taught to plot residuals (the point-by-point difference between measured data and a model) to visualize the comparison of data and models. Both of these tools, and any comparison tool that includes the variability in a measurement, lend themselves to the same decision process as the value when identifying disagreements with models or improving data quality. A number of standard procedural tools for determining uncertainty in measurements or fit parameters were also taught (see S1.1 for the full list). As more tools were introduced during the course, the explicit instructions to make or act on the comparisons were faded (see S1.2 for more details and for a week-by-week diagram of the fading).
The students carried out different experiments each week and completed the analysis within the three-hour lab period. To evaluate the impact of the comparison cycles, we assessed students’ written lab work from three lab sessions (see S1.3 for a description of the experiments) from the course: one early in the course when the experimental group had explicit instructions to perform comparison cycles to improve data (week 2), and two when all instruction about making and acting on comparisons had been stopped (weeks 16 and 17). We also examined student work from a quite different lab course taken by the same students in the following year. About a third of the students from the first-year lab course progressed into the second year (sophomore) physics lab course. This course had different instructors, experiments, and structure. Students carried out a smaller number of more complex experiments, each one completed over two weeks, with final reports then submitted electronically. We analyzed the student work on the third experiment in this course.
Results
Students’ written work was evaluated for evidence of acting on comparisons, either suggesting or executing changes to measurement procedures, or critiquing or modifying physical models in light of collected data. We also examined students’ reasoning about data to further inform the results (see S1.4 for inter-rater reliability of the coding process for these three measures). Student performance in the experimental group () was compared with a control group (). The control was a group of students who had taken the course the previous year with the same set of experiments. Analysis in the supplementary material demonstrates that the groups were equivalent in performance on conceptual physics diagnostic tests (S1.5). Although both groups were taught similar data analysis methods (such as weighted fitting), the control group was neither instructed nor graded on making or acting on cycles of quantitative comparisons. They also were not introduced to plotting residuals or comparing differences of pairs of measurements as a ratio of the combined uncertainty. However, instructions given to the experimental group were faded over time, so the instructions given to both groups were identical in week 16 and week 17.
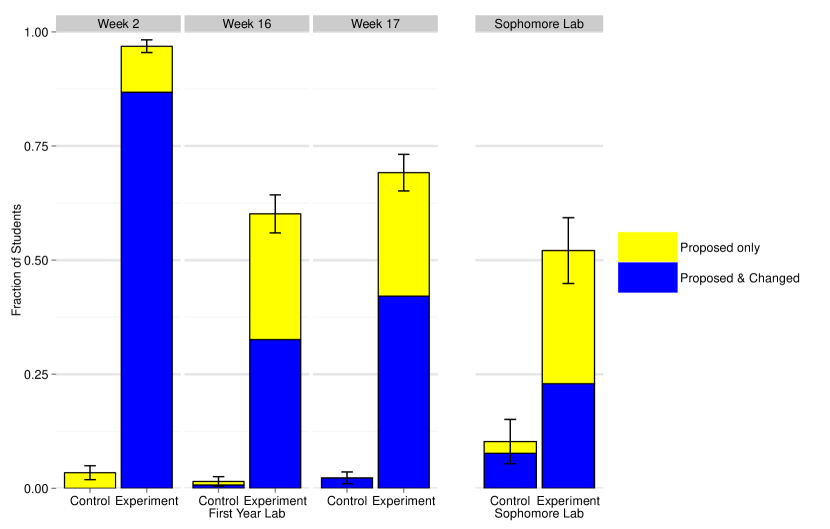
We first compiled all instances where students decided to act on comparisons by proposing and/or making changes to their methods (figure 2), since this was the most explicitly structured behaviour for the experimental group. When students in the experimental group were instructed to iterate and improve their measurements (week 2), nearly all students proposed or carried out such changes. By the end of the course, when the instructions had been removed, over half of the experimental group continued to make or propose changes to their data or methods. This fraction was similar for the sophomore lab experiment, where it was evident that they were making changes, even though we were evaluating final reports rather than laboratory notebooks. Almost none of the control group did at any time.
Next, we looked for instances where students decided to act on a comparison by critiquing the validity of a given physical model (figure 3). For both groups of students, many experiments asked them to verify the validity of a physical model. Neither group, however, received explicit prompts to identify or explain a disagreement with the model. Three experiments (week 2, week 17, and the sophomore lab) were included in this portion of the analysis, since these experiments involved physical models that were limited or insufficient for the quality of data achievable (see S1.3). In all three experiments, students’ written work was coded for whether they identified a disagreement between their data and the model and whether they correctly interpreted the disagreement in terms of the limitations of the model.
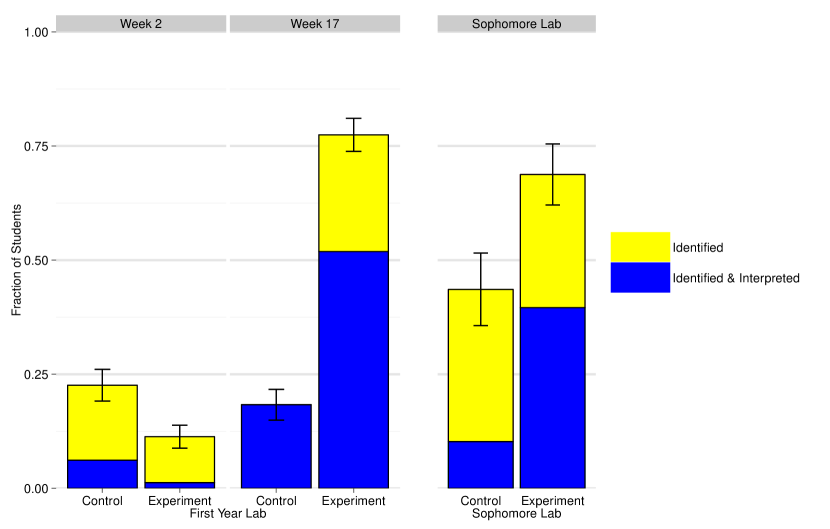
As shown in figure 3, few students in either group noted a disagreement in week 2. As previously observed, learners tend to defer to authoritative information Baron1993 ; Allie1998 ; PERC . In fact, many students in the experimental group stated that they wanted to improve their data to get better agreement, ignoring the possibility that there could be something wrong with the model.
As they progress in the course, however, dramatic changes emerge. In week 17, over 3/4 of the students in the experimental group identified the disagreement, nearly four times more than in the control group, and over half of the experimental group provided the correct physical interpretation. Students in the experimental group showed similar performance in the sophomore lab, indicating that the quantitative critical thinking was carried forward. The lab instructions for the sophomore experiment provided students with a hint that a technical modification to the model equation may be necessary if the fit was unsatisfactory, and prompted them to explain why it might be necessary. This is probably why a larger percentage of students in the control group identified the disagreement in this experiment than in the week 2 and 17 experiments. However, only 10% of the students in the control group provided the physical interpretation, compared to 40% in the experiment group.
The more sophisticated analysis of models depends on the repeated attempts to improve the quality of the measurements. Students obtain both better data and greater confidence in the quality of their data, giving them the confidence to question an authoritative model. This is evident when we examine how students were reasoning about their data.
We coded students’ reasoning into four levels of sophistication, somewhat analogous to Bloom’s Taxonomy Bloom , with the highest level reached by a student in a given experiment being recorded. Level 1 comments reflect the simple application of analysis tools or comparisons without interpretation; level 2 comments analyze or interpret results; level 3 comments combine multiple ideas or propose something new; and level 4 comments evaluate or defend the new idea (see S1.6 for additional comments and figures S2 and S3 for examples of this coding).
In figure 4, we see only a moderate difference between the experimental and control groups in week 2, even though the experimental group received significant behavioural support in week 2. This suggests that the support alone is insufficient to create significant behavioural change. By week 16, there is a larger difference between the groups, with the control group shifting to lower levels of comment sophistication and the experimental group maintaining higher levels of comment sophistication, despite the removal of the behavioural support. In week 17, when the model under investigation is inadequate to explain high-quality data, the difference between the groups becomes much more dramatic. For the experimental group, the unexpected disagreement triggers productive, deep analysis of the comparison beyond the level the previous week PERC2 ; ProductiveFailure ; VanLehn1988 . We attribute this primarily to attempts to correct or interpret the disagreement. In contrast, most of the students in the control group are reduced to simply writing about the analysis tools they had used.
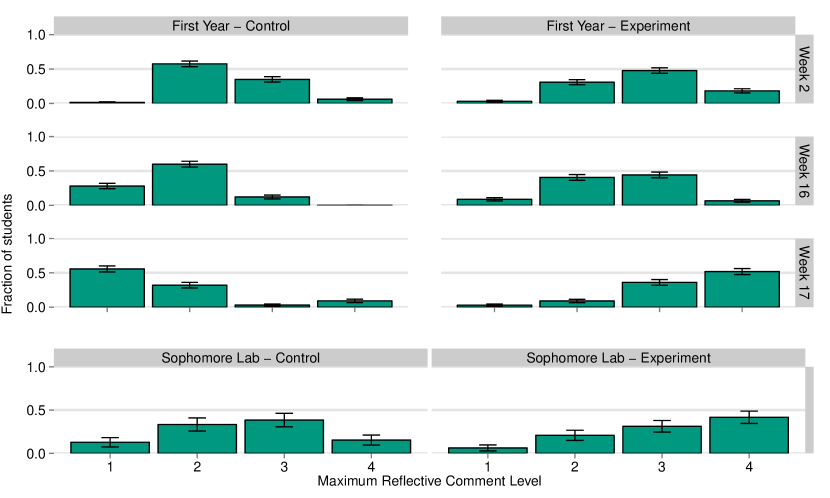
Students in the control group had primarily been analyzing and interpreting results (level one and two), but not acting on them. Since students will continue to use strategies that have been successful in the past Butler2002 , the students were not prepared to deal with the unexpected outcome in week 17. Our data, however, is limited in that we only evaluate what was written in their books by the end of the lab session. It is plausible that the students in the control group were holding high-level discussions about the disagreement, but not writing them down. Their low-level written reflections are, at best, evidence that they needed more time to achieve the outcomes of the experiment group.
In the sophomore lab, the students in the experimental group continued to show a high level in their reflective comments, showing a sustained change in reasoning and epistemology. The students in the control group show higher-level reflections in the sophomore lab than they did in the first-year lab, possibly because of the greater time given to analyze their data, the prompt about the model failing, or the selection of these students as physics majors. They still remained well below the level of the experimental group, nonetheless.
Discussion
The cycles of making and deciding how to act on quantitative comparisons gave students experience with making authentic scientific decisions about data and models. Since students had to ultimately decide how to proceed, the cycles provided a constrained experimental design space to prepare them for autonomous decision-making Sere2002 . With a focus on the quality of their data and how they could improve it, they came to believe that they are able to test and evaluate models. This is not just an acquisition of skills; it is an attitudinal and epistemological shift unseen in the control group or in other studies of instructional labs PERC ; Sere2001 . The training in how to think like an expert inherently teaches students how experts think and, thus, how experts generate knowledge Baron1993 .
The simple nature of the structure employed here gives students both a framework and a habit of mind that leaves them better prepared to transfer the skills and behaviours to new contexts Bulu2010 ; SalomonPerkins ; Sternberg . This simplicity also makes it easily generalizable to a very wide range of instructional settings; any venue that contains opportunities to make decisions based on comparisons.
Acknowledgments
The authors would like to acknowledge the support of Deborah Butler in preparing the manuscript. We would also like to thank Jim Carolan for the diagnostic survey data about the study participants. This research was supported by UBC’s Carl Wieman Science Education Initiative.
References
- [1] Kanari Z and Millar R (2004) Reasoning from data: How students collect and interpret data in science investigations. J Res Sci Teach 41(7):748-769.
- [2] Kumassah E-K, Ampiah J-G, and Adjei E-J (2013) An investigation into senior high school (shs3) physics students understanding of data processing of length and time of scientific measurement in the Volta region of Ghana. International Journal of Research Studies in Educational Technology 3(1):37-61.
- [3] Kung R-L and Linder C (2006) University students’ ideas about data processing and data comparison in a physics laboratory course. Nordic Studies in Science Education 2(2):40-53.
- [4] Ryder J and Leach J (2000) Interpreting experimental data: the views of upper secondary school and university science students. Int J Sci Educ 22(10):1069-1084.
- [5] Ryder J (2002) Data Interpretation Activities and Students’ Views of the Epistemology of Science during a University Earth Sciences Field Study Course. Teaching and Learning in the Science Laboratory, eds. Psillos D, Niedderer H(Springer Netherlands), pp 151-162.
- [6] Séré M-G, Journeaux R, and Larcher C (1993) Learning the statistical analysis of measurement errors. Int J Sci Educ 15(4):427-438.
- [7] Baron J (1993) Why Teach Thinking? - An Essay. Appl Psych 42(3):191-214.
- [8] Ericsson K-A, Krampe R-T, and Tesch-Romer C (1993) The role of deliberate practice in the acquisition of expert performance. Psychol Rev 100(3):363-406.
- [9] Kuhn D and Pease M (2008) What Needs to Develop in the Development of Inquiry Skills? Cognition Instruct 26(4):512-559.
- [10] Allie S, Buffler A, Campbell B, and Lubben F (1998) First-year physics students’ perceptions of the quality of experimental measurements. Int J Sci Educ 20(4):447-459.
- [11] Holmes N-G and Bonn D-A (2013) Doing Science Or Doing A Lab? Engaging Students With Scientific Reasoning During Physics Lab Experiments. 2013 PERC Proceedings, eds. Engelhardt P-V, Churukian A-D, and Jones D-L (Portland, OR):185-188.
- [12] Séré M-G, Fernandez-Gonzalez M, Gallegos J-A, Gonzalez-Garcia F, De Manuel E, Perales F-J, and Leach J (2001) Images of Science Linked to Labwork: A Survey of Secondary School and University Students Res Sci Educ 31(4):499-523.
- [13] Anderson L-W and Sosniak L-A (1994) Bloom’s taxonomy: A forty-year retrospective (NSSE: University of Chicago Press, Chicago, IL).
- [14] Holmes N-G, Ives J, and Bonn D-A (2014) The Impact of Targeting Scientific Reasoning on Student Attitudes about Experimental Physics. 2014 PERC Proceedings, eds. Engelhardt P-V, Churukian A-D, and Jones D-L (Minneapolis, MN).
- [15] Kapur M (2008) Productive Failure. Cognition Instruct 26(3):379-424.
- [16] VanLehn K (1988) Toward a Theory of Impasse-Driven Learning. Cognitive Sci, eds. Mandl H and Lesgold A (Springer, US) pp. 19-41.
- [17] Butler, D-L (2002) Individualizing Instruction in Self-Regulated Learning. Theor Pract 41(2):81-92.
- [18] Séré M-G (2002) Towards renewed research questions from the outcomes of the European project Labwork in Science Education. Sci Educ 86(5):624-644.
- [19] Bulu S and Pedersen S (2010) Scaffolding middle school students’ content knowledge and ill-structured problem solving in a problem-based hypermedia learning environment. ETR&D-Educ Tech Res 58(5):507-529.
- [20] Salomon G and Perkins D-N (1989) Rocky Roads to Transfer: Rethinking Mechanism of a Neglected Phenomenon. Educ Psychol 24(2):113-142.
- [21] Sternberg R-J and Ben-Zeev T (2001) Complex cognition: The psychology of human thought (Oxford University Press).
- [22] Krzywinski M and Altman N (2013) Points of Significance: Error bars. Nat Methods 10(10):921-922.
- [23] BIPM, IEC, IFCC, ISO, IUPAC, IUPAP, and OIML (2008) Guides to the expression of uncertainty in measurement (Organization for Standardization).
- [24] Ding L, Chabay R, Sherwood B, and Beichner R (2006) Evaluating an electricity and magnetism assessment tool: Brief electricity and magnetism assessment. Phys Rev Spec Top-PH 2(1):010105
- [25] Hestenes D and Wells M (1992) A mechanics baseline test. Phys Teach 30(3):159-.
- [26] Hestenes D, Wells M, and Swackhamer G (1992) Force concept inventory. Phys Teach 30(3):141-158.
- [27] R Core Team (2014) R: A language and environment for statistical computing. (R Foundation for Statistical Computing).
- [28] Bates D, Maechler M, Bolker B, and Walker S (2014) lme4: Linear mixed-effects models using Eigen and S4. (R Foundation for Statistical Computing).
- [29] Fox J and Weisberg S (2011) An R Companion to Applied Regression. R Foundation for Statistical Computing.
- [30] Hofstein A and Lunetta V-N (2004) The laboratory in science education: Foundations for the twenty-first century. Sci Educ 88(1):28-54.