Injection Locking of a Semiconductor Double Quantum Dot Micromaser
Abstract
Emission linewidth is an important figure of merit for masers and lasers. We recently demonstrated a semiconductor double quantum dot (DQD) micromaser where photons are generated through single electron tunneling events. Charge noise directly couples to the DQD energy levels, resulting in a maser linewidth that is more than 100 times larger than the Schawlow-Townes prediction. Here we demonstrate a linewidth narrowing of more than a factor 10 by locking the DQD emission to a coherent tone that is injected to the input port of the cavity. We measure the injection locking range as a function of cavity input power and show that it is in agreement with the Adler equation. The position and amplitude of distortion sidebands that appear outside of the injection locking range are quantitatively examined. Our results show that this unconventional maser, which is impacted by strong charge noise and electron-phonon coupling, is well described by standard laser models.
I Introduction
Masers and lasers have widespread applications in science and technology. Lasers are fundamentally different from conventional light sources (e.g. incandescent light bulbs and light emitting diodes) due to the fact that they emit coherent radiation of high intensity Siegman (1986); Milonni and Eberly (1988). These characteristics enable a wide range of applications, including industrial scale laser cutting and welding, light detection and ranging (LIDAR), and fundamental gravitational wave searches, such as the laser interferometer gravitational wave observatory (LIGO) Collis and Russel (1976); Abramovici et al. (1992). Laser interference patterns have a high contrast ratio and their application for cold atom trapping has opened up new frontiers in atomic, molecular, and optical physics (AMO) Raab et al. (1987); Aspect et al. (1988); Lett et al. (1988).
In applications such as atomic clocks, interferometers, and optical lattices, it is important to have a narrow linewidth laser to achieve high spatial resolution and stability. Schawlow and Townes (ST) derived a minimum laser linewidth by considering the competition between spontaneous emission and stimulated emission Schawlow and Townes (1958). In typical semiconductor lasers, it is not uncommon to observe linewidths that are 10–100 times larger than the ST prediction due to charge fluctuations Milonni and Eberly (1988). In comparison, state-of-the-art lasers in atomic systems can reach, or even exceed, the ST limit to achieve linewidths close to 1 mHz Meiser et al. (2009); Kessler et al. (2012); Bohnet et al. (2012). To harness the full potential of solid state masers and lasers, it is important to stabilize the emission frequency.
Injection locking is a commonly used method for narrowing the linewidth of a laser. With injection locking, laser emission is stabilized by the injection of an input tone that results in stimulated emission at the frequency of the injected tone. Frequency locking of oscillators has a rich history, extending back to Huygens in 1666, who observed that two initially unsynchronized clocks would eventually synchronize due to mechanical vibrations transmitted via a common beam Siegman (1986). Since then, frequency locking has been observed in systems ranging from fireflies Mirollo and Strogatz (1990), to spin transfer torque oscillators Kaka et al. (2005), and matter waves of Bose gas Hofferberth et al. (2007). For optical lasers, injection locking was first observed by Stover et al. Stover and Steier (1966). It is now commonly used to improve the coherence of lasers by driving the input port with a narrow linewidth signal Schünemann et al. (1998). Injection locking effects in a trapped ion phonon laser have been proposed for sensitive force sensing Knünz et al. (2010). Other applications include amplification and frequency modulated signal detection in solid-state oscillators Kurokawa (1973). Laser combs with high power and coherence are generated by stabilizing a laser comb using the injection locking effect Fortier et al. (2006) and high resolution spectroscopy of cold atoms has been achieved by the self-injection of comb bunches Del’Haye et al. (2014).
In this paper we demonstrate injection locking of the recently discovered semiconductor DQD micromaser. The DQD micromaser is driven by single electron tunneling events between discrete zero-dimensional electronic states Liu et al. (2014). A free-running emission linewidth of 34 kHz was measured, nearly 100 times larger than the ST prediction Schawlow and Townes (1958). Time-series analysis of the emitted signal indicates the maser output is fluctuating as a function of time. These fluctuations are believed to be due to charge noise, which electrostatically couples to the DQD energy levels and results in significant broadening of the emission peak.
Here we show that the emission linewidth can be narrowed by more than a factor of 10 using injection locking. For the case when the injected tone is detuned from the free running maser frequency by several linewidths, the maser emission frequency is “pulled” by, and eventually locked to the input tone with increasing input power. The frequency range over which the maser can be injection locked increases with injected signal power following the power law relation predicted by Adler Adler (1946). We also investigate the dynamics of the maser just outside of the injection locking regime, where the frequency pull is appreciable and leads to distortion sidebands in the emission spectrum. The emission powers and positions of the sidebands are in excellent agreement with theoretical predictions Siegman (1986); Jahanpanah and Loudon (1996). These measurements indicate that the DQD micromaser, which is driven by single electron tunneling events, follows predictions from conventional laser theory and can be considerably improved using injection locking effects.
II Double Quantum Dot Micromaser
We first briefly describe the main aspects of the DQD micromaser Liu et al. (2015). The maser is fabricated in the circuit quantum electrodynamics architecture (cQED) and consists of a superconducting transmission line resonator, two semiconductor DQDs that serve as the gain medium, and a voltage bias that generates population inversion. The half-wavelength () Nb coplanar waveguide resonator has a resonance frequency = 7880.6 MHz Wallraff et al. (2004); Frey et al. (2012); Petersson et al. (2012). The cQED architecture has been used to achieve strong coupling between microwave frequency photons and a superconducting qubit Wallraff et al. (2004). More recently, a variety of quantum dot devices (GaAs, carbon nanotubes, InAs nanowires, etched graphene) have been integrated with microwave cavities Frey et al. (2012); Toida et al. (2013); Petersson et al. (2012); Deng et al. .
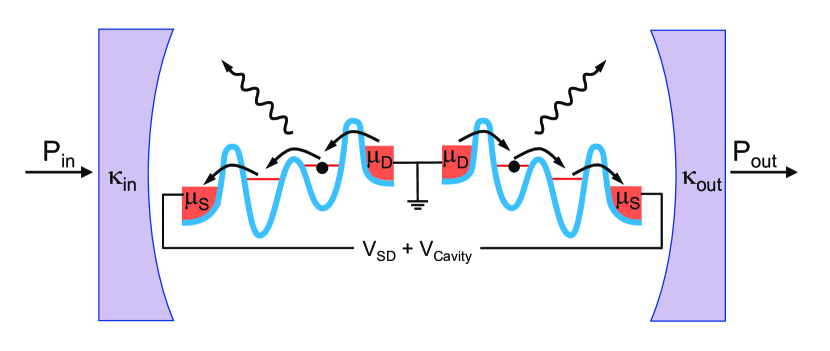
The maser gain medium consists of two semiconductor DQDs, as illustrated in Fig. 1. Each DQD is fabricated by placing a single InAs nanowire across a predefined array of bottom gates Nadj-Perge et al. (2010). Negative voltages are applied to the gates to selectively deplete the nanowire, forming a DQD Nadj-Perge et al. (2010); van der Wiel et al. (2002). Electronic confinement results in a discrete energy level spectrum van der Wiel et al. (2002); Fujisawa et al. (1998). The energy levels can be tuned in-situ by adjusting the voltages applied to the bottom gates. In the nanowire DQDs investigated here, the electric dipole moment , where is the electronic charge and is the Bohr radius Frey et al. (2012); Petersson et al. (2012). We measure a charge-cavity interaction rate MHz Petersson et al. (2012); Liu et al. (2014). Quantum dots fabricated from other materials systems yield similar = 10 – 100 MHz Frey et al. (2012); Delbecq et al. (2011, 2013); Toida et al. (2013).
Electron beam lithography is used to make source and drain contacts to the nanowires. A source-drain bias mV is applied to give a preferred direction for electron flow. Single electron tunneling is only allowed when the DQD energy levels are arranged such that an electron can tunnel downhill in energy [see Fig. 1], otherwise current flow is blocked due to Coulomb blockade van der Wiel et al. (2002). Consider the left DQD shown in Fig. 1. Starting with an empty DQD, a single electron first tunnels from the drain to the right dot. This tunneling event is followed by an interdot charge transition from the right dot to the left dot, and subsequent tunneling of the electron from the left dot to the source. The source-drain bias effectively repumps the higher energy level in the DQD and generates conditions for population inversion. As shown in previous work, the interdot charge transition results in microwave frequency photoemission Liu et al. (2014, 2015).
The DQD micromaser is in some ways similar to a quantum cascade laser (QCL). In a QCL, current flows through a precisely engineered quantum well structure and results in the cascaded emission of photons whose frequency is set by the quantum well layer thicknesses Faist et al. (1994). In comparison, photons in the DQD micromaser are generated by single electron tunneling through electrically tunable DQD energy levels. While electrical control allows for in situ tuning of the gain medium, it also means that the energy level separation will be susceptible to charge noise. To appreciate the magnitude of the noise, one can compare the measured root-mean-squared charge noise GHz with the much smaller MHz and cavity linewidth 3 MHz Petersson et al. (2012); Liu et al. (2014); Frey et al. (2012); Toida et al. (2013); Petersson et al. (2012); Deng et al. . Charge noise will drive the DQDs out of resonance with the cavity, making it difficult to reach the strong-coupling regime Meschede et al. (1985); McKeever et al. (2003); Ates et al. (2009). In terms of maser performance, charge fluctuations adversely impact the stability of the emission frequency and power Liu et al. (2015).
Electron-phonon coupling is also an important factor in solid-state devices and has been extensively studied in semiconductor DQDs. Measurements of the inelastic current as a function of the DQD energy level detuning reveal oscillations that have been attributed to electron-phonon coupling Fujisawa et al. (1998); Weber et al. (2010). These effects are especially pronounced when the dot size is comparable to the phonon wavelength Meunier et al. (2007). The resulting orbital relaxation rate is on the order of 100 MHz Fujisawa et al. (1998); Petta et al. (2004), again much larger than and . Recent studies of photoemission in cavity-coupled DQDs shows that only 1 photon is emitted into the cavity mode for every 1,000–10,000 electrons that tunnel through the DQD Liu et al. (2014); Stockklauser et al. (2015) and that the DQD maser gain profile can only be reproduced in theory when second order processes involving emission of photon and phonon are taken into account Gullans et al. (2015). These previous studies highlight important differences between the DQD micromaser and its atomic beam counterparts Meschede et al. (1985).
III Experimental Results
We now present experimental data obtained on the semiconductor DQD micromaser. In Section III.A we briefly review recently published measurements of the DQD micromaser that examined the amplification of an input tone and measured the photon statistics of the maser in free-running mode (i.e. cavity emission in the absence of an input tone). These earlier works demonstrated that charge noise and phonons have a significant effect on maser operation Liu et al. (2015); Gullans et al. (2015). In Section III.B we present new results showing that the maser emission can be injection locked by driving the input port of the cavity with a corresponding reduction in the emission linewidth. The injection locking range is measured as a function of input power and shown to be in good agreement with standard laser theory. Section III.C examines the frequency pull and distortion sidebands that appear outside of the locking range. Detailed analysis of the sidebands also yields excellent agreement with theoretical predictions.
III.1 Free-Running Maser Characterization
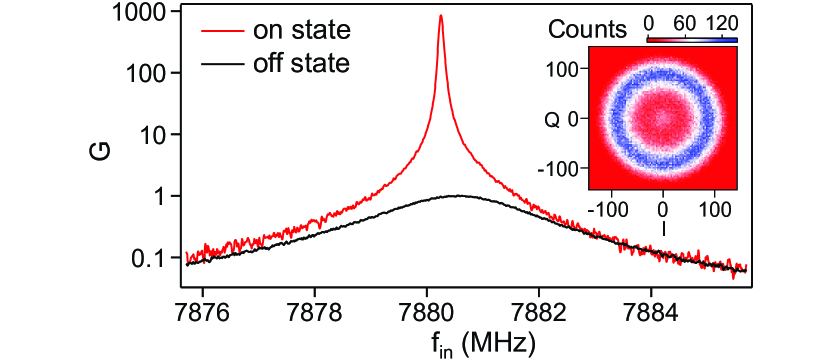
The maser is first characterized by driving the input port of the cavity at frequency and power . Cavity power gain is defined as , where is the power exiting the output port of the cavity. The normalization constant is defined such that the peak power gain = 1 when both DQDs are configured in Coulomb blockade (off state). Figure 2 shows as a function of with = -120 dBm. The black curve is the cavity response in the off state Liu et al. (2015). Fitting the gain to a Lorentzian we extract the cavity center frequency MHz and linewidth MHz. Here . is the decay rate through the input(output) port and is the photon loss rate through other channels. The red curve shows as a function of when current is flowing through both DQDs (on state). Here the cavity response is sharply peaked at = 7880.25 MHz, yielding with a full-width-half-max (FWHM) = 0.07 MHz, suggestive of a transition to an above-threshold maser state.
Above-threshold maser action is confirmed by measuring the statistics of the output field as described in Ref. Liu et al. (2015). These measurements are performed in free-running mode (with no input tone applied). The output signal is amplified and demodulated to yield the in-phase () and quadrature-phase () components, which are sampled at a rate of 1 MHz. The results from 400,000 individual measurements are shown in the two-dimensional histogram plotted in the inset of Fig. 2(b). The IQ histogram has a donut shape that is consistent with a stable oscillator, however the amplitude fluctuations are much larger than expected. Time-series analysis of the free-running emission signal suggests that large charge fluctuations are impacting the emission stability Liu et al. (2015). It is therefore desirable to stabilize the output of the maser.
III.2 Injection Locking the Semiconductor DQD Micromaser
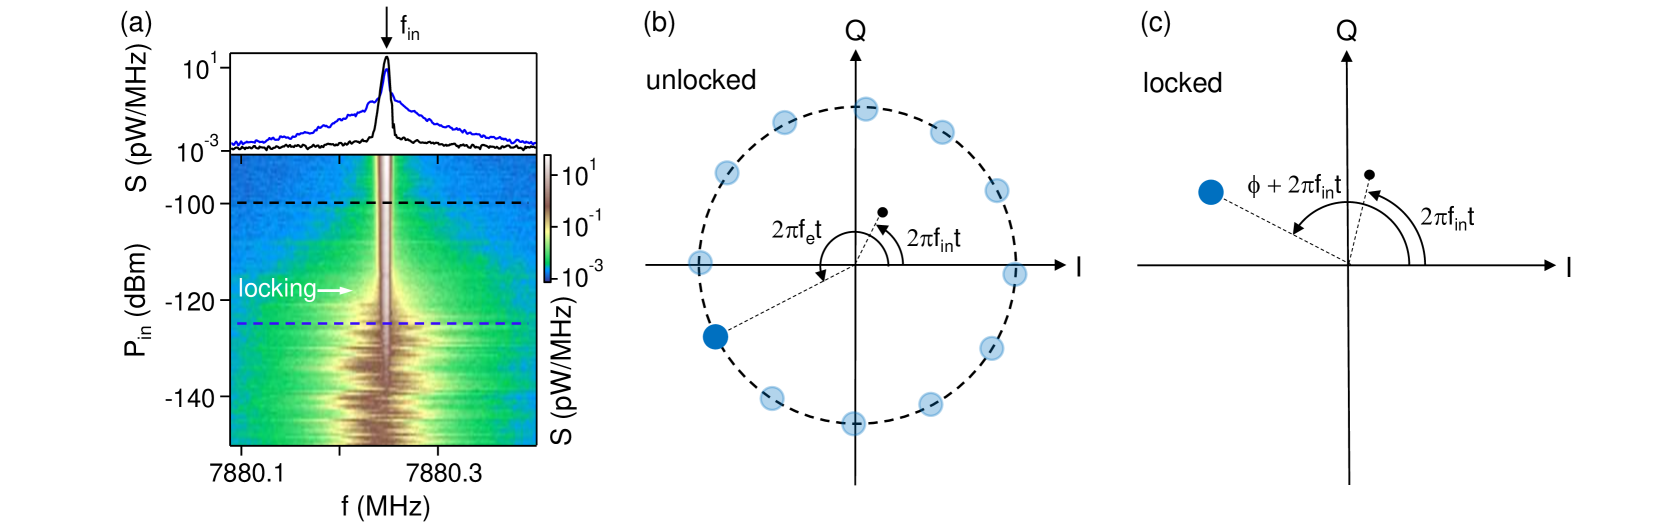
We now demonstrate injection locking of the maser by measuring the power spectral density of the emitted radiation as a function of the power of the input tone. The main panel of Fig. 3(a) shows as a function of with = 7880.25 MHz set near the free running emission frequency . Line cuts through the data are shown in the upper panel for dBm (blue curve) and dBm (black curve). For negligible input powers ( dBm) the power spectrum exhibits a broad peak near MHz. For a given value of , the emission peak typically has a full-width-half-max (FWHM) = 34 kHz. For -125 dBm, charge noise causes the emission peak to significantly wander in the frequency range MHz. In this configuration the relative phases of the input tone and the maser emission are unlocked, as illustrated in Fig. 3(b). As is increased, the photon number in the cavity at increases, resulting in increased stimulated emission. With -125 dBm, the broad tails of the emission peak are suppressed and the spectrum begins to narrow. The free running maser emission is eventually locked to the input tone around -115 dBm. Now the large fluctuations that were observed in the absence of an input tone are suppressed, and 3 kHz RBW . The linewidth is reduced by more than a factor of 10 compared to the free-running case and indicates phase stabilization, as illustrated in Fig. 3(c).
Although our measurement of the linewidth is limited by technical effects RBW , we can estimate the fundamental limit to the linewidth for this device. Previous measurements on the output field indicated that the masing process intermittently shuts off due to large charge fluctuations that reduce the gain below threshold Liu et al. (2015). During these off periods, the maser emission will cease to be injection locked to the input tone and will lose phase coherence. As a result, the linewidth will be limited by the inverse of the switching time . In Ref. Liu et al. (2015), was observed to be roughly s, which sets the fundamental linewidth limit due to charge noise as kHz. The linewidth prediction is comparable to our measurement resolution and a factor of 10 smaller than the linewidth of the free-running maser, but still larger than the ST limit by the same factor. Further reductions of the linewidth will most likely require reducing charge noise in these devices.
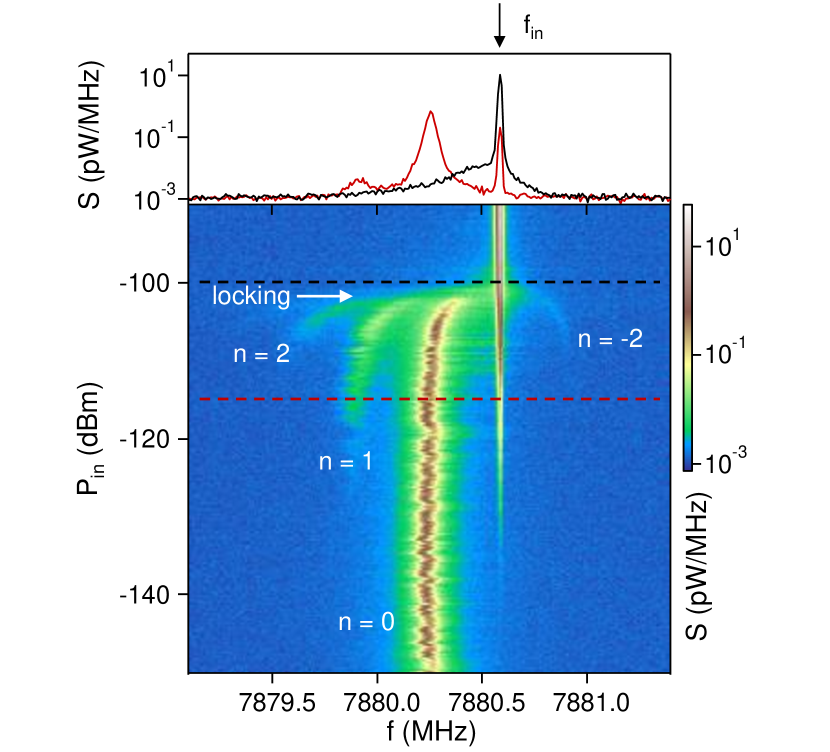
Comparable effects are observed when = 7880.60 MHz, more than 10 line-widths detuned from [Fig. 4]. With dBm only the free running emission peak is visible in . As is further increased the injection tone becomes visible and the power spectrum is simply a sum of the free running maser emission and the cavity input tone. When -125 dBm distortion sidebands appear and the free running emission peak is pulled towards the input tone. The maser abruptly locks to when -102 dBm, but the emission is still somewhat broad. The linewidth continues to narrow until -98 dBm, beyond which point the measured linewidth is limited by experimental factors RBW . The upper panel of Fig. 4 shows line cuts through the data, acquired at -115 dBm (red curve) and -100 dBm (black curve). The sidebands that are visible in (marked = -2, 0, 1, and 2) are quantitatively analyzed in Section III.C Siegman (1986); Jahanpanah and Loudon (1996).
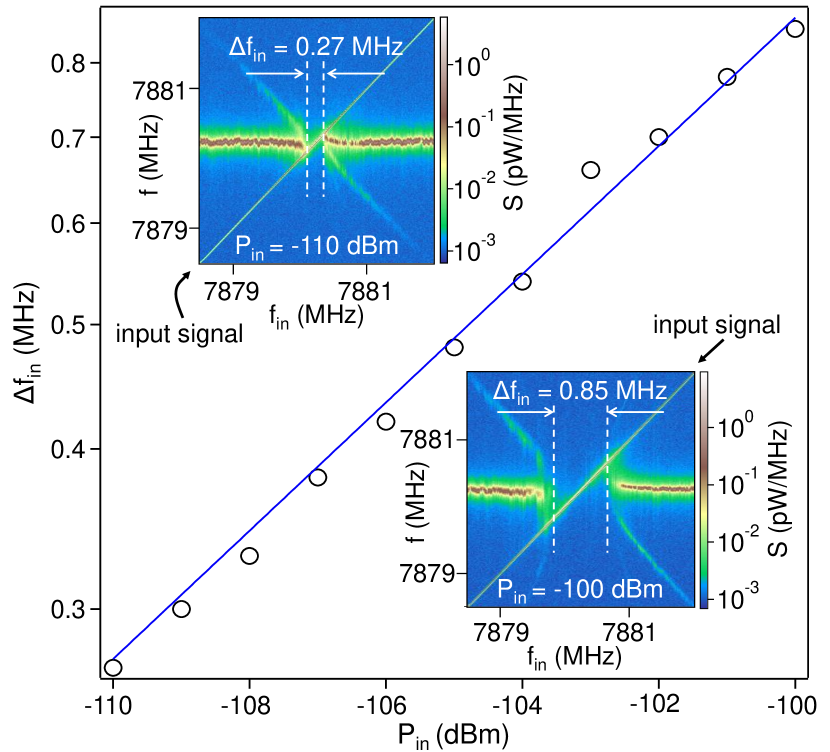
We next measure the frequency range over which the maser is injection locked. The upper inset of Fig. 5 shows a color-scale plot of as a function of measured with = -110 dBm. The input signal is visible in and marked with an arrow for clarity. As seen in the data, has little effect on the maser emission when it is far-detuned from . As is increased and brought closer to , frequency pulling is visible and emission sidebands appear. The maser then abruptly locks to , and remains locked to over a frequency range = 0.27 MHz. The lower inset of Fig. 5 shows as a function of with = -100 dBm. Here the maser is injection locked over a larger range = 0.85 MHz. Similar to the upper inset, frequency pulling and sidebands are observed outside of the injection locking range. By repeating these measurements at different , we obtain the data shown in the main panel of Fig. 5, where is plotted as a function of . The blue line in Fig. 5 is a fit to the power law relation = , with the measured prefactor = , where the error bar is due to 3 dB of uncertainty in the transmission line losses.
The measured power law relation can be compared with predictions from Adler’s theory, which considers the maser dynamics in the rotating frame of the input tone by assuming that the input power is small compared to the free emission power Adler (1946). We express the cavity output field as
| (1) |
where is the emitted power (assumed to be constant) and is the relative phase of the input field and the emitted field . The relative phase follows the Adler equation:
| (2) |
In the injection locking range , Eq. (2) has a static solution . The emission phase is then “locked” to the input tone with , which corresponds to the case illustrated in Fig. 3(c).
Adler’s analysis shows that is proportional to the amplitude of the input signal such that
| (3) |
The cavity prefactor accounts for internal cavity losses and is obtained using cavity input-output theory Siegman (1986). Our microwave cavity is designed with MHz, and MHz is directly extracted from the data in Fig. 2. These quantities yield . The average emitted maser output power pW. Using these quantities we find
We therefore find reasonable agreement between the data and the predictions from Adler’s theory, considering the uncertainties in the transmission line losses.
III.3 Behavior Outside of the Injection Locking Range: Frequency Pull and Distortion Sidebands
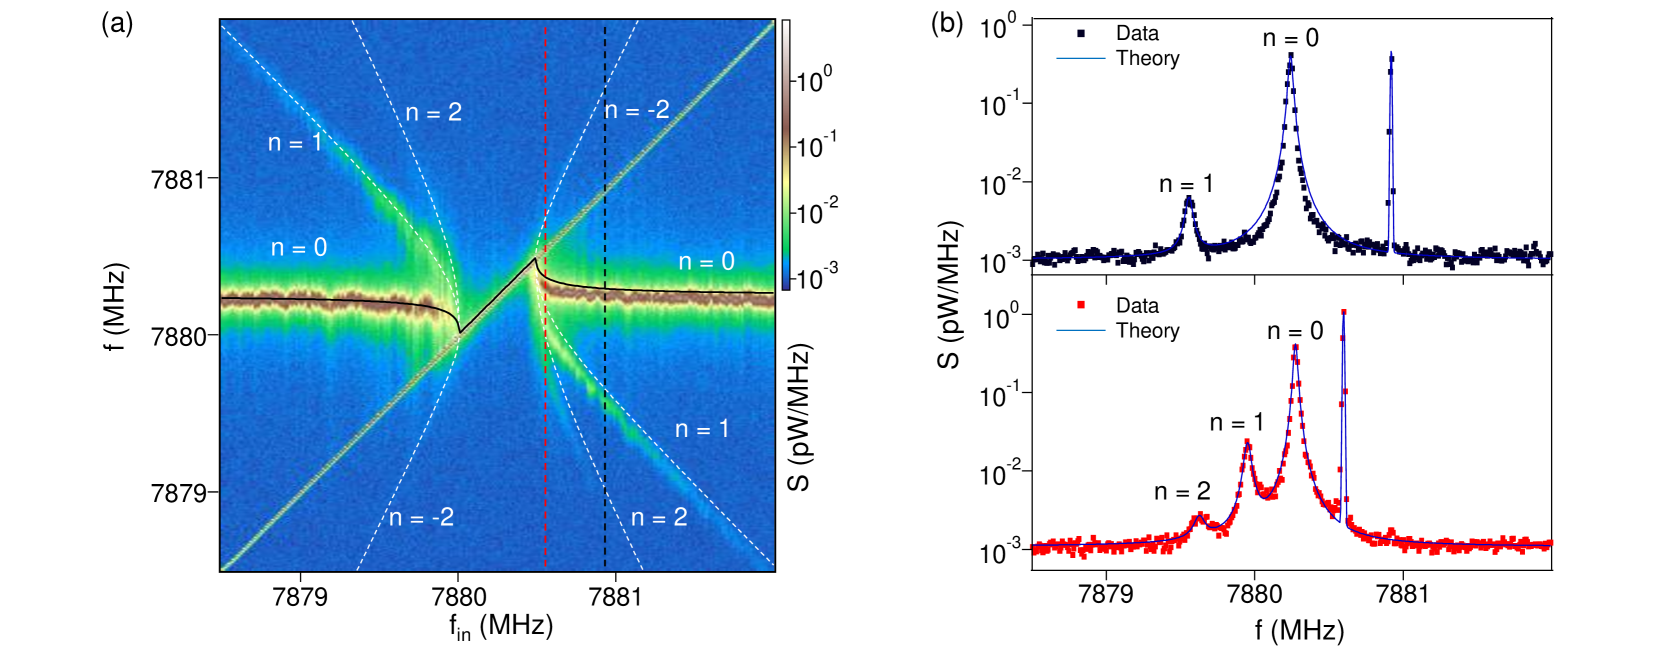
We now examine the behavior of the maser outside of the injection locking range, where the frequency pull is appreciable and distortion sidebands are visible. Figure 6(a) shows as a function of with dBm. Injection locking is observed over a frequency range = 0.48 MHz. Focusing on the region with MHz, we observe one sideband for and two sidebands for . For clarity, the emission peaks are labeled with the index : corresponds to the frequency pulled maser emission peak, corresponds to the input tone, and the other peaks are distortion sidebands. Figure 6(b) shows line cuts through the data at = 7880.92 MHz (upper panel) and = 7880.60 MHz (lower panel). When = 7880.92 MHz, the pulled emission peak ( = 0) is detuned from by the beat frequency . For this set of parameters we measure MHz. The = 1 sideband is detuned from the = 0 peak by . When = 7880.60 MHz, the = 2 sideband is also visible. To allow for a quantitative comparison with theory, we analyze the spectra in Fig. 6(b) by fitting the sideband emission peaks to a Lorentzian lineshape and the input tone to a Gaussian with a width of 10 kHz RBW . The sideband powers are listed in Table 1.
To compare the data with theory, we seek a general solution for . In the limit of small , and . In this case the cavity field can simply be considered as a sum of the free emission signal and the cavity input tone, as shown in Fig. 3(b). Outside of this limit, we solve the Adler equation analytically to find the cavity field
| (4) |
The expansion coefficients have been calculated by Armand and are given later Armand (1969). The beat frequency is found self-consistently from this solution
| (5) |
Given that wanders in the frequency range MHz, Eq. 5 predicts MHz at MHz and, MHz at MHz. These values are in general agreement with the measured listed in Table 1. The small discrepancy may be due to charge-noise-induced drift in .
Predicted sideband positions can be obtained by evaluating Eq. 4 in several different regimes. For the far detuned case , higher order harmonics are negligible and . Equation (4) then simplifies to , which represents the pulled emission peak at frequency . First order expansion of Eq. 4 in yields Stover (1966). When the detuning approaches , higher order terms in Eq. 4 give rise to non-negligible expansion coefficients , which results in higher order sideband peaks at frequencies ( = , , …). The predicted is plotted as black solid line in Fig. 6(a) and the predicted 0 sidebands are plotted as white dashed lines. Both the “pulled” emission peak and the location of the distortion sidebands are in good agreement with Adler’s theory.
The sideband powers can be compared with calculations from Armand Armand (1969), who found:
Since the = -1 sideband overlaps with the input tone, it cannot be resolved experimentally. = 0 for -2,
and for
| (6) |
The predictions imply that the 0 sidebands are favored, an asymmetry that is consistent with the data in Fig. 6(b), as well as other laser systems Stover (1966); St-Jean et al. (2014). We can understand this at a qualitative level by noting that, outside the injection locking region, has a fixed sign equal to the sign of . As a result, the maser signal is always trailing or leading the input signal in phase. Since is the approximate frequency of the oscillator, this implies that the formation of sidebands will always be favored at higher(lower) frequencies with respect to when is greater(smaller) than .
| (MHz) | 7880.92 | 7880.60 |
| (MHz) | -0.68 | -0.33 |
| (pW) | ||
| (pW) | ||
| (pW) | NA | |
| NA | ||
| NA |
We can now compare the measured sideband powers with the theoretical predictions. For the data shown in the upper panel of Fig. 6(b), we find , which is very close to the value predicted by Eq. 6 . The theoretical value is calculated taking the measured beat frequency = -0.68 MHz, the measured = 0.48 MHz obtained with dBm, and -0.72 MHz determined from Eq. 5. Similarly, for the lower panel of Fig. 6(b) Adler’s theory predicts ratios = 1.0 and = , which are also in good agreement with the experimental results listed in Table 1.
IV Conclusion and Outlook
In conclusion, the emission linewidth of the semiconductor DQD micromaser can be narrowed by more than a factor of 10 using injection locking. Measurements of the injection locking range as a function of input power very closely follow predictions from Adler’s theory Adler (1946). We also examined the frequency pull and emission sidebands outside of the injection locking regime. Our data show that this exotic maser, which is driven by single electron tunneling events, is well-described by predictions from conventional laser theory. Future areas of work include the development of a quantitative theory to explain how charge noise impacts the emission peak location and linewidth, steps to improve materials to reduce charge noise, and investigation of the micromaser in the single emitter limit (with one semiconductor DQD in the cavity).
Acknowledgements.
Research at Princeton was funded in part by the Packard Foundation, the National Science Foundation (Grants No. DMR-1409556 and DMR-1420541), and the Gordon and Betty Moore Foundation’s EPiQS Initiative through Grant GBMF4535.References
- Siegman (1986) S. E. Siegman, Lasers (University Science Books, Mill Valley, 1986).
- Milonni and Eberly (1988) P. W. Milonni and Joseph H. Eberly, Lasers (Wiley, New York, 1988).
- Collis and Russel (1976) R. T. H. Collis and P. B. Russel, “Laser Monitoring of the Atmosphere,” Top. Appl. Phys. 14, 117 (1976).
- Abramovici et al. (1992) A. Abramovici, W E. Althouse, R. W. P. Drever, Y. Gürsel, S. Kawamura, F. J. Raab, D. Shoemaker, L. Sievers, R. E. Spero, K. S. Thorne, R. E. Vogt, R. Weiss, S. E. Whitcomb, and M. E. Zucker, “LIGO: The Laser Interferometer Gravitational-Wave Observatory,” Science 256, 325 (1992).
- Raab et al. (1987) E. L. Raab, M. Prentiss, A. Cable, S. Chu, and D. E. Pritchard, “Trapping of Neutral Sodium Atoms with Radiation Pressure,” Phys. Rev. Lett. 59, 2631 (1987).
- Aspect et al. (1988) A. Aspect, E. Arimondo, R. Kaiser, N. Vansteenkiste, and C. Cohen-Tannoudji, “Laser Cooling below the One-Photon Recoil Energy by Velocity-Selective Coherent Population Trapping,” Phys. Rev. Lett. 61, 826 (1988).
- Lett et al. (1988) P. D. Lett, R. N. Watts, C. I. Westbrook, W. D. Phillips, P. L. Gould, and H. J. Metcalf, “Observation of Atoms Laser Cooled below the Doppler Limit,” Phys. Rev. Lett. 61, 169 (1988).
- Schawlow and Townes (1958) A. L. Schawlow and C. H. Townes, “Infrared and Optical Masers,” Phys. Rev. 112, 1940 (1958).
- Meiser et al. (2009) D. Meiser, J. Ye, D. R. Carlson, and M. J. Holland, “Prospects for a Millihertz-Linewidth Laser,” Phys. Rev. Lett. 102, 163601 (2009).
- Kessler et al. (2012) T. Kessler, C. Hagemann, C. Grebing, T. Legero, U. Sterr, F. Riehle, M. J. Martin, L. Chen, and J. Ye, “A sub-40-mHz-linewidth laser based on a silicon single-crystal optical cavity,” Nature Photon. 6, 687–692 (2012).
- Bohnet et al. (2012) J. G. Bohnet, Z. Chen, J. M. Weiner, D. Meiser, M. J. Holland, and J. K. Thompson, “A steady-state superradiant laser with less than one intracavity photon,” Nature 484, 78–81 (2012).
- Mirollo and Strogatz (1990) R. Mirollo and S. Strogatz, “Synchronization of Pulse-Coupled Biological Oscillators,” SIAM J. Appl. Math. 50, 1645 (1990).
- Kaka et al. (2005) S. Kaka, M. R. Pufall, W. H. Rippard, T. J. Silva, S. E. Russek, and J. A. Katine, “Mutual Phase-Locking of Microwave Spin Torque Nano-Oscillators,” Nature 437, 389 (2005).
- Hofferberth et al. (2007) S. Hofferberth, I. Lesanovsky, B. Fischer, T. Schumm, and J. Schmiedmayer, “Non-Equilibrium Coherence Dynamics in One-Dimensional Bose Gases,” Nature 449, 324 (2007).
- Stover and Steier (1966) H. L. Stover and W. H. Steier, “Locking of Laser Oscillation by Light Injection,” Appl. Phys. Lett. 8, 91 (1966).
- Schünemann et al. (1998) U. Schünemann, H. Engler, M. Zielonkowski, M. Weidemüller, and R. Grimm, “Magneto-Optic Trapping of Lithium Using Semiconductor Lasers,” Opt. Commun. 158, 263 (1998).
- Knünz et al. (2010) S. Knünz, M. Herrmann, V. Batteiger, G. Saathoff, T. W. Hänsch, K. Vahala, and Th. Udem, “Injection Locking of a Trapped-Ion Phonon Laser,” Phys. Rev. Lett. 105, 013004 (2010).
- Kurokawa (1973) K. Kurokawa, “Injection Locking of Microwave Solid-State Oscillators,” Proc. IEEE 61, 1386 (1973).
- Fortier et al. (2006) T. M. Fortier, Y. Le Coq, J. E. Stalnaker, D. Ortega, S. A. Diddams, C. W. Oates, and L. Hollberg, “Kilohertz-Resolution Spectroscopy of Cold Atoms with an Optical Frequency Comb,” Phys. Rev. Lett. 97, 163905 (2006).
- Del’Haye et al. (2014) P. Del’Haye, K. Beha, S. B. Papp, and S. A. Diddams, “Self-Injection Locking and Phase-Locked States in Microresonator-Based Optical Frequency Combs,” Phys. Rev. Lett. 112, 043905 (2014).
- Liu et al. (2014) Y.-Y. Liu, K. D. Petersson, J. Stehlik, J. M. Taylor, and J. R. Petta, “Photon Emission from a Cavity-Coupled Double Quantum Dot,” Phys. Rev. Lett. 113, 036801 (2014).
- Adler (1946) R. Adler, “A Study of Locking Phenomena in Oscillators,” Proc. IRE 34, 351 (1946).
- Jahanpanah and Loudon (1996) J. Jahanpanah and R. Loudon, “Theory of Laser-Amplifier Injection Locking,” Phys. Rev. A 54, 5210 (1996).
- Liu et al. (2015) Y.-Y. Liu, J. Stehlik, C. Eichler, M. J. Gullans, J. M. Taylor, and J. R. Petta, “Semiconductor Double Quantum Dot Micromaser,” Science 347, 285 (2015).
- Wallraff et al. (2004) A. Wallraff, D. I. Schuster, A. Blais, L. Frunzio, R.-S. Huang, J. Majer, S. Kumar, S. M. Girvin, and R. J. Schoelkopf, “Strong Coupling of a Single Photon to a Superconducting Qubit Using Circuit Quantum Electrodynamics,” Nature 431, 162 (2004).
- Frey et al. (2012) T. Frey, P. J. Leek, M. Beck, A. Blais, T. Ihn, K. Ensslin, and A. Wallraff, “Dipole Coupling of a Double Quantum Dot to a Microwave Resonator,” Phys. Rev. Lett. 108, 046807 (2012).
- Petersson et al. (2012) K. D. Petersson, L. W. McFaul, M. D. Schroer, M. Jung, J. M. Taylor, A. A. Houck, and J. R. Petta, “Circuit Quantum Electrodynamics with a Spin Qubit,” Nature 490, 380 (2012).
- Toida et al. (2013) H. Toida, T. Nakajima, and S. Komiyama, “Vacuum Rabi Splitting in a Semiconductor Circuit QED System,” Phys. Rev. Lett. 110, 066802 (2013).
- (29) G.-W. Deng, D. Wei, J. R. Johansson, M.-L. Zhang, S.-X. Li, H.-O. Li, G. Cao, M. Xiao, T. Tu, G.-C. Guo, H.-W. Jiang, F. Nori, and G.-P. Guo, “Circuit QED with a Graphene Double Quantum Dot and a Reflection-Line Resonator,” arXiv:1310.6118 .
- Nadj-Perge et al. (2010) S. Nadj-Perge, S. M. Frolov, E. P. A. M. Bakkers, and L. P. Kouwenhoven, “Spin-Orbit Qubit in a Semiconductor Nanowire,” Nature 468, 1084 (2010).
- van der Wiel et al. (2002) W. G. van der Wiel, S. De Franceschi, J. M. Elzerman, T. Fujisawa, S. Tarucha, and L. P. Kouwenhoven, “Electron Transport Through Double Quantum Dots,” Rev. Mod. Phys. 75, 1 (2002).
- Fujisawa et al. (1998) T. Fujisawa, T. H. Oosterkamp, W. G. van der Wiel, B. W. Broer, R. Aguado, S. Tarucha, and L. P. Kouwenhoven, “Spontaneous Emission Spectrum in Double Quantum Dot Devices,” Science 282, 932 (1998).
- Delbecq et al. (2011) M. R. Delbecq, V. Schmitt, F. D. Parmentier, N. Roch, J. J. Viennot, G. Fève, B. Huard, C. Mora, A. Cottet, and T. Kontos, “Coupling a Quantum Dot, Fermionic Leads, and a Microwave Cavity on a Chip,” Phys. Rev. Lett. 107, 256804 (2011).
- Delbecq et al. (2013) M. R. Delbecq, L. E. Bruhat, J. J. Viennot, S. Datta, A. Cottet, and T. Kontos, “Photon-Mediated Interaction Between Distant Quantum Dot Circuits,” Nat. Commun. 4, 1400 (2013).
- Faist et al. (1994) J. Faist, F. Capasso, D. L. Sivco, C. Sirtori, A. L. Hutchinson, and A. Y. Cho, “Quantum Cascade Laser,” Science 264, 553 (1994).
- Meschede et al. (1985) D. Meschede, H. Walther, and G. Müller, “One-Atom Maser,” Phys. Rev. Lett. 54, 551 (1985).
- McKeever et al. (2003) J. McKeever, A. Boca, A. D. Boozer, J. R. Buck, and H. J. Kimble, “Experimental Realization of a One-Atom Laser in the Regime of Strong Coupling,” Nature 425, 268 (2003).
- Ates et al. (2009) S. Ates, S. M. Ulrich, S. Reitzenstein, A. Löffler, A. Forchel, and P. Michler, “Post-Selected Indistinguishable Photons from the Resonance Fluorescence of a Single Quantum Dot in a Microcavity,” Phys. Rev. Lett. 103, 167402 (2009).
- Weber et al. (2010) C. Weber, A. Fuhrer, C. Fasth, G. Lindwall, L. Samuelson, and A. Wacker, “Probing Confined Phonon Modes by Transport through a Nanowire Double Quantum Dot,” Phys. Rev. Lett. 104, 036801 (2010).
- Meunier et al. (2007) T. Meunier, I. T. Vink, L. H. Willems van Beveren, K-J. Tielrooij, R. Hanson, F. H. L. Koppens, H. P. Tranitz, W. Wegscheider, L. P. Kouwenhoven, and L. M. K. Vandersypen, “Experimental Signature of Phonon-Mediated Spin Relaxation in a Two-Electron Quantum Dot,” Phys. Rev. Lett. 98, 126601 (2007).
- Petta et al. (2004) J. R. Petta, A. C. Johnson, C. M. Marcus, M. P. Hanson, and A. C. Gossard, “Manipulation of a Single Charge in a Double Quantum Dot,” Phys. Rev. Lett. 93, 186802 (2004).
- Stockklauser et al. (2015) A. Stockklauser, V. F. Maisi, J. Basset, K. Cujia, C. Reichl, W. Wegscheider, T. Ihn, A. Wallraff, and K. Ensslin, “Microwave emission from hybridized states in a semiconductor charge qubit,” Phys. Rev. Lett. 115, 046802 (2015).
- Gullans et al. (2015) M. J. Gullans, Y.-Y. Liu, J. Stehlik, J. R. Petta, and J. M. Taylor, “Phonon-Assisted Gain in a Semiconductor Double Quantum Dot Maser,” Phys. Rev. Lett. 114, 196802 (2015).
- (44) The frequency resolution is limited by the resolution bandwidth of the Agilent spectrum analyzer E4405B. For Fig. 3 the RBW is set to 3 kHz and 10 kHz for Fig. 4-6.
- Armand (1969) M. Armand, “On the Output Spectrum of Unlocked Driven Oscillators,” Proc. IEEE 57, 798–799 (1969).
- Stover (1966) H. L. Stover, “Theoretical Explanation for the Output Spectra of Unlocked Driven Oscillators,” Proc. IEEE 54, 310–311 (1966).
- St-Jean et al. (2014) M. R. St-Jean, M. I. Amanti, A. Bernard, A. Calvar, A. Bismuto, E. Gini, M. Beck, J. Faist, H. C. Liu, and C. Sirtori, “Injection Locking of Mid-Infrared Quantum Cascade Laser at 14 GHz, by Direct Microwave Modulation,” Laser Photonics Rev. 8, 443 (2014).