Superdeformed band in the nucleus 40Ar: A projected shell model analysis
Abstract
It has been debated whether the experimentally-identified superdeformed rotational band in 40Ar [E. Ideguchi, et al., Phys. Lett. B 686 (2010) 18] has an axially or triaxially deformed shape. Projected shell model calculations with angular-momentum-projection using an axially-deformed basis are performed up to high spins. Our calculated energy levels indicate a perfect collective-rotor behavior for the superdeformed yrast band. However, detailed analysis of the wave functions reveals that the high-spin structure is dominated by mixed 0-, 2-, and 4-quasiparticle configurations. The calculated electric quadrupole transition probabilities reproduce well the known experimental data and suggest a reduced, but still significant, collectivity in the high spin region. The deduced triaxial deformation parameters are small throughout the entire band, suggesting that triaxiality is not very important for this superdeformed band.
keywords:
Superdeformation , Pairing correlation , Projected shell modelPACS:
21.10.Re, 21.60.Cs, 23.20.Lv, 27.30.+tNuclei are among the few quantum systems that can be described meaningfully in terms of shape. Understanding the known shapes and the search for exotic shapes has long been a research forefront in nuclear structure physics [1]. One example is the study of superdeformed (SD) shapes and the associated collective rotational bands [2], which have been identified experimentally in various mass regions of the nuclear chart [3]. It has been suggested that the high-spin behavior of an SD band is often strongly influenced by the high- intruder orbits because of the unique properties exhibited by these orbits with rotation. For example, variations in the SD yrast band structure in the mass-190 region are characterized by competition between rotational alignment of a pair of quasi-protons from the orbit and a pair of quasi-neutrons from the orbit [4]. As another example, the rotational alignment of the quasi-proton and quasi-neutron pairs dominates the high-spin behavior of SD nuclei in the mass-60 region [5]. These examples demonstrate that by studying high-spin states of SD bands one can gain microscopic insights into the role and nature of the high- intruder orbits. This is very useful information, particularly for those exotic mass regions for which the single-particle structure is less well known.
A few nuclei in the mass-40 region (36Ar [7], 40Ca [11], and 44Ti [12]) have been found to exhibit superdeformed structure. Ideguchi et al. [6] used the 26Mg(18O, 2p2n)40Ar reaction to establish to higher spin a rotational band in 40Ar and to show that it has an unusually large transition quadrupole moment eb. The lower-spin states of the 40Ar SD band were known previously along with some limited electric quadrupole transition information [10], but the Ideguchi et al. measurement of such a large value indicates clearly that this is a SD band, and the extension to high spins allows one to study excitations of the high- particles in the superdeformed well where rotation alignment of these particles takes place. The observed high-spin behavior in this 40Ar SD band clearly differs from that of the SD band in the isotope 36Ar [7, 8, 9], suggesting that the addition of four neutrons to 36Ar has significant impact in the SD structure. In addition, as pointed out in Ref. [6], 40Ar is an isotone of 34Mg, which was found to have a SD ground state [13] and is one of only a few nuclei lying in the suggested “island of inversion” [14].
It is remarkable that quantum shell effects can stabilize a superdeformed shape in nuclei having such a small number of particles. This has been interpreted according to two ideas: (i) multiparticle–multihole (mp–mh) excitation from the sd to fp shell, and (ii) emergence of the SD shell gaps at , 20, and 22. The structure of the SD band in 40Ar was studied using cranked Hartree–Fock–Bogoliubov (CHFB) theory in Ref. [6]. These calculations reproduced reasonably well the energy levels of the SD band, and the analysis showed that this band corresponds to a mp–mh excitation across the sd–fp shell gap. Electromagnetic transition properties were not discussed. The CHFB is a mean-field approximation and the discussion and conclusions were obtained within a cranked intrinsic framework. This CHFB analysis [6] suggested that a simultaneous alignment of the protons and neutrons that is central to explaining the 36Ar SD structure [9] does not occur in 40Ar, that the 40Ar SD band is associated with an axially deformed shape, and that its triaxiality is very small ( 0) for the entire angular-momentum range.
In contrast to Ref. [6], Taniguchi et al. [15] proposed that the observed SD band in 40Ar could be interpreted as resulting from triaxial superdeformation. Their analysis used an antisymmetrized molecular dynamics plus generator coordinate method (AFT+GCM), which includes effects beyond those for typical mean fields. However, the AFT+GCM calculations were able to describe the observed data for energy levels and values at only a qualitative level, and the triaxiality found was not large (). To summarize, the mean-field CHFB calculation [6], which reproduces data well, suggests an axially-symmetric superdeformed shape for the observed SD band in 40Ar, while the AMD+GCM approach [15], which includes more many-body correlations but does not describe the 40Ar data as well, suggests a SD band built on a triaxially-deformed shape. It would be desirable to understand and resolve these different interpretations for the observed SD band in 40Ar.
Understanding the detailed structure of 40Ar could also benefit other studies. For example, properties of excited states in 40Ar are of astrophysical importance because neutrino-induced reactions on 40Ar are used to detect the solar neutrino emitted from 8B in the Sun through the liquid argon time projection chamber (LArTPC) in ICARUS (Imaging of Cosmic and Rare Underground Signals) [16]. It was pointed out in Ref. [17] that it is possible for the SD state in this nucleus to accommodate an particle to form an hypernucleus.
The projected shell model (PSM) [22] was applied to analyze the structure of the earliest known SD bands [23]. In Ref. [9], some of the present authors applied the PSM to study the SD band in the nucleus 36Ar [7, 8], and interpreted the band disturbance around as a consequence of the simultaneous alignment of the quasi-proton and neutron pairs, which was later supported by other studies [18, 19, 20, 21]. In the present Letter, we analyze the SD band in 40Ar using the PSM.
The PSM [22] is a shell model truncated in the deformed Nilsson single-particle basis, with pairing correlation incorporated into the basis by a BCS calculation for the Nilsson states. The shell-model truncation is first implemented in the multi-quasiparticle (qp) basis with respect to the deformed BCS vacuum , then the basis states are transformed from the intrinsic to the laboratory frame by angular momentum projection [22], and finally a two-body shell model Hamiltonian is diagonalized in this projected space. Unlike the CHFB, the PSM goes beyond mean-field by transforming the basis from the intrinsic to the laboratory frame and performing configuration mixing. The PSM treatment is distinguished from the AMD+GCM approach by explicit inclusion of mp–mh (multi-qp) configurations in the diagonalization. These are helpful ingredients in the investigation of the current problem and in resolving present conflicting interpretations of the 40Ar SD structure.
The PSM wavefunction is a superposition of angular-momentum-projected, multi-qp states that span the shell model space
| (1) |
where
is the angular momentum projector [22]. In Eq. (1), denotes the qp-basis, labels the basis states, and are determined by the configuration mixing implemented by diagonalization. In the present work, the deformed single-particle basis is generated with a quadrupole deformation parameter , which is consistent with the experimental deformation [6] for this SD band. The single-particle basis is taken to be axially symmetric but asymmetry can enter the solutions through configuration mixing, as we shall discuss later. Particles in three major shells ( for both neutrons and protons) are activated to define the valence space. The multi-qp basis (including up to 4-qp states) is taken as
| (2) |
where is the qp vacuum and and the qp creation operators. The index () denotes the neutron (proton) Nilsson quantum numbers, which run over the orbitals close to the Fermi levels.
Similar to the HFB theory in Ref. [6], we employ a quadrupole plus pairing Hamiltonian that includes monopole and quadrupole pairing terms,
| (3) |
In Eq. (3), is the spherical single-particle Hamiltonian, which contains a proper spin-orbit force [24]. The monopole pairing strength is taken to be and the quadrupole pairing strength is taken to be .
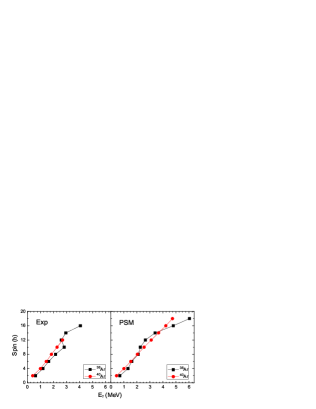
The PSM calculation for the SD band in 40Ar is presented in the form of a ‘backbending plot’ and compared with experimental data [6] in Fig. 1. To emphasize the differences in rotational behavior between 40Ar and 36Ar, we include also the previous PSM results for 36Ar taken from Ref. [9]. The slope of the curves denotes the kinematic moment of inertia, a characteristic quantity for the description of rotational behavior. It can be seen that at low spins the behavior of 40Ar is similar to that of 36Ar. However, in the spin range around the two nuclei behave differently. For 40Ar, both experiment and calculation show approximately a linear relation between the rotational frequency (-ray energy) and angular momentum, indicating that the superdeformed 40Ar has nearly a constant moment of inertia throughout the entire spin range. In contrast, a band disturbance around is apparent in 36Ar, implying a varying moment of inertia.
Various model calculations [7, 9, 18, 20, 21, 25, 26] interpreted the backbending in moment of inertia for the nucleus 36Ar as being due to a simultaneous alignment of protons and neutrons in the orbital. The different rotational behavior for the two isotopes was attributed to different occupation of the neutron orbit in Ref. [6]. With four more neutrons in 40Ar than in 36Ar, neutron occupation of the and 5/2 levels of in 40Ar but not in 36Ar is the main source of this difference.
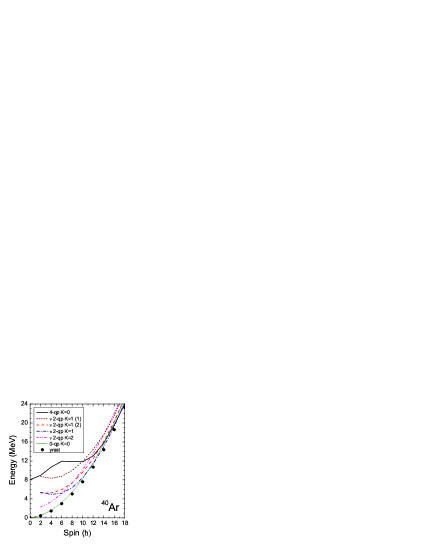
The most striking feature of the 40Ar SD band is the nearly linear dependence of on rotation. For this spin range, rotation alignment of particles from particular orbits can occur; this usually results in a clear disturbance of regular rotational sequences, as is seen in 36Ar. However, this seems not to happen in 40Ar up to the highest spin measured or calculated. To understand this, we have studied the band structures by using the band diagram shown in Fig. 2. At deformation single-particle orbitals near the neutron and proton Fermi levels of 40Ar are: , , and of , and of , and of . Thus, multi-qp configurations based on combinations of these orbitals lie low in energy. To illustrate their rotational behavior, six representative bands are displayed in Fig. 2: one 0-qp band (ground band), three neutron 2-qp bands, one proton 2-qp band, and one neutron–proton 4-qp band. The dots marked “yrast” represent the lowest-energy states obtained at each spin after band mixing, which were used in Fig. 1 to compare with the data.
The neutron 2-qp band with the configuration originating from starts with a low energy at about 2.2 MeV. However, its rotational behavior is very similar to the g-band. As can be seen in Fig. 2, for the whole spin range this band stays nearly parallel to the g-band and hence is physically unimportant for yrast structure changes. On the other hand, there are two other 2-qp bands in Fig. 2 beginning at much higher excitation energies (5.4 MeV). The proton 2-qp one (labeled 2-qp in Fig. 2) with the configuration shows a unique rotational behavior. As spin increases, the energy initially decreases but then begins increasing around spin . This behavior has its origin in the spin alignment of a decoupled band, as discussed in Ref. [22]. Because of this, it can cross the g-band at and become the most important configuration over the spin interval . The other neutron 2-qp band (labeled 2-qp in Fig. 2), with a configuration coming from , lies higher by several hundred keV and therefore influences the yrast states much less. Note that the neutron 2-qp band (marked as 2-qp in Fig. 2), with the configuration from , is found to be roughly 4 MeV above the yrast band. In 36Ar, this neutron configuration nearly coincides with the same configuration for protons and both cross the g-band at the same spin, leading to a simultaneous alignment of neutrons and protons [9]. Thus it is clear that the addition of four neutrons in 40Ar shifts the neutron Fermi level up relative to that for 36Ar, which results in a much higher-lying configuration 2-qp in 40Ar. This is the physical reason for the difference in rotational behavior for the 40Ar and 36Ar SD yrast bands.
The 4-qp band (black solid line in Fig. 2) consists of the two 2-qp bands mentioned above ( 2-qp and 2-qp ). It crosses the 2-qp bands at high spins () and becomes the lowest band in energy thereafter. The crossing between this 4-qp band and the 2-qp bands is gentle with a very small crossing angle. In fact, in the high-spin region after all the low-lying bands in Fig. 2 (0-qp g-band, 2-qp and 4-qp bands) are seen to be bunched together and they rotate with the same frequency (given by the slope of the curves in Fig. 2). Therefore, their successive mutual band crossings do not perturb the yrast-band rotation significantly. This explains the nearly-linear dependence of the transition energy on angular momentum as seen in Fig. 1, which is in contrast to that in the 36Ar case. Although no disturbance in the yrast energy levels is evident for 40Ar, the corresponding yrast wave functions at high spins are mixed with the multi-qp configurations, which may lead to observable effects in other quantities such as moments of inertia and electromagnetic properties; we shall discuss such effects below.
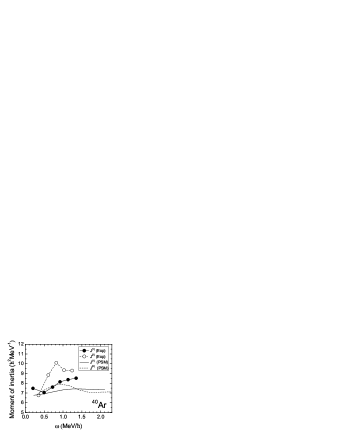
Experimental [6] and calculated PSM kinematical moments of inertia = and dynamical moments of inertia = for 40Ar are shown in Fig. 3 as functions of rotational frequency , where is the transition energy. The experimental increases with rotation while the more sensitive quantity shows first a more rapid climb and then a sudden drop at 1.0 MeV corresponding to spin . The peak in suggests a structure change along the SD yrast band. These features are qualitatively reproduced by the PSM; it nevertheless underestimates the changes. The drop in was interpreted in Ref. [6] as occurring because of the disappearance of the pairing gap energy. In our model, it is due to the first band-crossing of the proton 2-qp band with the g-band, as discussed in Fig. 2. Physically, it corresponds to the rotation alignment of a pair of protons. It is important to distinguish the situation found here with the simultaneous alignment of both proton and neutrons pairs found in 36Ar, which causes a backbending in the moment of inertia [7].
The preceding conclusion for dominance of proton alignment may be examined experimentally using -factor measurements. In the PSM, -factors can be computed directly as
| (4) |
with being the magnetic moment of a state , and
| (5) | |||||
where and for protons and neutrons, respectively. The following standard values for and appearing in Eq. (5) are taken:
and and are damped by a usual 0.75 factor from the free-nucleon values. Because of the intrinsically opposite signs of the neutron and proton , variation of -factors often is a clear indicator for a single-particle component that strongly influences the total wave function.
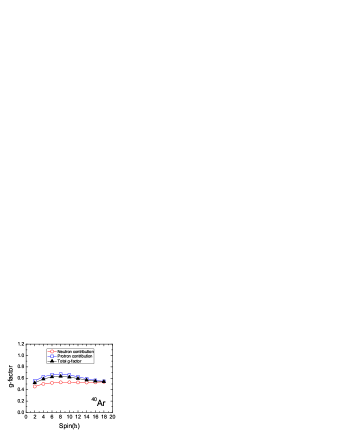
The calculated total -factors displayed in Fig. 4 (filled triangles) suggest non-constant -factors as spin changes, with largest values appearing around . An increase in -factor may be attributed to the increased proton component in the wave functions. To see this more clearly, we plot also in Fig. 4 curves for the separate contributions to the total -factor from neutron (open circles) and proton (open squares) qp’s. This is done by eliminating the proton (neutron) qp states in (2) in the calculation for neutron (proton) contribution. It is clear that the shape of the total -factor curve is dominated by the contributions from proton qp states. This reinforces our conclusion that the variation in is caused by a breaking and spin alignment of the proton pairs, which contribute the proton components to the total wave functions. -factors of the state at 1461 keV in 40Ar and those in some nearby nuclei have been measured [28, 29, 30]. We hope that the predicted -factors for the SD states in 40Ar can be verified in the future.
Electric quadrupole transition probabilities or transition quadrupole moment depend strongly on nuclear shapes. They are related by
| (6) |
where is a Clebsch–Gordan coefficient and the value for a transition from an initial state of angular momentum to a final state having is given by
| (7) |
with the wavefunctions being those in Eq. (1). The effective charges used in the calculation are the standard ones and .
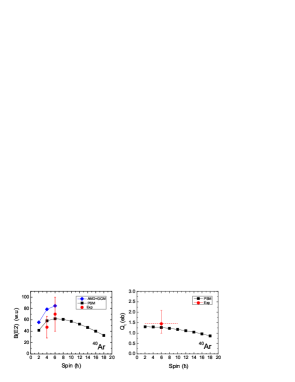
The calculated spin-dependent and values for the SD band in 40Ar are shown in Fig. 5. The known experimental values for the and transitions [10] are plotted for comparison. It can be seen from the left plot of Fig. 5 that the PSM calculation reproduces the experimental data nicely, though experimental uncertainties are large. Our calculation predicts the unmeasured low-spin and high-spin transition probabilities, which may be tested by future experiments. On the other hand, the values calculated with the AMD+GCM [15] approach have the right trend but are too large relative to the data; in particular the AMD+GCM is well out of the range of the data’s error bars. We found that the band-crossings do not cause drastic changes in the PSM values, consistent with the finding that the transition energies are a linear function of spin. However, the PSM calculation shows that values decrease smoothly after spin , with the at being only about 2/3 of that at . The PSM calculations thus suggest a decreasing electric quadrupole collectivity with increased spin that is caused by successive pair breaking and alignment of particles, but considerable collectivity remains still at the highest spin states calculated.
As shown in the right plot of Fig. 5, our PSM calculation also predicts large transitional quadrupole moments, consistent with the experimental data. The measured value eb [6] is effectively averaged over the spin interval . As for the values, the calculated ’s show a smoothly decreasing trend towards high spins. Let us now consider whether the reduction in or with increasing angular momentum is related to triaxiality in the SD band.
Taniguchi et al. [15] proposed a non-axial superdeformation picture and concluded that triaxiality is significant for understanding the low-lying states of the SD band in 40Ar. This contradicts the conclusion of Ideguchi et al. [6] that axial deformations are sufficient to understand these states. A model comparison for energy levels is generally not sufficient to identify triaxiality and one requires more detailed information. In Ref. [31], Ring et al. suggested using two measurable quantities, electric quadrupole transition probabilities and spectroscopic moments , to extract the two intrinsic deformations and using the relations
| (8) |
where is the ratio of the (spin-dependent) deformation parameter to the corresponding value for a symmetric rotor and the spectroscopic moment is defined through the quadrupole matrix element
| (9) |
The model basis for the PSM is axially-symmetric but configuration mixing among multi-qp states can generate triaxiality. Thus deviation from exact axial symmetry should be reflected in the wave functions for PSM solutions, leading to a non-zero extracted from Eqs. (Superdeformed band in the nucleus 40Ar: A projected shell model analysis)–(9). To use these equations to determine deformation parameters we have calculated in addition to using the PSM.
| Spin | 4 | 6 | 8 | 10 | 12 | 14 | 16 | 18 |
|---|---|---|---|---|---|---|---|---|
| 4.4 | 5.6 | 5.9 | 5.7 | 5.3 | 4.7 | 3.7 | 2.4 |
The values of the spin-dependent triaxiality parameter obtained from this analysis are listed in Table I. One sees that non-zero triaxiality is indeed found in our calculation; however, the deduced values are very small.
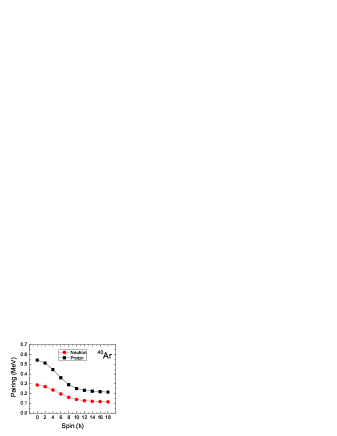
In Ref. [20], Oi pointed out that in the CHFB calculation pairing correlations tend to suppress triaxial deformation. Without pairing, triaxial deformation would be enhanced and ultimately emerge at high spins. Pairing correlation is taken into account explicitly in the PSM. In Fig. 6, we show the calculated pairing gaps, computed using expectation values of the pair operator with respect to the PSM wave functions. It is found that for 40Ar, neutron and proton pairing gaps are not small; for example 1 MeV at . However, the pairing gaps decrease as the nucleus rotates, saturating eventually at smaller but non-zero values for high spins. For the high-spin states, the remaining pairing correlation is relatively weak but still may play a role in sustaining collectivity so that the triaxiality is suppressed to , as suggested in Ref. [20]. Thus we conclude that 40Ar has a nearly axially-symmetric shape and triaxiality is not very important for the SD states in this nucleus.
To summarize, experimental data for the SD rotational band in 40Ar [6] have provided a valuable example that allows studying the stabilization of a superdeformed minimum in light nuclei. For this nucleus, there has been a debate about whether it has an axially or triaxially deformed shape [15]. The present study has applied the projected shell model that was used before in the calculation of SD bands in this mass region [9]. Our results have shown a good reproduction of the newer experimental data and explained the rotational behavior of the SD band as successive band crossings of the 0-, 2-, and 4-qp configurations. Calculated -factors have been presented to support the importance of proton alignment in the wave functions. The calculated electric quadrupole transition probabilities reproduce well the known experimental data, and suggest a reduced but still significant collectivity in the high spin-region. Triaxial deformation parameters have been deduced from the calculated and spectroscopic quadrupole moment , both of which are experimentally measurable. The triaxial deformation parameter has been found to average only a few degrees throughout the SD band, suggesting that triaxiality is unlikely to be an important factor in understanding superdeformation in 40Ar.
Research at SJTU was supported by the National Natural Science Foundation of China (No. 11135005), by the 973 Program of China (No. 2013CB834401), and by the Open Project Program of the State Key Laboratory of Theoretical Physics, Institute of Theoretical Physics, Chinese Academy of Sciences, China (No. Y5KF141CJ1).
References
- [1] S. Frauendorf, Rev. Mod. Phys. 73 (2001) 463.
- [2] P. J. Nolan and P. J. Twin, Ann. Rev. Nucl. Part. Sci., 38 (1998) 533.
- [3] X.-L. Han and C.-L. Wu, At. Data Nucl. Data Tables 73 (1999) 43.
- [4] Y. Sun, J.-y. Zhang, M. Guidry, Phys. Rev. Lett. 78 (1997) 2321.
- [5] Y. Sun, J.-y. Zhang, M. Guidry, C.-L. Wu, Phys. Rev. Lett. 83 (1999) 686.
- [6] E. Ideguchi, et al., Phys. Lett. B 686 (2010) 18.
- [7] C. E. Svensson, et al., Phys. Rev. Lett. 85 (2000) 2693.
- [8] C. E. Svensson, et al., Phys. Rev. C 63 (2001) 061301(R).
- [9] G.-L. Long and Y. Sun, Phys. Rev. C 63 (2001) 021305(R).
- [10] J. A. Cameron and B. Singh, Nucl. Data Sheets 102 (2004) 293.
- [11] E. Ideguchi, et al., Phys. Rev. Lett. 87 (2001) 222501.
- [12] C. D. O‘Leary, et al., Phys. Rev. C 61 (2000) 064314.
- [13] H. Iwasaki, et al., Phys. Lett. B 522 (2001) 227.
- [14] E. K. Warburton, J. A. Becker, B. A. Brown, Phys. Rev. C 41 (1990) 1147.
- [15] Y. Taniguchi, et al., Phys. Rev. C 82 (2010) 011302(R).
- [16] A. Rubbia, Nucl. Phys. B 66 (1998) 436.
- [17] B.-N. Niu, E. Hiyama, H. Sagawa, and S.-G. Zhou, Phys. Rev. C 89 (2014) 044307.
- [18] T. Inakura, et al., Nucl. Phys. A 710 (2002) 261.
- [19] A. Poves, Nucl. Phys. A 731 (2004) 339.
- [20] M. Oi, Phys. Rev. C 76 (2007) 044308.
- [21] M. Bender, H. Flocard, P.-H. Heenen, Phys. Rev. C 68 (2003) 044321.
- [22] K. Hara, Y. Sun, Int. J. Mod. Phys. E 4 (1995) 637.
- [23] Y. Sun and M. Guidry, Phys. Rev. C52 (1995) R2844.
- [24] T. Bengtsson and I. Ragnarsson, Nucl. Phys. A 436 (1985) 14.
- [25] E. Caurier, et al., Phys. Rev. Lett. 95 (2005) 042502.
- [26] E. Caurier, et al., Phys. Rev. C 75 (2007) 054317.
- [27] K. Hara, Y. Sun, T. Mizusaki, Phys. Rev. Lett. 83 (1999) 1922.
- [28] E. A. Stefanova, et al., Phys. Rev. C 72 (2005) 014309.
- [29] A. E. Stuchbery, et al., Phys. Rev. C 74 (2006) 054307.
- [30] K. H. Speidel, et al., Phys. Rev. C 78 (2008) 017304.
- [31] P. Ring, A. Hayashi, K. Hara, H. Emling, E. Grosse, Phys. Lett. 110B (1982) 423.