Search for Galactic dark matter substructures with Cherenkov telescopes
Abstract:
Weakly interacting massive dark matter (DM) particles are expected to self-annihilate or decay, generating high-energy photons in these processes. This establishes the possibility for indirect detection of DM by -ray telescopes. For probing the secondary products of DM, accurate knowledge about the DM density distribution in potential astrophysical targets is crucial. In this contribution, the prospects for the detection of subhalos in the Galactic DM halo with present and future imaging atmospheric Cherenkov telescopes (IACT) are investigated. The source count distribution and angular power spectra for -rays originating from annihilating DM in subhalos are calculated from N-body simulation results. To study the systematic uncertainties coming from the modeling of the DM density distribution, parameters describing the -ray yield from subhalos are varied in benchmark models. We conclude that Galactic subhalos of annihilating DM are probably too faint to be a promising target for IACT observations, even with the prospective Cherenkov Telescope Array (CTA).
1 Introduction
Revealing the nature of dark matter (DM) constitutes one of the most challenging tasks for astrophysics and cosmology. The most promising candidate to explain the numerous observational evidence for DM is a non standard model weakly interacting massive particle (WIMP), which self-annihilates into standard model particles [1]. As the WIMP mass is expected to be in the range of GeV to TeV, it is supposed to produce secondary -rays in the same energy regime. This opens the window for an indirect detection of DM by -ray telescopes. Various techniques exist for the detection of astrophysical -rays. This contribution is focused on imaging atmospheric Cherenkov telescopes (IACT), in particular the prospective Cherenkov Telescope Array (CTA) [2].
So far, no clear evidence for particle DM, neither direct nor indirect, has been found. Several targets have been considered for the indirect detection of DM, among them the Galactic center, neighboring dwarf spheroidal galaxies (dSphG), and galaxy clusters [3]. Extensive numerical simulations in the framework of CDM cosmology have shown that DM is also expected to form density structures on sub-galactic scales [4, 5]. Such subhalos in our Galaxy may constitute an interesting additional target for indirect DM searches. First, they are expected to lack of any contaminating non-DM -ray emission, resulting into a signal-to-noise ratio comparable or better than for the dSphG observations. Second, as the flux of secondary -rays is expected to be proportional to the DM density squared, DM subhalos may cause a comparably high small-scale fluctuation of the isotropic -ray background (IGRB), detectable and distinguishable from other sources [6].
Many studies have been performed to assess the -ray fluxes from Galactic DM subhalos, by using the results of numerical simulations, e.g., [7, 8]. However, uncertainties about the spatial component of the signal, the astrophysical -factor, still remain. The resolution of numerical N-body simulations is limited to larger subhalo masses than relevant for a detectable signal. Therefore, extensive extrapolations and model assumptions have to be applied over many orders of magnitude. In this contribution, these model systematic uncertainties are studied with the new version of the semi-analytic code clumpy [9, 10]. Four different N-body simulation fit results and extrapolations are varied, and an uncertainty band is derived for the -factors and the fluctuations in the IGRB from DM subhalos in the Milky Way.
2 rays from Galactic dark matter subhalos
The -ray flux from annihilating dark matter at redshift can be expressed as
| (1) |
where is the dark matter particle’s mass, the velocity-averaged annihilation cross section, is the branching ratio for annihilation channel , and the final-state -ray spectrum in this channel. The second term, the -factor, , is the integral of the squared DM density, , over the line of sight, , and , the solid angle over the instrument’s aperture radius, . The flux is proportional to , which is independent of any particle physics model. Therefore, in the following all quantities are expressed in terms of instead of .
The mean density of the total Galactic DM host halo is modeled by an Einasto profile,
| (2) |
on the basis of a best fit to the Aquarius simulations presented in [8], with the scale radius and . The parameter is a measure of the steepness of the density profile close to , with the distance from the halo center. Motivated by recent astronomical measurements [11], the halo is normalized by a local dark matter density of at . For a virial radius of of the host halo, this results in a total halo mass of . This mass is in agreement with observations of stellar tracers [11] and is used in the following.
The simulations indicate that the distribution of subhalos in the host halo follows an anti-biased distribution with respect to the unclustered, smooth DM distribution [4, 5]. This implies that most of the clustered mass is located in the outer parts of the host halo. For the model variation, two parametrizations of the substructure distribution within the host halo are compared: The Aquarius-simulation [4] suggests an Einasto profile for the subclustered mass with and (model EINASTO). The Via-Lactea II subhalos [5] are described by a slightly less anti-biased distribution, modeled by the number distribution given in [12] (model MADAU). All subhalos are described by an Einasto profile with the same as for the total halo.
The presence of subhalos with masses in the range is assumed [13]111 Subhalos are drawn by clumpy down to a user-defined accuracy in terms of the -factor contribution from subhalos compared to the background emission from the unclustered “smooth” DM in the halo. For all models, all subhalos yielding are correctly simulated in this study. . The simulations [4, 5] indicate a power-law function of the subhalo distribution, with an index for the resolved subhalos with masses . The extrapolation of down to the lowest subhalo masses is very sensitive to . Therefore, the results for the two indices and are compared. A fixed number of massive dSphG-like subhalos in the mass range is supposed, in agreement with [4].
An important property of a subhalo is the concentration , which connects its scale radius with its virial size as a function of its mass . As the annihilation -ray emission is proportional to the density squared, a higher concentration significantly boosts the brightness of a subhalo. The rather optimistic (highly concentrated) model from [14] (model BULLOCK) is compared to the conservative one (flatter subhalo concentrations) from [13] (model SANCHEZ). Finally, the authors of [14] find a significant log-norm scattering around the mean concentrations , which also results into a net boost of the signal. Their result for hosted subhalos, , is compared to a more conservative assumption of .
From the two values for each of the four varied quantities, benchmark models are created, listed in Tab. 1. Model is chosen to be the reference model with an average flux yield.
| Model | 1 | 2 | 3 | 4 | 5 | 6 | 7 | 8 | 9 | 10 | 11 | 12 | 13 | 14 | 15 | 16 |
|---|---|---|---|---|---|---|---|---|---|---|---|---|---|---|---|---|
| M | E | M | E | M | E | M | E | M | E | M | E | M | E | M | E | |
| 1.9 | 1.9 | 2.0 | 2.0 | 1.9 | 1.9 | 2.0 | 2.0 | 1.9 | 1.9 | 2.0 | 2.0 | 1.9 | 1.9 | 2.0 | 2.0 | |
| S | S | S | S | B | B | B | B | S | S | S | S | B | B | B | B | |
| 0.14 | 0.14 | 0.14 | 0.14 | 0.14 | 0.14 | 0.14 | 0.14 | 0.24 | 0.24 | 0.24 | 0.24 | 0.24 | 0.24 | 0.24 | 0.24 | |
| 2.05 | 2.06 | 2.15 | 2.15 | 2.03 | 2.02 | 2.12 | 2.13 | 2.04 | 2.05 | 2.14 | 2.15 | 2.03 | 2.04 | 2.09 | 2.12 |
3 Setup of the simulations
The Galactic DM halo is simulated for a circular field of view (FOV) centered at the Galactic pole with diameter . This FOV covers a fraction of the sky. The choice of the FOV is motivated by the projected extragalactic sky survey achievable with CTA [15], an area where it can be searched also for Galactic DM subhalos. To take into account the statistical variation of the observed sky in terms of cosmic variance, each simulation is rerun times. In the same way, the search for DM subhalos within a single FOV of is investigated, using a separate simulation.
4 Results
In Fig. 4, the average integrated source count distribution is shown, defined as
| (3) |
Here, represents the number of subhalos on the chosen patch of the sky brighter than a given -factor. The DM subhalo source count distribution can be described by a power-law according to in the regime . In Tab. 1, the fit results of the exponent are listed for each of the models. These results indicate that the distribution is dominantly determined by the mass distribution .
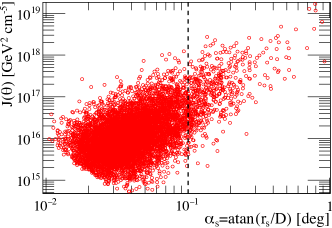
The integration angle, within which the -factor of each subhalo is calculated, is set to to illustrate the power-law behavior of the source count distribution. In Fig. 1, it is shown for model 9 that the largest part of most of the subhalos is encompassed within . Similar results are obtained for all models. As the annihilation -ray emission is strongly peaked at the subhalo center, only the signal of the most extended subhalos gets significantly truncated by . Fig. 1 suggests a correlation between the apparent size and the brightness of the subhalos. Therefore, a cut-off of the power-law distribution at high is visible in Fig. 4. Continuous emission from the unclustered DM (“smooth halo”) and other background decreases proportional to , faster than the subhalos’ flux [16]. Consequently, a smaller signal region might
improve the signal-to-noise ratio in a real experiment.
Only a slight correlation between the subhalo masses and their -factors has been found for all models (not shown). From this follows that distant massive dSphG-like subhalos and nearby low-mass subhalos similarly account for the highest -factors.
For a given DM annihilation channel, cross section and particle mass, the fluxes corresponding to the -factors are plotted in Fig. 4. For the annihilation channel , CTA will be most sensitive to a DM particle mass of [17]. For this mass range, the annihilation cross section is already constrained to by observations of the dSphGs by the Fermi-LAT instrument [18]. Thus, in the range of the considered models and a coverage of , a survey sensitivity to some of the Crab Nebula flux is necessary to discover at least one subhalo above with IACTs, provided that .
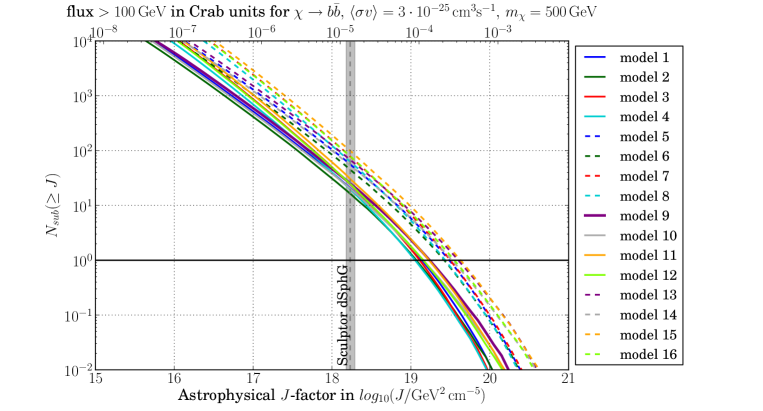
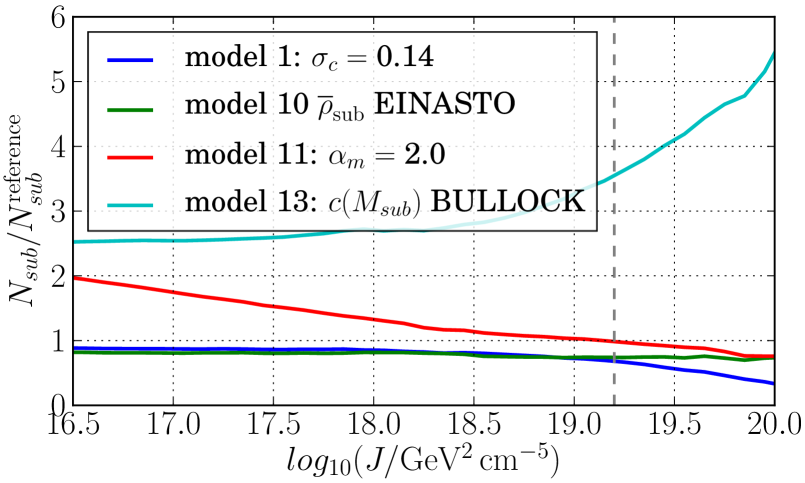
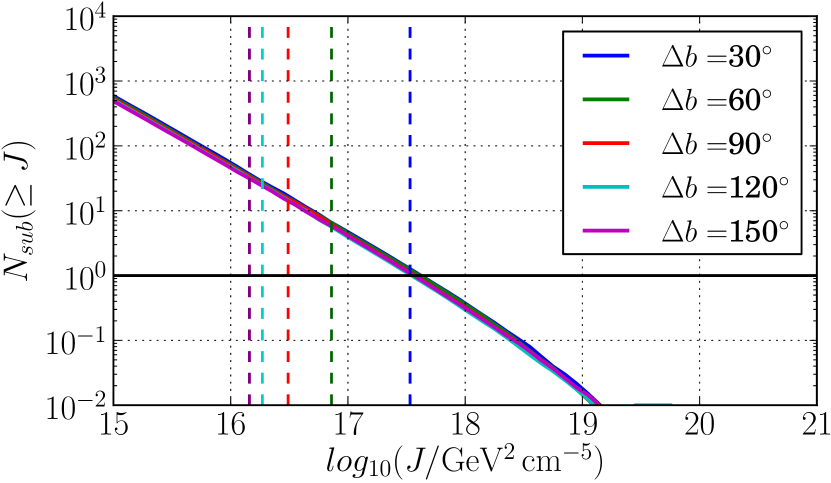
Fig. 4 shows the impact of the varied parameters on compared to the reference model. For the brightest subhalos, the model uncertainty is generally . An exception from this occurs when switching from the SANCHEZ to the BULLOCK concentration model for . In this case, the number of brightest subhalos is increased by more than a factor of three.
Fig. 4 shows the simulation results for within a single CTA-like FOV of . Here, is given for different distances from the Galactic center, perpendicular to the Galactic plane. Two conclusions can be drawn from this. First, Fig. 4 indicates that at , the subhalos appear almost isotropically in the sky. Consequently, the relation holds for arbitrary positions in the sky (and is confirmed by comparing Fig. 4 and 4). However, pointing close to the Galactic center heavily decreases the contrast between the subhalos and the smooth DM halo emission, the latter indicated by the dashed lines. Second, a sensitivity to -factors of is needed to resolve at least one subhalo within a given single FOV. Such -factors are about a factor 10 smaller than those of the most promising dSphGs, where observation times of are expected to reach competitive limits with CTA [17].
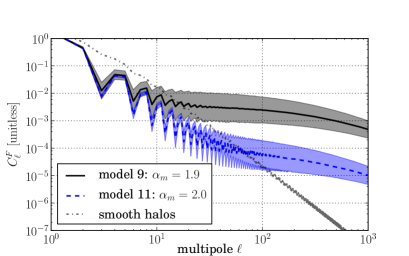
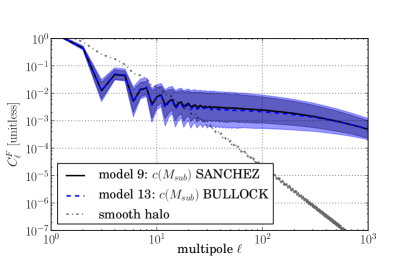
In Fig. 5, the fluctuation angular power spectra (fluctuation APS) of the subhalos are shown, comparing two of the four varied parameters against the reference model. The fluctuation APS is a measure of the relative fluctuation, or small scale anisotropy, of a signal, which can be possibly detected above a much larger background holding less fluctuation. The fluctuation APS of a map , defined on a patch of the sphere ( elsewhere) is given by
| (4) |
with the spherical coordinates and , and the mean value of on the defined domain. The are the coefficients of the map decomposed into spherical harmonics ,
| (5) |
For Fig. 5, an integration angle is chosen, which corresponds to half the value of the maximum resolution projected for CTA at energies above [15].
For a FOV with diameter and an angular resolution of [15], CTA could be sensitive to multipoles [6]. As shown in Fig. 5, in this regime, the fluctuation APS remains largely constant for all models, with only a mild lowering of the amplitudes towards higher multipoles. Only in the case of the variation of from to , a drastic change for the fluctuation APS results. This is shown in Fig. 5 (left). For , a substantially higher amount of total mass is bound into subhalos. Although this results into a boost of the overall signal, the effective fluctuation heavily decreases because of the large background of the low-mass subhalos. For all other cases, the fluctuations of the subhalos remain largely the same. This applies even for the significant signal boost for the BULLOCK case, which is shown in Fig. 5 (right).
5 Conclusions
Different models of the abundance and properties of Galactic DM subhalos have been compared. Within the varied parameters, the source count distribution of these subhalos has been constrained to an uncertainty band of one order of magnitude. The modeling of the inner concentration causes the biggest systematic uncertainty in the number of detectable subhalos. The subhalos appear nearly isotropically distributed in the sky, allowing a telescope to point as far as possible away from the Galactic plane to reduce the background from the smooth DM halo emission and diffuse astrophysical foregrounds.
However, for all benchmark models, Galactic subhalos are probably too faint to be a promising target for current and next-generation IACTs, provided the projected available observation times. Still for a sensitivity to a fraction of of the Crab Nebula flux above , a detection of individual subhalos might be possible only for cross sections , which are already in tension with recent measurements. Pointed observations of the Galactic center and the dSphGs with CTA promise competitive limits on the annihilation cross section, probably requiring much less observation time.
At the same time, it has been shown that a source count distribution with results in a fluctuation APS up to the order of in the multipole range of interest of Cherenkov telescopes. In principle, such a comparably high fluctuation might distinguish dark matter from other, more dominant unresolved source classes. Possibly, even more competitive limits on the annihilation cross section can be obtained than by the search for individual subhalos [6]. However, given the low intensity of the overall signal from Galactic DM subhalos, these limits are most likely still not competitive with those obtainable from (combined) pointed observations.
We did not assess the extragalactic contribution to DM induced fluctuations of the IGRB. However, the results of [8] indicate that the extragalactic emission is expected to be similar to the Galactic signal in magnitude and in angular scales, suggesting a similar sensitivity to IGRB fluctuations as for the Galactic subhalo case. Still, it should be emphasized that all indirect DM targets suffer from major systematic uncertainties. With this in mind, the search for fluctuations in the IGRB should not be neglected as a complementary strategy to unveil the nature of DM.
Acknowledgments
This work is supported by the Research Training Group 1504 of the German Research Foundation (DFG) and a travel grant by the German Academic Exchange Service (DAAD). Some of the results in this contribution have been derived using the HEALPix package (Górski et al., 2005).
References
- [1] L. Bergström, Dark matter candidates, New Journal of Physics 11 (2009) [arXiv:0903.4849].
- [2] B. Acharya et al., Introducing the CTA concept, Astroparticle Physics 43 (2013) 3–18.
- [3] J. Conrad et al., WIMP searches with gamma rays in the Fermi era: challenges, methods and results, Invited review for Journal of Experimental and Theoretical Physics (2015) [arXiv:1503.6348].
- [4] V. Springel et al., The Aquarius Project: the subhaloes of galactic haloes, Monthly Notices of the Royal Astronomical Society 391 (2008) 1685–1711, [arXiv:0809.0898].
- [5] J. Diemand et al., Clumps and streams in the local dark matter distribution, Nature 454 (2008) 735–738, [arXiv:0805.1244].
- [6] J. Ripken et al., The sensitivity of Cherenkov telescopes to dark matter and astrophysical anisotropies in the diffuse gamma-ray background, Journal of Cosmology and Astroparticle Physics 2014 (2014) [arXiv:1211.6922].
- [7] J. M. Siegal-Gaskins, Revealing dark matter substructure with anisotropies in the diffuse gamma-ray background, Journal of Cosmology and Astroparticle Physics 2008 (2008) [arXiv:0807.1328].
- [8] M. Fornasa et al., Characterization of dark-matter-induced anisotropies in the diffuse gamma-ray background, Monthly Notices of the Royal Astronomical Society 429 (2013) 1529–1553, [arXiv:1207.0502].
- [9] A. Charbonnier et al., CLUMPY: a code for gamma-ray signals from dark matter structures, Computer Physics Communications 183 (2012) [arXiv:1201.4728].
- [10] V. Bonnivard et al., CLUMPY: Jeans analysis, -ray and fluxes from dark matter (sub-)structures, 2015. arXiv:1506.7628.
- [11] J. I. Read, The local dark matter density, Journal of Physics G: Nuclear and Particle Physics 41 (2014) [arXiv:1404.1938].
- [12] P. Madau et al., Dark matter subhalos and the dwarf satellites of the Milky Way, The Astrophysical Journal 679 (2008) 1260–1271, [arXiv:0802.2265].
- [13] M. A. Sanchez-Conde et al., The flattening of the concentration-mass relation towards low halo masses and its implications for the annihilation signal boost, Monthly Notices of the Royal Astronomical Society 442 (2014) 2271–2277, [arXiv:1312.1729].
- [14] J. S. Bullock et al., Profiles of dark haloes: Evolution, scatter and environment, Monthly Notices of the Royal Astronomical Society 321 (2001) 559–575, [astro-ph/9908159].
- [15] G. Dubus et al., Surveys with the Cherenkov Telescope Array, Astroparticle Physics 43 (2013) 317–330, [arXiv:1208.5686].
- [16] V. Bonnivard et al., Dark matter annihilation and decay in dwarf spheroidal galaxies: The classical and ultrafaint dSphs, 2015. arXiv:1504.2048.
- [17] J. Carr et al., Prospects for Indirect Dark Matter Searches with the Cherenkov Telescope Array (CTA), in Proceedings of the 34th International Cosmic Ray Conference, 2015.
- [18] M. Ackermann et al., Searching for Dark Matter Annihilation from Milky Way Dwarf Spheroidal Galaxies with Six Years of Fermi-LAT Data, arXiv:1503.2641.
- [19] A. Geringer-Sameth et al., Dwarf galaxy annihilation and decay emission profiles for dark matter experiments, The Astrophysical Journal 801 (2015) [arXiv:1408.0002].