Light atom quantum oscillations in UC and US
Abstract
High energy vibrational scattering in the binary systems UC and US is measured using time-of-flight inelastic neutron scattering. A clear set of well-defined peaks equally separated in energy is observed in UC, corresponding to harmonic oscillations of the light C atoms in a cage of heavy U atoms. The scattering is much weaker in US and only a few oscillator peaks are visible. We show how the difference between the materials can be understood by considering the neutron scattering lengths and masses of the lighter atoms. Monte Carlo ray tracing is used to simulate the scattering, with near quantitative agreement with the data in UC, and some differences with US. The possibility of observing anharmonicity and anisotropy in the potentials of the light atoms is investigated in UC. Overall the observed data is well accounted for by considering each light atom as a single atom isotropic quantum harmonic oscillator.
pacs:
63.20.dd, 63.20.Pw, 78.70.NxI I. Introduction
The complex electronic structure of uranium leads to a wide variety of unusual and diverse behavior in the uranium salts UX (X = C, N, P, S, As, Se, Sb, Te, Bi), and therefore the materials in this family have been the subject of many past investigations characterizing their magnetic and vibrational properties69_kuznietz ; 74_wedgwood ; 80_buyers ; 81_buyers ; 82_holden ; 82_holden_2 ; 83_buyers ; 86_jackman ; 87_holden ; 87_hughes . The phonon spectra in the UX systems have been comprehensively studied, however there has been renewed interest in more detailed calculations of their vibrational properties as certain members of the family, including UN and UC, are under active consideration for next generation nuclear fuels09_burkes ; 11_yin ; 13_mei .
Recently, new and unexpected features were discovered in the vibrational spectrum of UN12_aczel . The same single crystal of UN studied in earlier work77_dolling ; 84_holden ; 86_jackman was re-examined via modern neutron time-of-flight (TOF) spectroscopy using the SEQUOIA06_granroth ; 10_granroth and ARCS12_abernathy spectrometers at the Spallation Neutron Source, Oak Ridge National Laboratory. Specifically strong vibrational scattering was found at energies above the usual acoustic and optic phonon branches. A series of evenly-spaced, high energy modes was observed, and detailed quantitative analysis showed that these modes could be attributed to the nitrogen atoms behaving as independent, isotropic, 3D quantum harmonic oscillators (QHOs)12_aczel ; 14_lin . Some of the features of the QHO modes, for example the intrinsic broadening, were consistent with predictions of a binary solid model83_lovesey . This model applies to systems with two different types of atoms with disparate masses and explains how the motion of the heavy atoms affects the QHO behavior of the lighter ones.
The observation of these well-defined modes at energies above the highest optic phonon in an ordered single crystal contrasts with the conventional view of vibrational response in crystalline solids. Above the highest optic phonon modes the response is usually weak and relatively featurelessdove_book . Prior to the UN discovery, exceptions to this rule were generally found in binary metallic hydrides87_ikeda ; 92_kolesnikov ; 94_kolesnikov ; 91_elsasser ; caputo_03 , for example in ZrHx systems, where hydrogen atoms occupy interstitial sites94_kolesnikov . However in those systems, the hydrogen modes usually exhibit significant anisotropic and anharmonic effects, mainly due to H-H interactions, crystalline anisotropy, and the diffusion of the H atoms87_ikeda ; 92_kolesnikov ; 94_kolesnikov ; 91_elsasser . Typically only a few modes are observed. Conversely, the nitrogen oscillations in UN show well-defined peaks up to the 10th order.
Known pre-requisite conditions for the QHO modes to be clearly observable in binary alloys include a large mass ratio between the light and heavy atoms, and weak interactions between light atoms. Although the aforementioned binary solid model provides some guidance, there is little experimental information on the dependence of this part of the vibrational response function on factors such as the mass ratio and atomic neutron cross-sections. In this work, we investigate how these factors affect the high energy vibrational scattering in UX via time-of-flight neutron spectroscopy measurements on single crystals of UC and US. For UC, we find a series of well-defined high energy vibrational modes analogous to those observed for UN. Overall these modes are described well by a QHO model for the carbon atoms. Conversely, while the US data also shows evidence for the high energy vibrational modes, only the lowest few are observed and they are much weaker in intensity compared to those seen in UC and UN. We discuss the reasons for these differences. In addition we explore the effect of multiple scattering on the observed spectrum, and the possibility of extracting information on the directional dependence and anharmonicity of the light atom potential via measurements of the QHO modes.
II II. Inelastic neutron scattering
All neutron scattering measurements reported here were collected using the SEQUOIA06_granroth ; 10_granroth and ARCS12_abernathy TOF Fermi chopper spectrometers at the Spallation Neutron Source of Oak Ridge National Laboratory. The same depleted uranium single crystals of UC and US used in previous studies were investigated in this work85_duplessis ; 71_smith . Both samples had similar total volumes on the order of 1 cm3. For the neutron scattering experiments, each single crystal was mounted in an aluminum can and loaded in a closed cycle helium refrigerator. All data were collected at 4 K, with the scattering plane horizontal. A Fermi chopper was used to obtain several different incident neutron energies, including 80 meV, 250 meV, 500 meV, 700 meV and 800 meV. The details for each chopper setting are given in Table 1. All datasets were normalized against a vanadium standard to account for variations of the detector response and the solid angle coverage. Empty can measurements were performed at 4 K and subtracted from the US datasets, however a small amount of Al that made up the sample mount was not perfectly accounted for. We discuss below the implications of this imperfect background subtraction on the scattering observed in US. A similar background subtraction was found to be unnecessary for the UC data because the intrinsic features of interest are intense.
(a) UC, = 4 K
| (meV) | 80 | 500 | 700 | 800 |
|---|---|---|---|---|
| (mm) | 1.5 | 0.5 | 0.5 | 0.5 |
| (m) | 0.58 | 1.53 | 1.53 | 1.53 |
| (Hz) | 120 | 480 | 600 | 600 |
| (Hz) | 90 | 180 | 180 | 180 |
| FWHM (meV) | 9.0 | 18.2 | 26.1 | 31.4 |
(b) US, = 4 K
| (meV) | 80 | 250 | 500 |
|---|---|---|---|
| (mm) | 3.6 | 0.5 | 0.5 |
| (m) | 1.53 | 1.53 | 1.53 |
| (Hz) | 240 | 360 | 480 |
| (Hz) | 90 | 180 | 180 |
| FWHM (meV) | 4.1 | 8.8 | 18.2 |
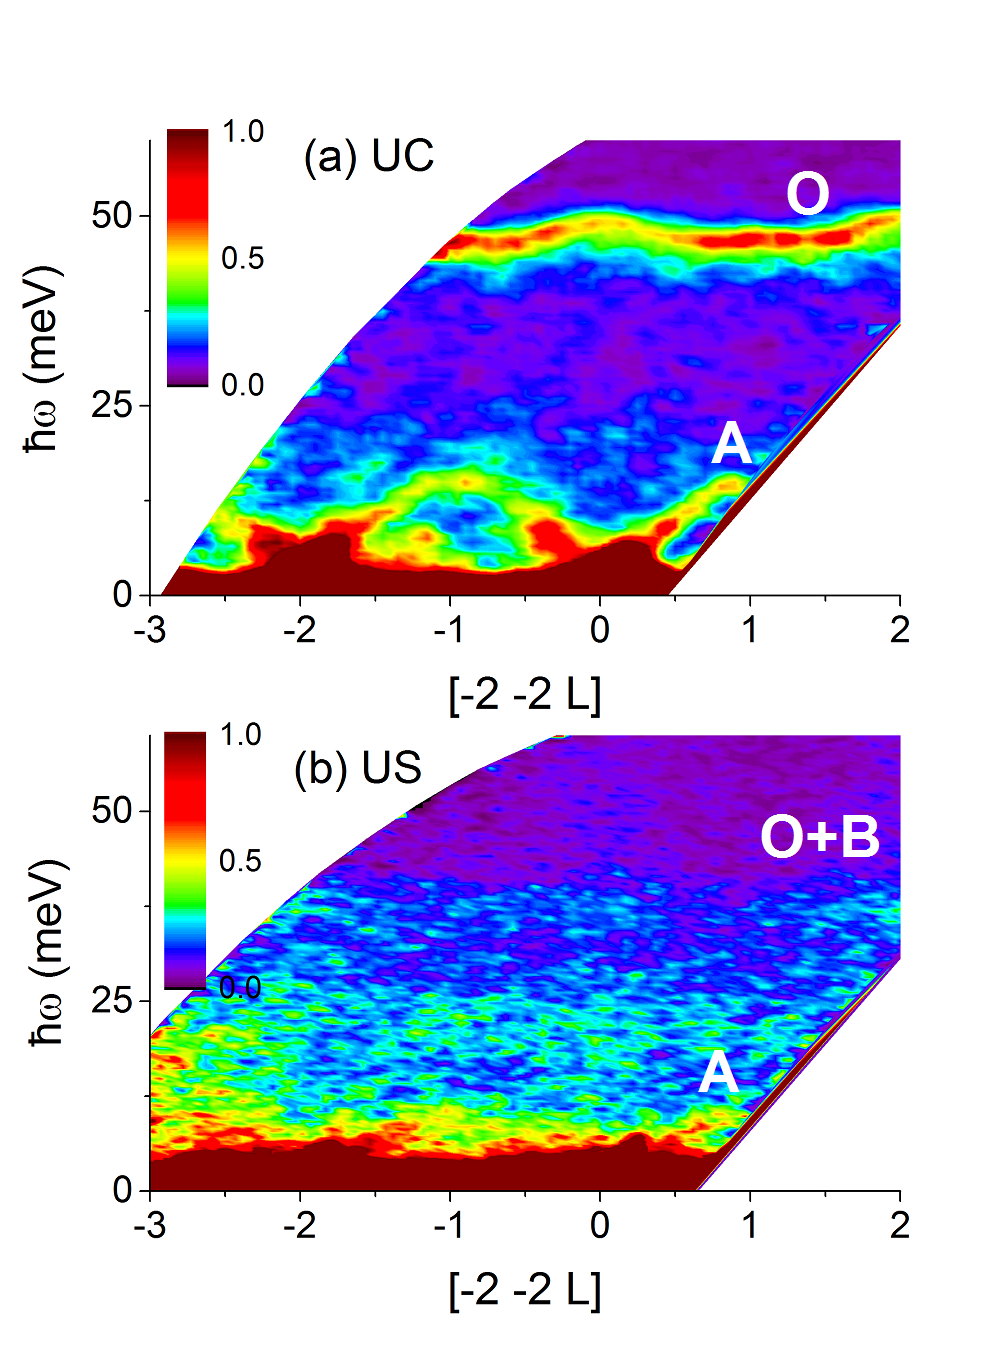
Figure 1 shows representative phonon measurements with 80 meV for (a) UC from ARCS and (b) US from SEQUOIA along the [] direction in reciprocal space. The results for the acoustic and optic phonons are consistent with those previously reported in the literature86_jackman ; 71_smith . Both the acoustic and optic modes in UC are clearly visible with large signal compared to background. On the other hand, the optic phonon modes of US in particular are only weakly visible in the data. The decreased intensity of these excitations can be understood by considering the one phonon structure factor, , for the rocksalt structure. Along symmetry directions this can be written as 74_wedgwood ; 66_peckham :
| (1) |
with
| (2) |
where is the neutron momentum transfer, is a unit vector describing the phonon polarization, is the mass of U, is the mass of the light atom X, and are the relative displacements of the U and the X ions, subject to the constraint , and and are the neutron bound coherent scattering lengths74_wedgwood . The sign between the two terms in Eq. (2) depends on the () indices of the Brillouin zone, where (+) and (-) correspond to all even and all odd indices respectively.
For optical phonons, at the zone center and therefore can be rewritten as:
| (3) |
In the limit of :
| (4) |
This expression indicates that the intensity of the optic modes is determined primarily by the mass and scattering length of the light atoms. Under the assumption of similar scattering lengths, the intensity of the optic modes decreases with increasing mass of the light atom. Table 2 further emphasizes this point by comparing several parameters relevant to the phonon intensities of UC, UN, and US nist . It is seen that the optic phonon cross section for US is more than an order of magnitude smaller than the comparable cross-sections for UC or UN. Al is also included in the table since. It leads to significant background scattering in the experiments, as discussed below.
| Atom | (amu) | ||
|---|---|---|---|
| N | 14 | 9.4 | 6.31 |
| C | 12 | 6.6 | 3.63 |
| S | 32 | 2.8 | 0.25 |
| U | 238 | 8.4 | - |
| Al | 27 | 3.4 | - |
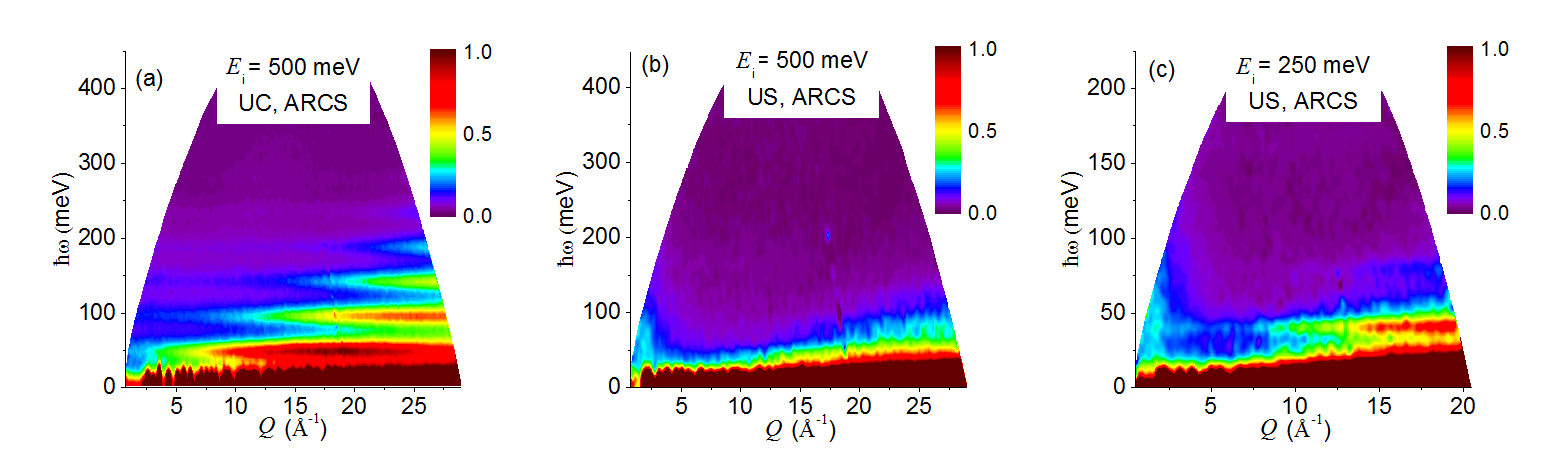
Figure 2 depicts the orientationally averaged, high energy response observed for both UC and US on ARCS. Several evenly-spaced vibrational modes are easily visible in the UC 500 meV spectrum shown in Fig. 2(a). In the US data with 500 meV (Fig. 2(b)) the high energy vibrational modes are less obvious. On the other hand, some weak modes can be ascertained in the higher resolution 250 meV data depicted in Fig. 2(c). In both materials the modes appear on inspection to be evenly spaced.
We first discuss the scattering seen in UC. Figure 3 shows the 500 meV -integrated data for UC, with two different panels corresponding to linear (top) and log (bottom) y-axes. Modes up to 7th order are clearly visible as peaks in the data.
To test whether these are evenly spaced the -integrated dataset is fitted to the following functional form:
| (5) |
is a scale factor for each individual Gaussian peak, and is the standard deviation for each peak. An empirical background consisting of a constant and decaying exponential was incorporated into the fit. The decaying exponential term is expected from a simple diffusive model of multiphonon scattering nagler_91 ; perring_89 . are the mode positions that were fit independently and the last term incorporates all others sources of background.
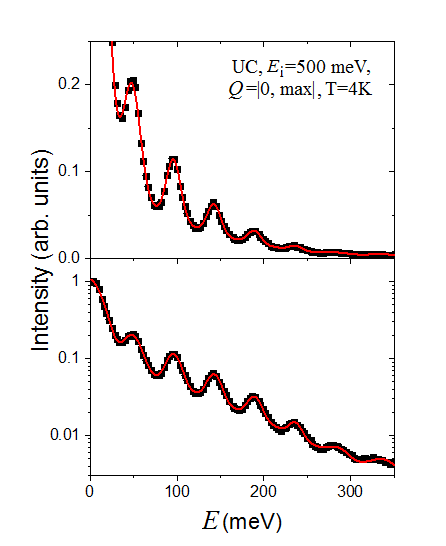
The solid line in figure 3 represents the fitted curve from Eq. (5). The fitted peak positions of the modes for all measured datasets are shown in Table 3, and are evenly spaced. The average spacing between the modes, incorporating all fitted datasets, was found to be 481 meV for UC. The values are averaged by a weighted approach meaning . Values calculated from individual peaks, i.e. deviate from the average by less than 1 meV, which implies a highly harmonic potential.
(a) UC, = 4 K
| 500meV | 700meV | 800meV | |
|---|---|---|---|
| 1 | 47.7(3) | - | - |
| 2 | 96.2(3) | 98.1(2) | 99.7(4) |
| 3 | 142.8(4) | 144.1(3) | 146.0(5) |
| 4 | 189.1(6) | 190.9(3) | 193.0(4) |
| 5 | 235.6(1) | 237.3(4) | 239.0(4) |
| 6 | 283.8(36) | 283.7(6) | 284.7(6) |
| 7 | - | 329.9(7) | 331.0(1.0) |
| 8 | - | 372.9(1.2) | 375.5(1.7) |
average : 481 meV
The fact that the spectrum is characterized by a series of evenly-spaced modes suggests that the light atoms behave like independent 3D QHOs similar to UN12_aczel . This hypothesis can be tested quantitatively by comparing the relative intensities of the modes to the known dynamical structure factor for the mode of a QHO at low , which has a simple analytical form given by:
| (6) |
where and is a constant.
Assuming that one has a carbon atom QHO with the measured energy spacing of 48 meV and a mass of 12.01 a.m.u. the calculated value of is 0.0036 Å2. Given the range of measured and the dependence in equation (6), it is surprising that the higher order modes are visible in figure 3. This can be understood by considering that only accounts for single scattering events. With equally spaced modes, however, the contributions from multiple scattering will also peak at energies corresponding to mode positions, and as discussed below the multiple scattering contributes to intensity at low .
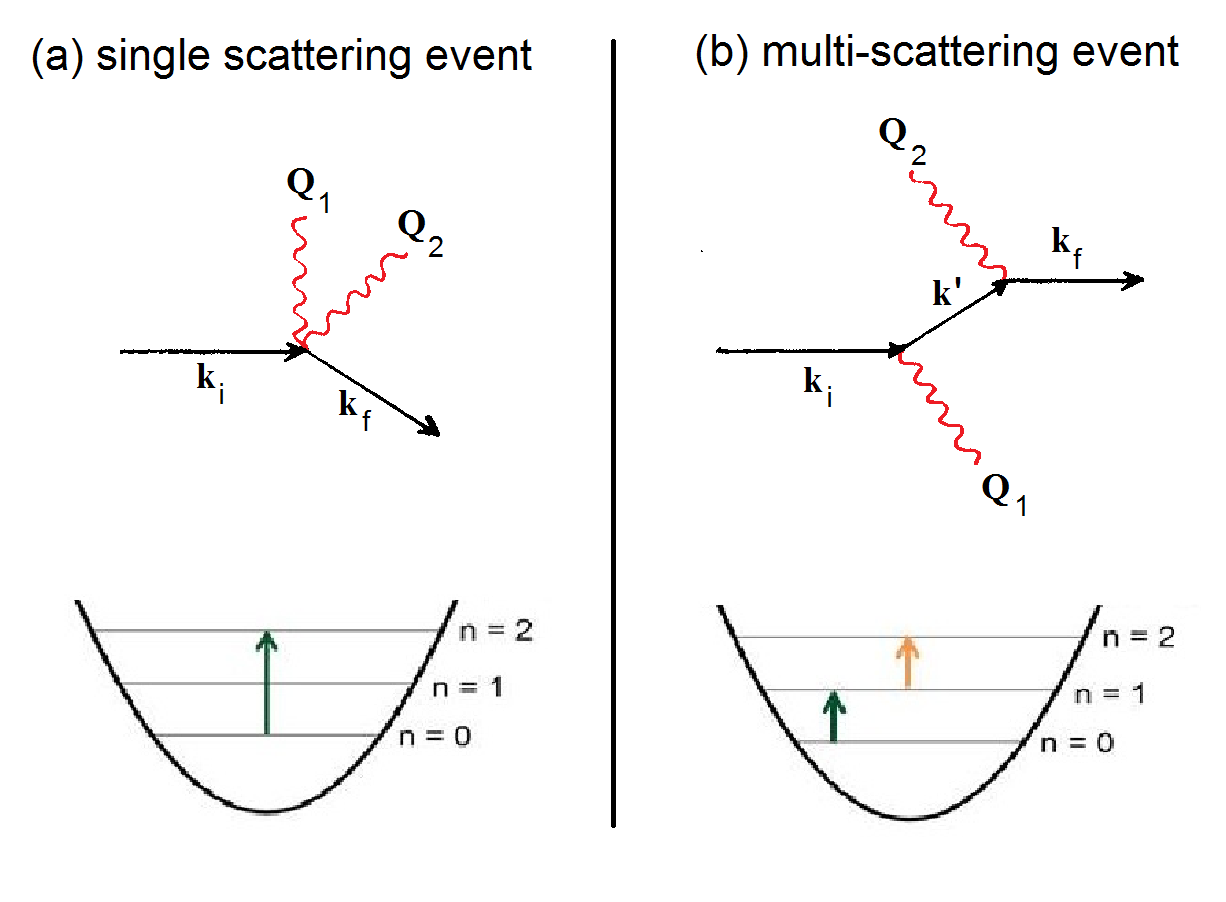
We consider the meaning of a single scattering event in both QHO language and an alternate, but equivalent description based on creating Einstein phonons of fixed frequency. At an inelastic neutron scattering event, at an energy of in QHO language, represents a transition from the QHO ground state to the eigenstate. In Einstein mode language it consists of a single scattering event, with total wavevector transfer magnitude , that creates Einstein phonons, each of energy . In either case the scattering cross-section contains a factor . On the other hand, a multiple scattering event in QHO language corresponds to a set of multiple transitions from the ground state to the excited state, while in the phonon description several different scatterings occur creating in aggregate Einstein phonons. The scattering event contributes a factor to the total observed cross-section. These processes are depicted in Figure 4 for the case . The single scattering event shown in Figure 4 (a) will have an intensity and a requirement that the vector sum of the individual Einstein phonon momenta and has a magnitude equal to . On the other hand, in the multiple scattering event shown in Figure 4 (b) each created Einstein phonon contributes a separate factor to the measured intensity which is therefore proportional to . The total net vector momentum transfer measured in the experiment can take on a wide range of values, including as depicted in the figure. The average over all possible multiple scattering combinations can lead to a cross-section that is independent of . Therefore the observed intensity of the higher order peaks at small arises principally from multiple scattering.
With this in mind, we fit the constant- cuts of the UC data to a modified expression of for QHOs 12_aczel , given by:
| (7) |
Here is and a -independent term is included to account for the multiple scattering described above. For the ideal QHO model, . By relaxing this constraint and allowing and to be independent parameters in the data fitting, one can gain a sense of how much the UC data deviates from the ideal QHO limit.
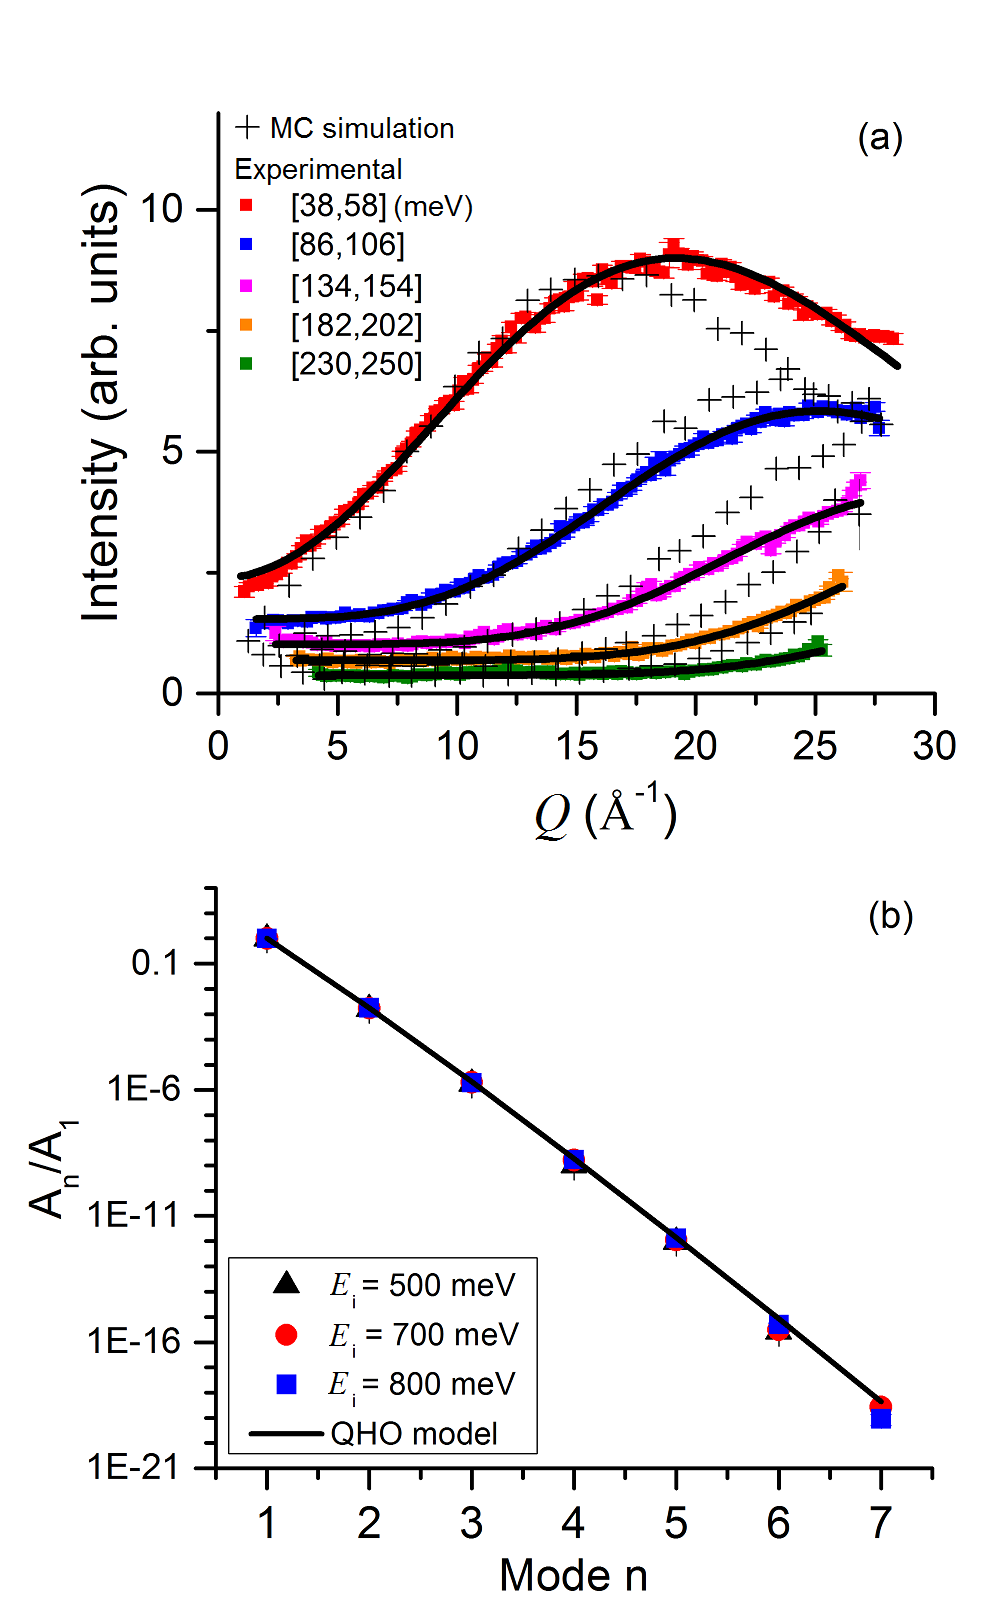
Figure 5(a) depicts constant- cuts from the 500 meV dataset for the 1-5 modes, centered about for the mode (20 meV integration range). Similar cuts were made for the 700 meV and 800 meV datasets (not shown). Figure 5(b) plots the ratios of the fitted parameters for the 500 meV, 700 meV, and 800 meV datasets. The solid line indicates the prediction for the QHO model with 48 meV, with the non-integer values interpolated by using to calculate . As in the case of UN, there is excellent agreement between the QHO model and the data over 20 orders of magnitude. The experimental value, corresponding to the zero point motion of the oscillator, also agrees well with the model. By incorporating all three datasets into the fit, the average value of was found to be 0.0031(1) Å2, which is close to the calculated value for the ideal QHO of 0.0036 Å2 discussed above. These findings provide strong confirmation that the high energy vibrational modes observed in UC correspond to quantum oscillations of the carbon atoms in the system.
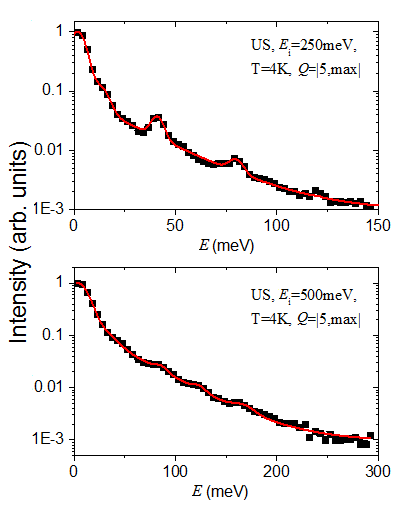
Figure 6 shows the -integrated data for US with 250 meV and 500 meV, including fitted curves using Eq. (5). The same fitting approach, described earlier for UC, was also used for the US data. However due to the weaker mode intensities in US, it is not possible to fit as many peaks in the US dataset. Nonetheless the modes are evenly spaced, similar to UC, with an averaged of 41(1) meV. The fitted peak position of each individual mode is shown in Table 4.
US, = 4 K
| 250meV | 500meV | |
|---|---|---|
| 1 | 40.9(3) | - |
| 2 | 79.9(9) | 85.6(2.4) |
| 3 | - | 122.9(3.6) |
| 4 | - | 166.7(5.8) |
average : 411 meV
The weak intensities of higher QHO modes in US can be largely explained by the phonon structure factor of the rocksalt structure, as discussed earlier by Eq. (3) and (4), and Table 2. In short the greater mass and shorter scattering length of sulfur results in a much smaller compared to carbon or nitrogen. At small the scattering at the mode position is dominated by multiple scattering processes sequentially creating single optic phonons. The observed cross-section is therefore proportional to . For this reason the higher QHO modes appear much weaker in US compared to UC.
The correction for the Al background scattering is also a significant complication for the observation of QHO modes in US. The QHO cross-section for each mode reaches a maximum at the value of where the mode energy corresponds to the energy of the recoil scattering, which is given for an atom of mass by . As seen in Table II the masses of Al and S are relatively close, so the recoil scattering from the Al is strong near the position where one expects to see the scattering due to the QHO modes of S. Altogether, quantitative analysis of the intensity of the QHO modes in US is more difficult.
III III. Monte Carlo ray tracing simulations
Monte Carlo (MC) ray tracing simulations of both the UC and US ARCS neutron scattering experiments were performed to gain a better understanding of the various factors contributing to the observed scattering intensity. This approach worked exceptionally well to describe the neutron scattering spectra observed for UN14_lin . The ability to model more realistic instrument and sample configurations is ever increasing14_lin_2 ; Farhi_14 . The simulations used the MC ray tracing program Monte Carlo Virtual Neutron Experiment (MCViNE), which was based off McstasLefmann_99 ; Willendrup_04 and developed in the Distributed Data Analysis for Neutron Scattering Experiments (DANSE)fultz_website software development project. In each simulation, the sample was modeled as a cube with a 1 cm3 volume, approximating the shape of the sample used in the measurement. The configuration files for the simulations were created through a series of simple modifications to the files used for the UN MC simulations described in detail in Ref. 14_lin , allowing for a straightforward extension of those calculations to UC and US.
Intrinsic broadening of the QHO modes is included in the simulation, as it is observed experimentally and predicted by the binary solid model83_lovesey . The broadening arises from the fact that the heavy U atoms are not completely stationary, and can be modeled by replacing the Dirac-Delta function in the QHO expression with a Gaussian:
| (8) |
where the Gaussian width is a function of temperature and given by:
| (9) |
M here is the mass of the heavy atom, in this case the U atom. is the acoustic phonon density of states calculated with a Born-Van Karmen model and is the maximum band frequency for the acoustic phonon modes.
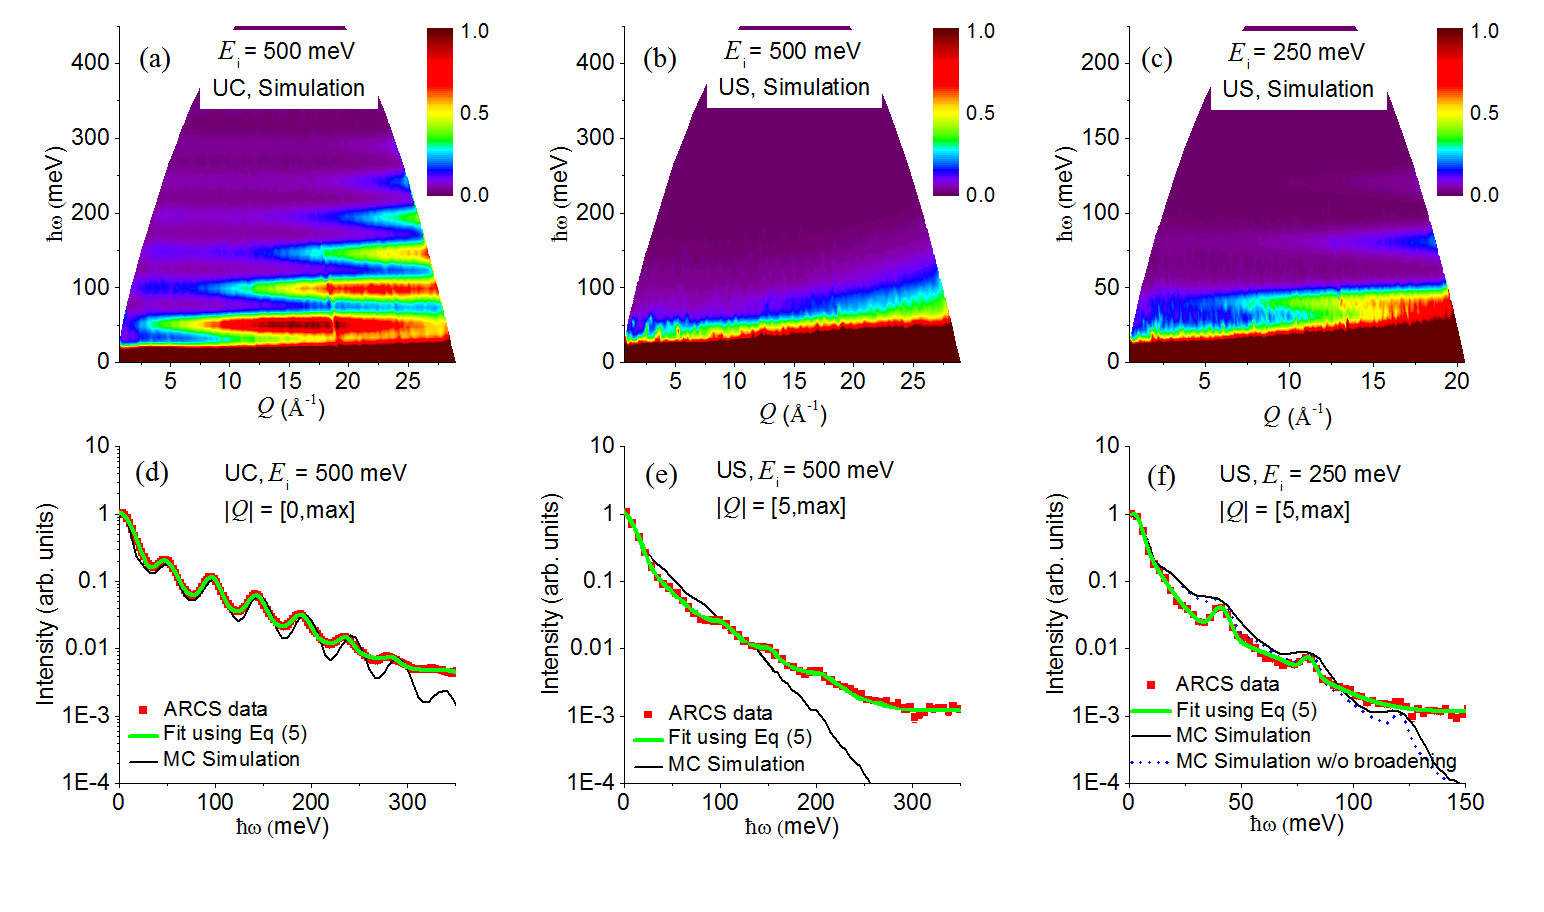
A Monte Carlo ray tracing simulation for UC with 500 meV is shown as a color contour plot in Fig. 7(a) and the -integrated result is presented in Fig. 7(d). This simulation is analogous to the one reported in Ref. 14_lin for UN and includes various sample kernels accounting for elastic scattering, QHO scattering (from carbon atoms), acoustic phonon scattering, and all forms of multiple scattering arising from the processes described above. Figure 5(a) described earlier includes cuts from the 500 meV MC simulation as (+) symbols with the experimental data, where is fixed at the value of 0.0036 Å2 corresponding to a carbon QHO with 48 meV and a mass of 12.01 a.m.u.
Monte Carlo simulations for US, incorporating sample kernels with the same ingredients as for UC, are shown as color contour plots in Fig. 7(b) and (c) with intrinsic broadening included. The -integrated results are also presented in Fig. 7(e) and (f). For (f), data simulated without intrinsic broadening is also included. At low signal levels the measured data approaches a constant value, above the simulations. This indicates that there is a background contribution, limiting the measurement sensitivity, that is not captured in the Monte Carlo simulations, nor by the Al can subtraction. The additional background could arise from a combination of effects including imperfect Al background subtraction, multiple scattering involving the magnetic response or events partially external to the sample, and possibly a contribution from fission neutrons in the sample that moderate in the instrument shielding.
When comparing the high energy vibrational modes of UC, UN, and US it is apparent that the differences in the U:X mass ratio (U:C 19.8, U:N 17, U:S 7.4) lead to more obvious QHO behavior in the lighter atoms. As the U:X mass ratio decreases, the dispersion of the optic phonon modes has been shown to increase systematically74_wedgwood , shifting the vibrational behavior of the light atoms further away from the localized QHO picture. A smaller U:X mass ratio has also the effect of pushing the optic phonon frequencies down closer in energy to the acoustic modes, so any resulting QHO excitations tend to be more closely spaced and therefore harder to resolve for a given instrumental energy resolution.
IV IV. Anharmonicity and anisotropy
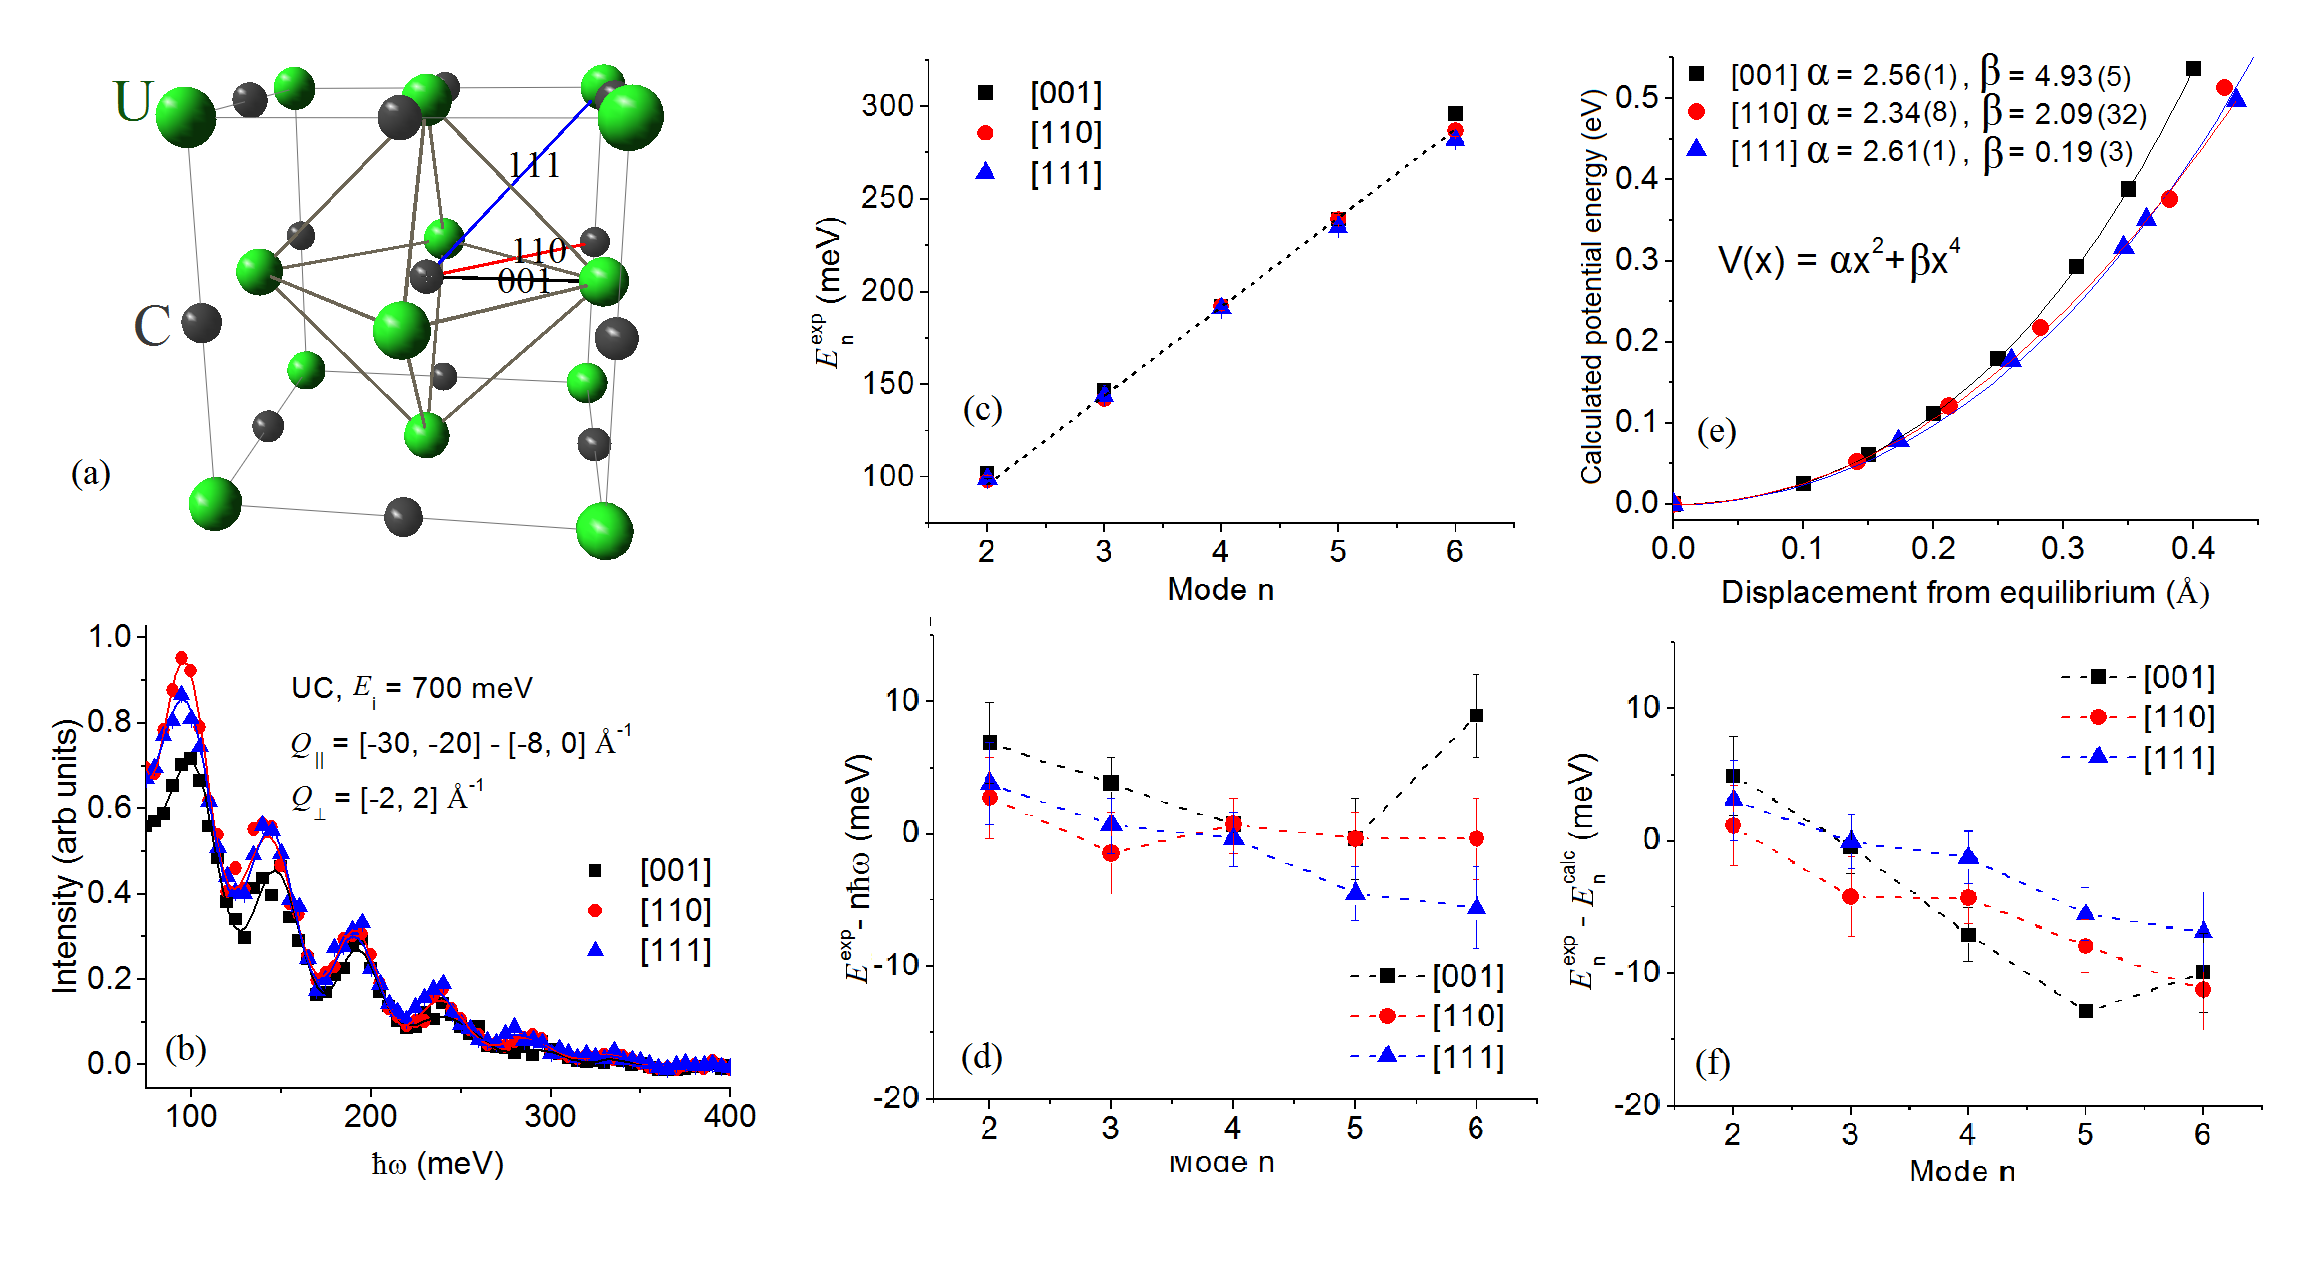
All QHO data presented to this point for both UC and UN12_aczel have been powder-averaged, so only is considered and not . The reason this approximation works so well is because the modes are highly isotropic. However, in principle the spacings of the modes could reflect both anisotropy and anharmonicity in the local potential. To see whether these effects are experimentally observable in the QHO modes of UC, we collected a 700 meV dataset with very high statistics along three crystallographic directions, [100], [110], and [111]. The C atoms have nearest neighbor distances along these directions in the ratio of 1::, as one can see from considering the crystal structure shown in Fig. 8(a). The effects of anisotropy would be manifested by different mode spacings for the different directions, while anharmonicity would be apparent by different mode spacings as a function of energy. Unfortunately, both of these features will be masked by the effect of multiple scattering, since at any value of it tends to cause peaks to appear at locations corresponding to . As a result, a straightforward plotting of oscillator peaks along different directions does not show any significant anisotropy or anharmonic effects, and additional analysis is needed to account for the multiple scattering.
As an effort to minimize the effect of multiple scattering present in the single crystal data, we take advantage of the fact discussed earlier that the small scattering for the higher modes is totally dominated by multiple scattering, and use the low data as a pseudo-background, as described here: For each of the three directions we integrate over a range perpendicular to that direction given by = [-2,2] Å-1. As a signal we use the high part of the scattering defined by 20 30 Å-1, and as a background we utilize the region 0 8 Å-1. The subtraction of these two leads to constant- difference cuts along the three directions as shown in Fig. 8(b). Note that the peak is not sufficiently resolved in the 700 meV data to be included here.
| n | [001] | [110] | [111] |
|---|---|---|---|
| 1 | - | - | - |
| 2 | 102(3) | 98(3) | 99(3) |
| 3 | 147(2) | 142(3) | 144(3) |
| 4 | 192(2) | 192(2) | 191(2) |
| 5 | 239(3) | 239(2) | 235(2) |
| 6 | 296(3) | 287(2) | 282(3) |
The difference cuts are fit to Eq. (5) to determine mode positions along the [001], [110], and [111] directions; fits are indicated in Fig. 8(b) by the solid curves, and the fitted peak positions are listed in Table 5. These are also shown in Fig. 8(c), with the mode positions determined from the data () and the dashed curve representing the expectation for an ideal carbon QHO with 48 1 meV. Fig. 8(d) shows the difference between the mode positions for the ideal model (n) and the experiment. The error bars are statistical and are larger than those for fits to the powder averaged data, presumably due to the lower number of counts in this single crystal dataset. From the fits, the average oscillator energies are given for the different directions as =49.0(6)meV, =48.0(6)meV, and =47.9(6)meV. There is no compelling evidence for anisotropy in the potential although the experimental data along the [001] direction did exhibit a slightly higher frequency than those along the other directions. This observation is compatible with density functional theory (DFT) calculations discussed below.
To gain insight into any expected anisotropy and anharmonicity of the oscillator modes in UC, we have used DFT to calculate the potentials seen by the C atoms (see the appendix for details). The calculated potentials for the three principal directions are shown by the symbols in Fig. 8(e). The potential in each direction is described well by the following expression:
| (10) |
with the results shown by the solid lines in the figure. The values determined for and are also indicated. The calculation shows a small amount of anisotropy, and also indicates that the anharmonicity should be maximized along the [001] direction. The latter result suggests that the harmonic approximation becomes less valid for in the direction with the shortest nearest neighbor distance. Indeed the fitted for [001] is more than twice the magnitude of the s along the other directions..
Assuming that the term is small, the energy levels corresponding to this potential can be calculated according to first order perturbation theory griffiths_book , with the energy level corresponding to:
| (11) |
and the energy difference between the level and the 0 ground state given by:
| (12) |
with .
Assuming that the first mode occurs at 48 meV, the energies of higher QHO levels along each of the 3 directions can be calculated using Eq. (12) along with each direction’s corresponding and shown in Fig. 8(e). Fig. 8(f) displays the difference between the oscillator mode positions determined from the experiment and the value from first order perturbation theory. The downward slope indicates that the experimentally determined anharmonicity is not as large as the estimate. One must bear in mind that despite the attempt to correct for multiple scattering in the data, it is greater at higher order peaks and therefore could still mask what is a rather subtle effect.
V V. Conclusions
For the binary crystal UC, time-of-flight neutron scattering measurements reveal a series of well-defined, equally spaced, high energy vibrational modes that can be attributed to quantum harmonic oscillator behavior of the carbon atoms in this system. Measurements of the QHO modes along the high-symmetry [001], [110], and [111] directions reveal that these excitations are characterized by at most only a very small amount of anharmonicity and anisotropy. Similar time-of-flight neutron scattering data for US also shows evidence for the high energy vibrational modes, but only a few are clearly observed and they are much weaker in intensity. The difference can be understood by considering the U:X mass ratio, the quantity that characterizes the scattering strength of the modes, and the interference of Al and S recoil scattering with the signal in US. Some progress has been made in modeling the various contributions to the scattering, but a better way to handle multiple scattering will be needed to accurately measure anharmonicity and anisotropy in the QHO modes.
VI Acknowledgments
This research was supported by the US Department of Energy, Office of Basic Energy Sciences. A.A.A., G.E.G., D.L.A., M.B.S. and S.E.N. were fully supported and J.Y.Y.L was partially supported by the Scientific User Facilities Division. G.D.S. and G.M.S. were fully supported by the Materials Sciences and Engineering Division. Neutron scattering experiments were performed at the Spallation Neutron Source, which is sponsored by the Scientific User Facilities Division. Y.Y. was supported by the BES DOE, through the EPSCoR, Grant No. DE-FG02-08ER46528 as well as the Scientific User Facilities Division.
VII Appendix: DFT calculation
For UC, the electronic structure within the density functional theory (DFT) was obtained using the Quantum ESPRESSO package 09_giannozzi . The calculation was performed using a plane-wave basis set and an ultrasoft pseudopotential 90_vanderbilt optimized in a RRKJ scheme 90_rappe . The uranium pseudopotential was obtained from an ionized electronic configuration: with cutoff radii equal to 3.5 atomic units (a.u.), 1.7 a.u., 2.6 a.u. and 1.6 a.u. for and angular momentum. The electronic levels deviate from the all-electron ones by less than 0.1 meV. We used the Perdew, Burke, Ernzerhof 96_perdew exchange-correlation functional. The Brillouin zone (BZ) summations were carried out over a supercell. The electronic smearing with a width of 0.02 Ry was applied according to the Methfessel-Paxton method. The plane wave energy and charge density cut-offs were 73 Ry and 1054 Ry respectively, corresponding to a calculation accuracy of 0.2 mRy/atom. The carbon atom potential was obtained from the total energy modification of a supercell when one carbon atom was shifted from the equilibrium position in the [100], [110], or [111] directions and the remaining atoms were held fixed in their equilibrium positions.
References
- (1) M. Kuznietz, G.H. Lander, and F.P. Campos, Journal of Physics and Chemistry of Solids 30, 1642 (1969).
- (2) W.J.L. Buyers, A.F. Murray, T.M. Holden, E.C. Svensson, P. de V. DuPlessis, G.H. Lander and O. Vogt, Physica B 102, 291 (1980).
- (3) W.J.L. Buyers, A.F. Murray, J.A. Jackman, T.M. Holden, P. de V. DuPlessis and O. Vogt, J. Appl. Phys. 52, 2222 (1981).
- (4) T.M. Holden, W.J.L. Buyers, E.C. Svensson, and G.H. Lander, Phys. Rev. B 26, 6227 (1982).
- (5) T.M. Holden, J.A. Jackman, W.J.L. Buyers, K.M. Hughes, M.F. Collins, P. de V. DuPlessis, and O. Vogt, Journal of Magnetism and Magnetic Materials 63-4, 155 (1987).
- (6) W.J.L. Buyers, T.M. Holden, J.A. Jackman, A.F. Murray, P. de V. DuPlessis and O. Vogt, Journal of Magnetism and Magnetic Materials 31-4, 229 (1983).
- (7) J.A. Jackman, T.M. Holden, W.J.L. Buyers, P. de V. DuPlessis, O. Vogt and J. Genossar, Phys. Rev. B 33, 7144 (1986).
- (8) K.M. Hughes, T.M. Holden, W.J.L. Buyers, P. de V. DuPlessis, and M.F. Collins, Journal of Applied Physics 61, 3412 (1987).
- (9) T.M. Holden, W.J.L. Buyers, E.C. Svensson, J.A. Jackman, A.F. Murray, O. Vogt, and P. de V. DuPlessis, Journal of Applied Physics 53, 1967 (1982).
- (10) F.A. Wedgwood, J. Phys. C: Solid State Phys. 7, 3203 (1974).
- (11) D.E. Burkes, R.S. Fielding, D.L. Porter, M.K. Meyer, and B.J. Makenas, Journal of Nuclear Materials 393, 1 (2009).
- (12) Q. Yin, A. Kutepov, K. Haule, G. Kotliar, S.Y. Savrasov and W.E. Pickett, Phys. Rev. B 84, 195111 (2011).
- (13) Z.-G. Mei, M. Stan and B. Pichler, Journal of Nuclear Materials 440, 63 (2013).
- (14) A.A. Aczel, G.E. Granroth, G.J. MacDougall, W.J.L. Buyers, D.L. Abernathy, G.D. Samolyuk, G.M. Stocks and S.E. Nagler, Nature Communications 3, 1124 (2012).
- (15) T.M. Holden, W.J.L. Buyers, E.C. Svensson and G.H. Lander, Phys. Rev. B 30, 114 (1984).
- (16) G. Dolling, T.M. Holden, E.C. Svensson, W.J.L. Buyers and G.H. Lander, Phonons: Proceedings of the International Conference on Lattice Dynamics, Paris, 5-7 Sept. 1977, edited by M. Balkanski (Flammarion, Paris, 1978), p. 81.
- (17) G.E. Granroth, D.H. Vandergriff and S.E. Nagler, Physica B 385-386, 1104 (2006).
- (18) G.E. Granroth, A.I. Kolesnikov, T.E. Sherline, J.P. Clancy, K.A. Ross, J.P.C. Ruff, B.D. Gaulin and S.E. Nagler, J. Phys.: Conf. Ser. 251, 012058 (2010).
- (19) D.L. Abernathy, M.B. Stone, M.J. Loguillo, M.S. Lucas, O. Delaire, X. Tang, J.Y.Y. Lin and B. Fultz, Review of Scientific Instruments 83, 015114 (2012).
- (20) J.Y.Y. Lin, A.A. Aczel, S.E. Nagler, D.L. Abernathy, W.J.L. Buyers and G.E. Granroth, Phys. Rev. B 89, 144302 (2014).
- (21) M. Warner, S.W. Lovesey, and J. Smith, Z. Phys. B 51, 109 (1983).
- (22) M.T. Dove, Introduction to Lattice Dynamics, Cambridge University Press (1993).
- (23) S. Ikeda and N. Watanabe, J. Phys. Soc. Jpn. 56, 565 (1987).
- (24) A.I. Kolesnikov, I.O. Bashkin, V. Yu. Malyshev, E.G. Ponyatovsky, M. Prager and J. Tomkinson, Physica B 180-181, 284 (1992).
- (25) A.I. Kolesnikov, I.O. Bashkin, A.V. Belushkin, E.G. Ponyatovsky and M. Prager, J. Phys.: Cond. Matt. 6, 8989 (1994).
- (26) C. Elsässer, K. M. Ho, C. T. Chan, M. Fähnle, Phys. Rev. B 44, 18 (1991).
- (27) R. Caputo, A. Alavi, Molecular Physics, 101, 11, 1781-1787 (2003).
- (28) H.G. Smith and W. Glaser, Phonons: Proceedings of the International Conference, Rennes, France 1971, edited by M.A. Nusimovici (Flammarion, Paris, 1971), p. 145.
- (29) P. de V. DuPlessis, T.M. Holden, W.J.L. Buyers, J.A. Jackman, A.F. Murray and C.F. Van Doorn, J. Phys. C 18, 2809 (1985).
- (30) G. Peckham, Proc. Phys. Soc. 90, 657 (1967).
- (31) V. F. Sears, Neutron News, 3, No. 3 (1992).
- (32) S.E. Nagler, D.A. Tennant, R.A. Cowley, T.G. Perring, S.K. Satija, Phys. Rev. B 44, 22 (1991).
- (33) Toby Perring, PhD thesis, “High Energy Magnetic Excitations in Hexagoal Cobalt”, Cambridge University (1989).
- (34) J.Y.Y. Lin, H.L. Smith, G.E. Granroth, A.A. Aczel, D.L. Abernathy, M. Alvazis, and B. Fultz, Submitted to Nucl. Instr. Meth. Phys. Res. A, arXiv:1504.02776.
- (35) E. Farhi et al. Journal of Neutron Research 17, 63 (2014).
- (36) K. Lefmann, K. Nielsen, Neutron News 10, 20 (1999).
- (37) P. Willendrup, E. Farhi and K. Lefmann, Physica B 350, 735 (2004).
- (38) B. Fultz et al, DANSE, http://danse.us (unpublished).
- (39) David J. Griffiths, Introduction to Quantum Mechanics, Pearson Prentice Hall, 2nd edition (2004).
- (40) P. Giannozzi et al, J. Phys.: Cond. Matt. 21, 395502 (2009).
- (41) D. Vanderbilt, Phys. Rev. B 41, 7892 (1990).
- (42) A.M. Rappe, K.M. Rabe, E. Kaxiras adn J.D. Joannopoulos, Phys. Rev. B 41, 1227 (1990).
- (43) J.P. Perdew, K. Burke and M. Ernzerhof, Phys. Rev. Lett. 77, 3865 (1996).