VMF-SNE: Embedding for Spherical Data
Abstract
T-SNE is a well-known approach to embedding high-dimensional data and has been widely used in data visualization. The basic assumption of t-SNE is that the data are non-constrained in the Euclidean space and the local proximity can be modelled by Gaussian distributions. This assumption does not hold for a wide range of data types in practical applications, for instance spherical data for which the local proximity is better modelled by the von Mises-Fisher (vMF) distribution instead of the Gaussian. This paper presents a vMF-SNE embedding algorithm to embed spherical data. An iterative process is derived to produce an efficient embedding. The results on a simulation data set demonstrated that vMF-SNE produces better embeddings than t-SNE for spherical data.
Index Terms:
data embedding, data visualization, t-SNE, Von Mises-Fisher distributionI Introduction
High-dimensional data embedding is a challenging task in machine learning and is important for many applications, particularly data visualization. Principally, data embedding involves projecting high-dimensional data to a low-dimensional (often 2 or 3) space where the major structure (distribution) of the data in the original space is mostly preserved. Therefore data embedding can be regarded as a special task of dimension reduction, with the objective function set to preserve the structure of the data.
Various traditional dimension reduction approaches can be used to perform data embedding, e.g., the principal component analysis (PCA) [1] and the multi-dimensional scaling (MDS) [2]. PCA finds low-dimensional embeddings that preserve the data covariance as much as possible. Classical MDS finds embeddings that preserve inter-sample distances, which is equivalent to PCA if the distance is Euclidean. Both the PCA and MDS are simple to implement and efficient in computation, and are guaranteed to discover the true structure of data lying on or near a linear subspace. The shortage is that they are ineffective for data within non-linear manifolds.
A multitude of non-linear embedding approaches have been proposed. The first approach is to derive the global non-linear structure from local proximity. For example, ISOMAP extends MDS by calculating similarities of distant pairs based on similarities of neighbouring pairs [3, 4]. The self-organizing map (SOM) or Kohonen net extends PCA and derives the global non-linearity by simply ignoring distant pairs [5]. The same idea triggers the generative topographic mapping (GTM) [6], where the embedding problem is cast to a Bayesian inference with an EM procedure. The local linear embedding (LLE) follows the same idea but formulates the embedding as a local-structure learning based on linear prediction [7]. Another approach to deriving the global non-linear structure involves various kernel learning methods, e.g., the semi-definite embedding based on kernel PCA [8] and the colored maximum variance unfolding (CMVU) [9].
A major problem of the above non-linear embedding methods is that most of them are not formulated in a probabilistic way, which leads to potential problems in generalizability. The stochastic neighbor embedding (SNE) [10] attempts to solve the problem. It models local proximity (neighbourhood) of data in both the original and embedding space by Gaussian distributions, and the embedding process minimizes the kullback-leibler (KL) divergence of the distributions in the original space and the embedding space.
A potential drawback of SNE is the ‘crowding problem’, i.e., the data samples tend to be crowded together in the embedding space [11]. A UNI-SNE approach was proposed to deal with the problem, which introduces a symmetric cost function and a smooth model when computing similarities between the images (embeddings) of data in the embedding space [12]. With the same problem in concern, [11] proposed t-SNE, which also uses a symmetric cost function, but employs a Student t-distribution rather than a Gaussian distribution to model similarities between images. T-SNE has shown clear superiority over other embedding methods particularly for data that lie within several different but related low-dimensional manifolds.
Although highly effective in general, t-SNE is weak in embedding data that are not Gaussian. For example, there are many applications where the data are distributed on a hyper-sphere, such as the topic vectors in document processing [13] and the normalized i-vectors in speaker recognition [14]. These spherical data are naturally modelled by the von Mises Fisher (vMF) distribution rather than the Gaussian [15, 16, 17], and hence are unsuitable to be embedded by t-SNE. This paper presents a vMF-SNE algorithm to embed spherical data. Specifically, the Gaussian distribution and the Student t-distribution used by t-SNE in the original and the embedding space respectively are all replaced by vMF distributions, and an EM-based optimization process is derived to conduct the embedding. The experimental results on simulation data show that vMF-SNE produces better embeddings for spherical data. The code is online available111http://cslt.riit.tsinghua.edu.cn/resources.php?Public%20tools.
II Related work
This work belongs to the extensively studied area of dimension reduction and data embedding. Most of the related work in this field has been mentioned in the last section. Particularly, our work is motivated by t-SNE [11], and is designed specifically to embed spherical data which are not suitable to be processed by t-SNE. A more related work is the parametric embedding (PE) [18], which embeds vectors of posterior probabilities, thus sharing a similar goal as our proposal: both attempt to embed data in a constrained space though the constrains are different (-1 in PE and -2 in vMF-SNE).
Probably the most relevant work is the spherical semantic embedding (SSE) [19]. In the SSE approach, document vectors and topic vectors are constrained on a unit sphere and are assumed to follow the vMF distribution. The topic model and the embedding model are then jointly optimized in a generative model framework by maximum likelihood. However, SSE infers local similarities between data samples (document vectors in [19]) using a pre-defined latent structure (topic vectors), which is difficult to be generalized to other tasks as the latent structure in most scenarios is not available. Additionally, the cost function of SSE is the likelihood, while vMF-SNE uses the symmetric KL divergence.
III vMF-distributed stochastic neighbouring embedding
III-A t-SNE and its limitation
Let denote the data set in the high-dimensional space, and denote the corresponding embeddings, or images. The t-SNE algorithm measures the pairwise similarities in the high-dimension space as the joint distribution of and which is assumed to be Gaussian, formulated by the following:
| (1) |
In the embedding space, the joint probability of and is modelled by a Student t-distribution with one degree of freedom, given by:
| (2) |
The cost function of the embedding is the KL divergence between and , which is formulated by:
A gradient descendant approach has been devised to conduct the optimization, which is fairly efficient [11]. Additionally, the symmetric form of Eq. (1) and the long-tail property of the Student t-distribution alleviate the crowding problem suffering the original SNE and other embedding approaches.
The assumption that t-SNE holds deserves highlight: the joint probabilities of the original data and the embeddings follow a Gaussian distribution and a Student t-distribution, respectively. This is generally fine in most scenarios, however for data that are confined in a non-linear subspace, this assumption is potentially invalid and the t-SNE embedding is no longer optimal. This paper focuses on spherical data embedding, for which t-SNE tends to fail. This is because the Gaussian distribution assumed by t-SNE can hardly model spherical data, and the Euclidean distance associated with Gaussian distributions is not appropriate to measure similarities on a hyper-sphere. A new embedding algorithm is proposed, which shares the same embedding framework as t-SNE, but uses a more appropriate distribution form and a more suitable similarity measure to model spherical data.
III-B vMF-SNE
It has been shown that the vMF distribution is a better choice than the Gaussian in modelling spherical data, and the associated cosine distance is better than the Euclidean distance when measuring similarities in a hyper-spherical space, for instance, in tasks such as spherical data clustering [20, 21]. Therefore, we present an embedding method based on the assumption that the data in both the original and the embedding space follow vMF distributions. This new method is thus called ‘vMF-SNE’.
Mathematically, the probability density function of the vMF distribution on the (-1)-dimensional sphere in is given by:
where , and are parameters of the distribution and is a normalization constant. Note that the vMF distribution implies the cosine distance. As in t-SNE, the symmetric distance is used in both the original and embedding space. In the original space, define the conditional probability of given as:
| (3) |
the joint distribution is defined as follows:
| (4) |
In the embedding space, a simpler form of joint distribution is chosen by setting the concentration parameter the same for all . This choice follows t-SNE, and the rationale is that the distribution in the original space needs to be adjusted according to the data scattering around . However, doing so in the embedding space will cause unaffordable complexity in computation, as we will see shortly. The joint distribution with this simplification is given by:
| (5) |
As in t-SNE, the KL divergence between the two distributions is used as the cost function:
By gradient descendant, minimizing with respect to leads to the optimal embedding. The gradients will be derived in the following section.
III-C Gradient derivation
First note that
Since the first item on the right hand side of the equation is in dependent of the embedding, minimizing equals to maximizing the following cost function:
Define , we have:
where has been employed. The gradient of with respect to the embedding is then derived as:
| (6) | |||||
| (7) | |||||
| (8) |
This is a rather simple form and the computation is efficient. Note that this simplicity is partly due to the identical in the embedding space, otherwise the computation will be very demanding.
Algorithm 1 illustrates the vMF-SNE process. Notice that in the original data space, is required. Following [11], is set to a value that makes the perplexity equal to a pre-defined value , where is formulated by:
| (9) |
and is the information entropy defined by:
where has been defined in Eq. (3). As mentioned in [11], making the perplexity associated to each data point the same value normalizes the data scattering and so benefits outliers and crowding areas.
IV Experiment
To evaluate the proposed method, we employ vMF-SNE to visualize spherical data and compare it with the traditional t-SNE. Since visualization is not a quantitative evaluation, an entropy-based criterion is proposed to compare the two embedding approaches.
IV-A Simulation data
The experiments are based on simulation data. The basic idea is to sample clusters of data and examine if the cluster structure can be preserved after embedding. The sampling process starts from the centers of the clusters, i.e., . Although the sampling for different is essentially independent, we adopt a different approach: firstly sample the first center , and then derive other centers by randomly selecting a subset of the dimensions of and flipping the signs of the values on these dimensions. By this way, the centers are ensured to be separated on the hyper-sphere, which generates a clear cluster structure associated with the data.
Once the cluster centers are generated, it is easy to sample the data points for each cluster following the vMF distribution. A toolkit provided by Arindam Banerjee and Suvrit Sra was adopted to conduct the vMF sampling222http://suvrit.de/work/soft/movmf. In this work, the dimension of the data is set to , and data points are sampled in total. The concentration parameter used in the sampling also varies, in order to investigate the performance of the embedding approaches in different overlapping conditions.
IV-B Visualization test
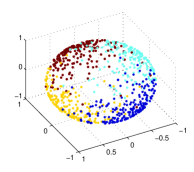
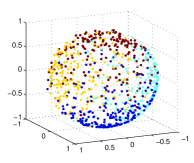
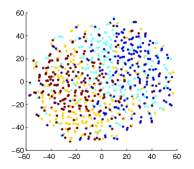
The first experiment visualizes the spherical data with vMF-SNE. The perplexity is set to , and the value of in the embedding space is fixed to (see Algorithm 1). The data are generated following vMF distributions by setting the scattering parameter to different values. Fig. 1 presents the embedding results on 3-dimensional spheres with vMF-SNE, where the two pictures show the results with =15 and =40 respectively. Note that the here is used in data sampling, neither the used to model the original data (which is computed from for each data point) nor the used to model the embedding data (which has been fixed to ). It can be seen that vMF-SNE indeed preserves the cluster structure of the data in the embedding space, and not surprisingly, data generated with a larger are more separated in the embedding space.
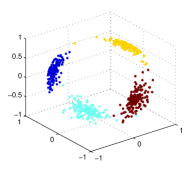
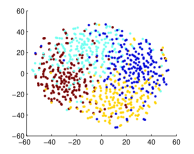
For comparison, the same data are embedded with t-SNE in 2-dimensional space. The tool provided by Laurens van der Maaten is used to conduct the embdding333http://lvdmaaten.github.io/tsne/, where the perplexity is set to . The comparative results are shown in Fig. 2 and Fig. 3 for data generated by setting =15 and =10 respectively. It can be observed that when is large (Fig. 2), both vMF-SNE and t-SNE perform well and the cluster structure is clearly preserved. However when is small (Fig. 3), vMF-SNE shows clear superiority. This suggests that t-SNE is capable to model spherical data if the structure is clear, even if the underling distribution is non-Gaussian; however in the case where the structure is less discernable in the high-dimensional space, t-SNE tends to mess the boundary while vMF-SNE still works well.

IV-C Entropy and accuracy test
Visualization test is not quantitative. For further investigation, we propose to use the clustering accuracy and entropy as the criteria to measure the quality of the embedding. This is achieved by first finding the images of the cluster centers, and then classifying the data according to their distances to the centers in the embedding space. The classification accuracy is computed as the proportion of the data that are correctly classified. The entropy of the -th cluster is computed as where is the proportion of the data points generated from the -th cluster but are classified as the -th cluster in the embedding space. The entropy of the entire data set is computed as the average of over all the clusters. Table I presents the results. It can be observed that in the case of clusters, vMF-SNE achieves lower entropy and better accuracy than t-SNE when is small. If is large, both the two methods can achieve good performance, for the reason that we have discussed.
In the case of clusters, it is observed that vMF-SNE outperforms t-SNE with small values (large overlaps). This seems an interesting property and demonstrates that using the matched distribution (vMF) is helpful to improve embedding for overlapped data. However, with increases, vMF-SNE can not reach a performance as good as that obtained by t-SNE. A possible reason is that the large number of clusters leads to data crowding which can be better addressed with the long-tail Student t-distribution used by t-SNE. Nevertheless, this requires further investigation.
| 4 Clusters | Entropy | Accuracy | ||
|---|---|---|---|---|
| t-SNE | vMF-SNE | t-SNE | vMF-SNE | |
| 10 | 0.6556 | 0.5922 | 42% | 64.13% |
| 20 | 0.4725 | 0.4187 | 85.38% | 92.63% |
| 30 | 0.3804 | 0.3676 | 97.38% | 98.5% |
| 40 | 0.3485 | 0.3466 | 99.75% | 99.95% |
| 16 Clusters | Entropy | Accuracy | ||
| 10 | 0.3152 | 0.2975 | 15.5% | 16.88% |
| 20 | 0.2812 | 0.2608 | 38.25% | 40.75% |
| 30 | 0.2312 | 0.2383 | 68.25% | 55.13% |
| 40 | 0.1964 | 0.2187 | 91.25% | 60.63% |
V Conclusions
A vMF-SNE algorithm has been proposed for embedding high-dimensional spherical data. Compared with the widely used t-SNE, vMF-SNE assumes vMF distributions and cosine similarities with the original data and the embeddings, hence suitable for spherical data embedding. The experiments on a simulation data set demonstrated that the proposed approach works fairly well. Future work involves studying long-tail vMF distributions to handle crowding data, as t-SNE does with the Student t-distribution.
References
- [1] H. Hotelling, “Analysis of a complex of statistical variables into principal components.” the Journal of educational psychology, vol. 24, no. 6, p. 417, 1933.
- [2] I. Borg and P. J. Groenen, Modern multidimensional scaling: Theory and applications. Springer Science & Business Media, 2005.
- [3] J. B. Tenenbaum, “Mapping a manifold of perceptual observations,” Advances in neural information processing systems, pp. 682–688, 1998.
- [4] J. B. Tenenbaum, V. de Silva, and J. C. Langford, “A global geometric framework for nonlinear dimensionality reduction,” Science, vol. 290, no. 5500, pp. 2319–2323, 2000.
- [5] T. Kohonen, “Self-organized formation of topologically correct feature maps,” Biological Cybernetics, vol. 43, no. 1, pp. 59–69, 1982. [Online]. Available: http://dx.doi.org/10.1007/BF00337288
- [6] C. M. Bishop, M. Svensén, and C. K. I. Williams, “GTM: The generative topographic mapping,” Neural computation, vol. 10, no. 1, pp. 215–234, 1998.
- [7] S. T. Roweis and L. K. Saul, “Nonlinear dimensionality reduction by locally linear embedding,” Science, vol. 290, no. 5500, pp. 2323–2326, 2000.
- [8] K. Q. Weinberger, F. Sha, and L. K. Saul, “Learning a kernel matrix for nonlinear dimensionality reduction,” in Proceedings of the twenty-first international conference on Machine learning. ACM, 2004, p. 106.
- [9] L. Song, A. Smola, K. Borgwardt, and A. Gretton, “Colored maximum variance unfolding,” in Advances in neural information processing systems, 2007, pp. 1385–1392.
- [10] G. E. Hinton and S. T. Roweis, “Stochastic neighbor embedding,” in Advances in neural information processing systems, vol. 15, 2002, pp. 833–840.
- [11] L. Van der Maaten and G. Hinton, “Visualizing data using t-SNE,” Journal of Machine Learning Research, vol. 9, no. 2579-2605, p. 85, 2008.
- [12] J. Cook, I. Sutskever, A. Mnih, and G. E. Hinton, “Visualizing similarity data with a mixture of maps,” in Proceedings of the 11th International Conference on Artificial Intelligence and Statistics, vol. 2, 2007, pp. 67–74.
- [13] J. Reisinger, A. Waters, B. Silverthorn, and R. J. Mooney, “Spherical topic models,” in Proceedings of the 27th International Conference on Machine Learning (ICML-10), 2010, pp. 903–910.
- [14] N. Dehak, P. Kenny, R. Dehak, P. Dumouchel, and P. Ouellet, “Front-end factor analysis for speaker verification,” IEEE Transactions on Audio, Speech, and Language Processing, vol. 19, no. 4, pp. 788–798, 2011.
- [15] N. I. Fisher, Statistical analysis of circular data. Cambridge University Press, 1995.
- [16] I. S. Dhillon and S. Sra, “Modeling data using directional distributions,” Citeseer, Tech. Rep., 2003.
- [17] K. V. Mardia and P. E. Jupp, Directional statistics. John Wiley & Sons, 2009, vol. 494.
- [18] T. Iwata, K. Saito, N. Ueda, S. Stromsten, T. Griffiths, and J. B. Tenenbaum, “Parametric embedding for class visualization,” Neural Computation, vol. 19, no. 9, pp. 2536–2556, 2007.
- [19] T. M. V. Le and H. W. Lauw, “Semantic visualization for spherical representation,” in Proceedings of the 20th ACM SIGKDD international conference on Knowledge discovery and data mining. ACM, 2014, pp. 1007–1016.
- [20] A. Strehl, J. Ghosh, and R. Mooney, “Impact of similarity measures on web-page clustering,” in Workshop on Artificial Intelligence for Web Search (AAAI 2000), 2000, pp. 58–64.
- [21] A. Banerjee, I. S. Dhillon, J. Ghosh, and S. Sra, “Clustering on the unit hypersphere using von mises-fisher distributions,” in Journal of Machine Learning Research, vol. 6, 2005, pp. 1345–1382.