Observations of Galactic star-forming regions with the Cosmic Background Imager at 31 GHz
Abstract
Studies of the diffuse Galactic radio emission are interesting both for better understanding the physical conditions in our Galaxy and for minimising the contamination in cosmological measurements. Motivated by this we present Cosmic Background Imager 31 GHz observations of the Galactic regions NGC 6357, NGC 6334, W51 and W40 at 45 resolution and conduct an investigation of the spectral emission process in the regions at 45 and 1∘ resolution. We find that most of the emission in the regions is due to optically thin free-free. For 2 sub-regions of NGC 6334 and for a sub-region of W51 though, at 45 resolution and at 31 GHz we detect less emission than expected from extrapolation of radio data at lower frequencies assuming a spectral index of 0.12 for optically thin free-free emission, at 3.3, 3.7 and 6.5 respectively. We also detect excess emission in a sub-region of NCG 6334 at 6.4, after ruling out any possible contribution from Ultra Compact HII (UCHII) regions. At 1∘ resolution we detect a spinning dust component in the Spectral Energy Distribution (SED) of W40 that accounts for 18 7 % of the total flux density in the region at the peak frequency of 37 GHz. Comparison with 100 data indicate an average dust emissivity for the sub-regions of K(MJy sr-1)-1. Finally we translate the excess emission in the regions to an Anomalous Microwave Emission (AME) emissivity relative to the optical depth at 250 . We find that this form of emissivity is independent of the AME significance and has a value somewhere in the order of 104 Jy.
keywords:
radiation mechanisms: thermal - ISM: clouds - HII regions - supernova remnants - radio continuum1 Introduction
The Galactic diffuse emission at radio frequencies provides us with a wealth of information about the formation, structure and evolution of our Galaxy (Planck Collaboration et al., 2011a, b). Studies of the Milky Way’s radio emission among others enabled us to learn about the nurseries and graveyards of stars (Walsh et al., 1998; Green, 2009; Becker et al., 2010; Peters et al., 2010) and the magnetic field of the Galaxy (Mathewson, 1968; Spoelstra, 1972; Vinyaikin, 1995). Deciphering the diffuse emission mechanisms of the Galaxy at radio frequencies, also enables us to better probe the CMB fluctuations (Jaffe et al., 2004; Eriksen et al., 2006, 2008; Bennett et al., 2013; Planck Collaboration et al., 2014c), thus providing more accurate cosmological information. Knowledge of the spatial morphology and frequency dependence is crucial in an accurate characterization of the foreground emission. Firmly understood components of the diffuse foreground emission include synchrotron, free-free and thermal (vibrational) dust emission. It has been established that free-free is the dominant emission mechanism near the Galactic plane at frequencies between 10 and 100 GHz (Planck Collaboration et al., 2014e).
In recent years an additional Galactic component has been identified. Anomalous Microwave Emission (AME) has been detected in numerous experiments over the frequency range of 10-60 GHz, peaking at 30 GHz in flux density (Kogut et al., 1996; Leitch et al., 1997; de Oliveira-Costa et al., 1997; Lagache, 2003; Casassus et al., 2004; Finkbeiner, 2004; Davies et al., 2006; Dickinson et al., 2007, 2009; Todorović et al., 2010; Gold et al., 2011; Bonaldi & Ricciardi, 2012; Tibbs et al., 2013). This new component also shows a strong correlation with far infrared emission, thus inferring a relation to dust grains (Leitch et al., 1997; Finkbeiner et al., 2004; Planck Collaboration et al., 2011b).
A number of possible emission mechanisms were proposed over the years to interpret this excess emission in the radio. These include hot ( K) free-free (Leitch et al., 1997), flat synchrotron (Bennett et al., 2003), electric dipole radiation from small grains rotating very rapidly (hereafter referred to as spinning dust emission, Draine & Lazarian 1998) and magnetic dipole radiation from thermal fluctuations in the magnetization of the interstellar grains (Draine & Lazarian, 1999). However current observations favour the spinning dust model (Watson et al., 2005; Casassus et al., 2008; AMI collaboration et al., 2010; Planck Collaboration et al., 2011b).
AME has been observed in a number of different environmental conditions throughout the Galaxy. It has been observed in bright HII regions (Dickinson et al., 2007, 2009), molecular clouds (Watson et al., 2005; Casassus et al., 2008; Tibbs et al., 2010), planetary nebulae (Casassus et al., 2004, 2007), dark clouds (Finkbeiner et al., 2002; Casassus et al., 2006; Scaife et al., 2008; Dickinson et al., 2010; Harper et al., 2015), supernova remnants (Scaife et al., 2007), and photodissociation regions (Casassus et al., 2008; Tibbs et al., 2012a). On the other hand only upper limits have been placed for AME in compact HII regions (Scaife et al., 2008).
This paper presents a search for excess emission in a number of bright HII regions and Supernova Remnants (SNRs) near the Galactic plane, at 31 GHz and 45 resolution, using the Cosmic Background Imager (CBI). Most of the regions that this paper focusses on were not surveyed in the past to look for excess emission at these frequencies, while the one of them that has (W40) showed tentative evidence of spinning dust (Finkbeiner, 2004). Additionally the radio emission in all regions of interest shows a strong correlation with the emission in the far infrared (FIR). By using data from the literature convolved to the CBI resolution we estimate the free-free contribution for the sources at 31 GHz and by comparing the results with data taken by the CBI we measure or place upper limits on excess emission in some regions while detect an emission deficit in others. We then use ancillary data to form the SED of the regions at 1∘ resolution. Section 2 describes the CBI and ancillary data that were used, while Section 3 presents the results for each region. Finally conclusions and discussion are given in Section 4.
2 DATA
2.1 Cosmic Background Imager
The Cosmic Background Imager (CBI) was an interferometer array, located in Atacama desert in northern Chile at an altitude of 5080 m (Padin et al., 2002; Taylor et al., 2011). The CBI operated from 1999 to 2008 (CBI1 from 1999 to 2006 and CBI2 from 2006 to 2008). The CBI1 consisted of 13, 0.9 m antennas that were mounted on a 6 m tracking platform. The platform could rotate about the optical axis providing improved u-v coverage. The antennas could take measurements either of right (R) or left (L) circular polarisation, allowing observations in total intensity (RR or LL) or polarisation (RL or LR). Each antenna had a receiver operating between 26 and 36 GHz. This frequency bandwidth was divided into 10 channels of 1 GHz (Padin et al., 2002). The platform supported baselines between 1 and 5.5 m thus providing a maximum resolution of 6′, and a primary beam full width at half maximum (FWHM) of 45.2′ at the central frequency of 31 GHz. The nominal system temperature of the telescope was 30 K. In 2006 the CBI1 was upgraded to CBI2 by replacing the 0.9 m antennas with 1.4 m antennas. This upgrade increased the effective collecting area and allowed observations at higher resolution ( 45) without having to compromise surface brightness sensitivity. The measured CBI2 RMS thermal noise in each frequency channel was at 3.9 Jy s1/2(Pearson et al., 2005; Taylor et al., 2011).
2.2 Observations
This paper presents the results for the observations at 31 GHz of the two regions designated as Area-I and Area-II, and the cloud complex W40 (see Table 1). These short time observations were designed to fit between the longer CMB and SZ experiments conducted by the CBI (refs in preparation).
The two (Area) regions were chosen as they have very bright radio emission that is aligned with the FIR emission, and have not been surveyed in the past at frequencies where AME dominates the spectrum ( 30 GHz). The two regions combined cover an area of 30 deg2. Area-I, consists of 70 individual pointings. The area spans between and in Galactic longitude () and up to in Galactic latitude (). Area-I was observed for 10 days between September and October 2007, with a total integration time of 13.5 hours. Area-II consists of 40 individual pointings. It extends between and in and up to in . Area-II data were collected in a total of 31 days spread across February and April 2008. The total integration time was 26.5 hours. The mapping strategy for both regions was to observe a number of adjacent fields (10 for Area-I and 8 for Area-II) in diameter, over identical ranges in azimuth and elevation, for short time periods ( 2 minutes per field). Each set of adjacent pointings had one or two associated primary flux calibration observations. This strategy was selected to remove the ground spillover that was a problem for the telescope on the shortest baselines.
The W40 complex has been chosen as previous studies of the region showed indications of anomalous emission; Finkbeiner et al. (2004) reported an emission excess at 33 GHz as shown in the spectrum of W40 in fig. 8 of Finkbeiner et al. (2004) where it is evident that the spinning dust model fits the data quite well. W40 is a relatively compact source ( 8′) centred at (l,b) = (8, 5). The W40 data comprise a total of seven hours of lead/trail scans of the region, bracketed by observations of the primary calibrators. The data were collected on six days between June 2006 and May 2008 (Stamadianos, 2010).
| Region | l | b | Total Integration time (hr) | Notes |
|---|---|---|---|---|
| Area-I | – | – | 13.5 | Contains the star forming regions NGC 6334 and NGC 6357. |
| Area-II | – | – | 26.5 | Contains the radio source W51, which in turn is composed of two star-forming regions and an SNR. |
| W40 | 6.7 | Single complex located near the Galactic plane. At radio frequencies W40 is 8 arcmin across. |
2.3 Data reduction and Calibration
The reduction and calibration of the data was performed using the software package CBICAL (developed by T.J. Pearson; see Readhead et al. 2004a, b and references therein). The editing and flagging included removing receivers that were malfunctioning, baselines and channels that were contaminated by non-astronomical signal, and data for which the amplitude and phase of the calibrating sources was not constant in time. Absolute flux calibrations were performed using Jupiter (mainly), Saturn or Tau A tied to the temperature of Jupiter at 33 GHz. We assume a temperature K and a spectral index = (Taylor et al., 2011). The accuracy of the calibrations was limited by telescope phase and amplitude errors and u-v coverage. Comparison of various calibrators over time to estimate the accuracy of the relative flux calibrations indicated that the flux measurements for Area-I, Area-II and W40 were accurate to 6.5 %, 10 % and 5 % respectively.
The dominant source of systematic contamination for the CBI at the level of 0.5 Jy, especially for the shortest baselines was likely due to radiation from the ground (’ground spillover’, Dickinson et al. 2007). For the Area-I and W40 data-sets the ground spillover was removed by performing lead/trail field observations in a differenced mode. Performing the same technique on the Area-II data-set led to a reduction in the signal-to-noise ratio and dynamic range of the lead fields. Therefore we decided to use the data without performing the ground spillover removal. This is not a significant factor as we have found that for sources at the level of 10 Jy (applies for all Area-II sources) the ground signal is negligible.
2.4 Imaging the Data
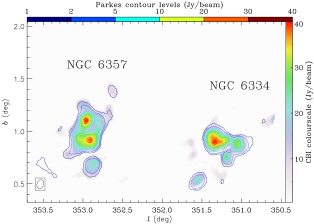
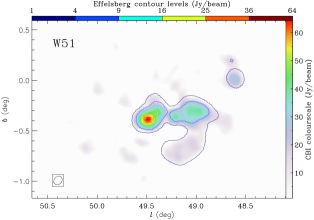
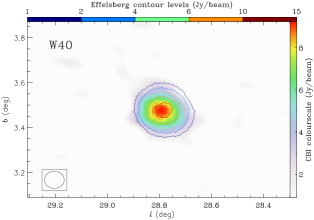
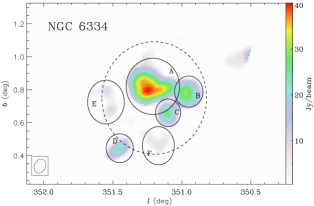
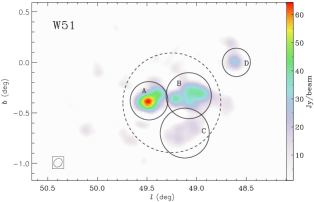
The reduced and calibrated CBI-2 data were imaged using the software DIFMAP (Shepherd et al., 1994). A uniform weighting was selected to provide optimal resolution maps since it was found that our data, due to deconvolution residuals and calibration/pointing errors, were limited by dynamic range at a level of 100:1 (the thermal noise in all maps was 1000:1). Finally the images were primary beam corrected up to the telescope’s FWHM. The CBI CLEANed maps of Area-I, Area-II and W40 are shown in Fig. 1. The peak 31 GHz flux for the two bright sources of emission in the Area-I map are 39.2 Jy/beam and 30.2 Jy/beam. The maximum flux density in the Area-II map is 64.9 Jy/beam, while the peak flux value for W40 is at 9.2 Jy/beam. The synthesised beam for the Area-I and Area-II and W40 CBI maps at 31 GHz are , and , respectively. The measured noise away from any bright sources was found to be 0.05 Jy/beam, for all three data-sets.
2.5 Ancillary Data
To study the morphology of the two regions and to understand the emission mechanisms that are in operation, the CBI maps were compared with maps at different frequencies. The ancillary data used for this survey were acquired through the NASA’s Skyview111Skyview: http://skyview.gsfc.nasa.gov/cgi-bin/query.pl, McGlynn et al. (1998). and the Max Planck Institute for Radioastronomy survey sampler222MPIfR sampler: http://www3.mpifr-bonn.mpg.de/survey.html web services. Table 2 lists the frequencies, angular resolution, units and references for the data.
| Frequency (GHz) | Telescope/Survey | Angular resolution (arcmin) | Units | Reference for the data |
| 0.408 | Haslam | 51 | mK(R-J) | Haslam et al. (1982) |
| 1.4 | NVSS | 0.75 | Jy/Beam | Condon et al. (1998) |
| 2.72 | Effelsberg | 4.3 | mK(R-J) | Furst et al. (1990) |
| 4.85 | GB6 | 3.5 | Jy/Beam | Condon et al. (1991, 1993, 1994) |
| 5.0 | Parkes | 4.1 | mK(R-J) | Haynes et al. (1978) |
| 31 | CBI | 4.5 | Jy/beam | This work |
| 23 | WMAP | 55.8 | mK(CMB) | Bennett et al. (2013) |
| 33 | WMAP | 40.8 | mK(CMB) | Bennett et al. (2013) |
| 41 | WMAP | 31.8 | mK(CMB) | Bennett et al. (2013) |
| 61 | WMAP | 21 | mK(CMB) | Bennett et al. (2013) |
| 94 | WMAP | 13.8 | mK(CMB) | Bennett et al. (2013) |
| 28.4 | Planck LFI | 33 | mK(CMB) | Planck Collaboration et al. (2014a) |
| 44.1 | Planck LFI | 24 | mK(CMB) | Planck Collaboration et al. (2014a) |
| 70.4 | Planck LFI | 14 | mK(CMB) | Planck Collaboration et al. (2014a) |
| 100 | Planck HFI | 9.5 | mK(CMB) | Planck Collaboration et al. (2014a) |
| 143 | Planck HFI | 7.1 | mK(CMB) | Planck Collaboration et al. (2014a) |
| 217 | Planck HFI | 5 | mK(CMB) | Planck Collaboration et al. (2014a) |
| 353 | Planck HFI | 5 | mK(CMB) | Planck Collaboration et al. (2014a) |
| 545 | Planck HFI | 5 | MJy/Sr | Planck Collaboration et al. (2014a) |
| 857 | Planck HFI | 5 | MJy/Sr | Planck Collaboration et al. (2014a) |
| 2997 (100 ) | IRAS | 2 | MJy/Sr | Miville-Deschênes & Lagache (2005) |
| 4995 (60 ) | IRAS | 2 | MJy/Sr | Miville-Deschênes & Lagache (2005) |
| 12875 (25 ) | IRAS | 2 | MJy/Sr | Miville-Deschênes & Lagache (2005) |
| 25750 (12 ) | IRAS | 2 | MJy/Sr | Miville-Deschênes & Lagache (2005) |
Archival maps of the two NGC regions at 5 GHz (after convolving them to the appropriate resolution) are shown as contours in Fig. 1. The contours seem to trace the emission of the CBI maps very well. The offset of the brightest sources on the two maps is 60 arcsec and consistent with pointing errors. The diffuse emission is also traced by the contours. This confirms that the data reduction and alignment procedure that was followed performed as expected. It also shows that most of the emission that has been detected by the CBI strongly correlates with the emission at lower frequencies.
A similar picture was observed when we compared the CBI maps of NGC 6334 and NGC 6357 to data at microwave/IR frequencies. The main discrepancy between the CBI and the lower frequency maps is the diffuse emission east of NGC 6334 detected by the CBI designated as NGC 6334E (see Fig. 2). The diffuse emission at 31 GHz is higher, and has a peak flux at 1.4 Jy/beam, compared to the emission detected by Parkes which has a peak only at 0.8 Jy/beam. Further investigation of the NGC 6334E region showed that the emission detected at 31 GHz exhibits a strong correlation with the emission in FIR frequencies (for more details see Section 3).
We also detect a strong correlation between the CBI map and the Effelsberg map at 2.7 GHz of W51 (see Fig. 1). There is some low level diffuse emission, both to the east and north of the cloud, that is visible only to the CBI, due to the different sensitivity of the telescopes. When we compared the W51 map at 31 GHz to microwave/IR maps we notice that in all cases the bright diffuse emission centred around (l,b) = (491,07), hereafter W51C (see Fig. 2), disappears. The rest of the emission seen both by the CBI and Effelsberg is traced well by the higher frequency maps. The low level diffuse emission traced only by the CBI is not present at FIR frequencies ( 3000 GHz).
Finally we compared the CBI map of W40 against the 353, 545 and 857 GHz Planck maps and the Parkes 5 GHz map (see Fig. 1). We confirm that most of the emission in the area is confined within the 7′ region also detected by the CBI. In Planck maps though the emission is originating from 2 compact like sources around the peak position at 31 GHz. In addition to that in the Planck HFI maps we detect diffuse emission, probably originating from cold dust (), in 2 shell-like regions, surrounding the central W40 area extending up to 1∘ away from the centre. The compact sources and shell-like diffuse emission detected in the HFI Planck maps does not seem to be present in the IRAS maps.
2.6 Measurements and Data fitting
The incomplete u-v coverage of an interferometer can potentially lead to flux loss at scales greater than the synthesised beam ( 6 arcmin for the CBI). To allow a reliable comparison to the CBI data, simulated versions of the Parkes 5 GHz and Effelsberg 2.7 GHz maps of the four sources of emission were created at the CBI’s resolution and u-v coverage. In this way we ensured that any loss of flux density in the CBI maps would also be applied to the ancillary data. To do that the lower frequency maps were first deconvolved with the Richardson-Lucy algorithm. The Richardson-Lucy deconvolution is a Bayesian based iterative procedure for recovering images that were blurred by a known Point Spread Function (Richardson, 1972). Only a small amount of deconvolution is required since the angular resolution of the CBI, Parkes 5 GHz and Effelsberg 2.7 GHz maps is comparable. By comparing a number of deconvolved maps of a given region of the sky we conclude that the process we used is accurate to 1%. Finally the deconvolved ancillary maps were converted to CBI visibilities using the MOCKCBI software package (for references see Section 2.3).
All Area-I, Area-II and W40 measurements were made using aperture photometry. The size and position of each aperture was carefully chosen so that the contamination from nearby sources would be minimised. Additionally bright sources were masked out. Finally the sky contribution was removed. This was done by calculating the median flux density/pixel value within an annulus of an area and inner radius matching the area and radius of the aperture. That value was multiplied by the number of pixels contained in the aperture and was subtracted from the measurement.
The non-constant spectral distribution of our sources affects the wavelength response of the telescopes’ systems. The effect is significant (up to 10 %) mainly in the IRAS, WMAP and Planck data due to the large bandwidths of their frequency bands. The method of adjusting the measured flux density to account for that is called colour correcting (CC). To do that we use the publicly available Planck code and the IRAS and WMAP CC tables.
Using standard propagation of errors we calculate the level of confidence in our measurements. The sources of uncertainties we have taken into account were the CBI calibration errors (see Section 2.3), deconvolution accuracy ( 1 %), uncertainties on the predicted flux at 31 GHz ( 5 %) caused by our confidence level on the assumed spectral index, contamination from the CMB fluctuations (found to be negligible for most cases) and nominal errors quoted in the archival data ( 10 %). Due to the aforementioned sources of uncertainty, on all flux density measurements of NGC 6357, NGC 6334, W51 and W40 where CBI data were used we assign a minimum uncertainty of 4.5, 7, 10 and 5 per cent respectively. All measurements containing Parkes, Effelsberg, Haslam and GB6 data extrapolated to 31 GHz were considered to be accurate to 11.5 %. Finally to all flux density measurements containing IRAS, WMAP and Planck data we assign a conservative minimum 3 per cent uncertainty. Finally the overall uncertainty includes a varying ambiguity in background noise measurements, based on an estimate of the dispersion of the distribution in the background annulus, which was added in quadrature to the uncertainties.
To estimate a possible excess emission at 31 GHz we extrapolated the flux from the lower frequency maps using a power-law fit of the form
| (1) |
assuming a constant free-free spectral index . This should be a good approximation since we expect that the observed radiation at frequencies 1 60 GHz in the absence of Ultra Compact HII (UCHII) regions and AME, to originate from optically thin free-free emission. This type of emission in a typical HII region of our Galaxy has a spectral index and should not vary by more than for a temperature range K (Draine, 2011).
An independent investigation for the source of emission for the regions was conducted using the WMAP, Planck, IRAS, GB6, Haslam and Effelsberg maps convolved to 1∘ resolution.
After measuring the flux of each source, we fit a model of free-free, synchrotron (where appropriate), thermal dust and spinning dust (where appropriate) components:
| (2) |
The free-free flux density assuming an electron temperature =8000 K was fitted as a power-law
| (3) |
where is an approximation of the free-free spectral index calculated in Draine (2011). This expression is in very good agreement with the theoretical values at frequencies between 0.5 and 10000 GHz taking into account the steepening of the free-free spectral index at frequencies GHz.
The synchrotron component used only for W51 was fitted as a power-law with amplitude , and a spectral index calculated using the higher resolution CBI and Effelsberg maps
| (4) |
The thermal dust was fitted as a modified blackbody
| (5) |
where is the optical depth at 250 , is the dust temperature, and is the dust emmisivity index.
Finally the spinning dust flux density was fitted as a reversed lognormal parabola (Eq.10 in Bonaldi et al. 2007 transformed to flux density units)
| (6) |
where and are
| (7) |
| (8) |
60 is the angular coefficient at 60 GHz and is the spinning dust peak frequency.
3 Results
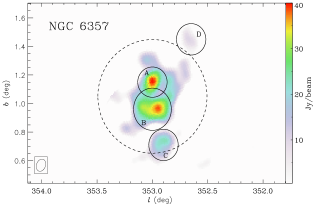
The resolution of the CBI, Parkes and Effelsberg telescopes ( 45) enabled us to discern the internal structure of all three bright sources of emission in Area-I and Area-II. This allowed us to conduct a separate investigation for each of their components. The division for the three sources is illustrated in Fig. 2; NGC 6334 was divided into 6 sub-regions, while both NGC 6357 and W51 were divided into 4 smaller fields. The names of each sub-region are arbitrary. The dashed line denotes that two measurements were taken for that region, one by having masked out the rest of the sub-regions and thus calculating the diffuse emission in the cloud (thereafter CLEAN), and one without doing that.
None of the sources’ components were distinguishable when we convolved the maps at 1∘ resolution. W40 appears to be a compact source even in our higher resolution maps (see Fig. 1); It was therefore treated as a single source throughout the study.
3.1 Analysis at 45 resolution
NGC 6357
The main formations visible in the part of the sky covered by Area-I are NGC 6357 and NGC 6334 (Fig. 1). Russeil et al. (2010) concludes that the extinction and the morphology of the 1.2 mm cold dust emission indicates that both the NGC 6357 and NGC 6334 formations are connected by a filamentary structure, therefore belong to a single complex. Neckel (1978) and Russeil et al. (2012) conclude that both regions are located in the inner edge of the Sagittarius Carina arm at a distance of 1.75 kpc. NGC 6357 is an extended ( 20 pc to 30 pc) region that includes several distinct HII regions in different stages of evolution. At optical wavelengths NGC 6357 exhibits several bubbles and shell-like regions. At radio wavelengths it is dominated by the two components G353.2+0.9 and G353.1+0.6 (fig. 1 in Gvaramadze et al. 2011). Two open clusters, Pismis 24 and AH03 J1725-34.4, are associated with these components respectively (Massi et al., 1997; Gvaramadze et al., 2011). Finally a large number of OB-type stars ( 1500) located mainly close to the centre of NGC 6357 are responsible for the excitation of the ionized nebula (Russeil et al., 2012).
The Russeil et al. (2012) study found that there is more 12 emission normalised to the emission at 60 and 100 in NGC 6357 than in NGC 6334. The normalised 25 is at a similar level in both clouds. Desert et al. (1990) and Galliano et al. (2003) found that polycyclic aromatic hydrocarbons (PAHs) dominate the spectrum at wavelengths while very small grains (VSGs) at wavelengths 25 . VSG radius ranges between , while PAH radius is (Galliano et al., 2003, 2005). The fact that there are more PAHs in NGC 6357 than in NGC 6334 suggests that the former is at a more evolved stage than the latter (Russeil et al., 2012). It also suggests that NGC 6357 may be emitting substantial spinning dust since Ali-Haïmoud et al. (2009) showed that is more likely for the smallest of the VSGs, with a radius 0.5 (i.e the PAHs), to produce electric dipole emission at the observed by many experiments peak frequency of 30 GHz.
The fitted and predicted values that were calculated using the 45 resolution CBI and Parkes maps, are listed in Table 3. The data show that in all sub-regions of NGC 6357 the predicted values for the optically thin free-free emission at 31 GHz agree with the measured values at the 2 level. The emission in the diffuse component of the cloud (NGC 6357 CLEAN) is also consistent with optically thin free-free at the 2 level. It is also likely that the overall absolute calibration for the Parkes map could be overestimated as most of the predicted values are slightly higher than the ones measured in the CBI map. Using only the free-free donimated sub-regions we find that the predicted by Parkes flux is on average higher than the CBI by . This has been taken into account by assigning a conservative limit of 10% uncertainties on the Parkes data. We also investigate if AME is associated with cold dust () emitting thermal radiation. The emission from such low temperature objects should peak at FIR frequencies. We therefore convert the limits on excess emission in the NGC 6357 sub-regions at 31 GHz to a dust emissivity, relative to the IRAS 100- map. From CMB data at high Galactic latitudes, and at frequencies 30 GHz, the AME dust emissivity at 30 GHz has been measured to be 10 K (MJy sr-1)-1 with variations around that value of a factor of 2 (Davies et al., 2006). The average value for the emissivity in the sub-regions corresponds to 2.9 5.4 K (MJy sr-1)-1 or an upper limit in dust emissivity at the 2 level of 13.7 K (MJy sr-1)-1. The upper limit here is therefore consistent with the AME emissivity calculated from high Galactic latitudes, although probably lower due to temperature variations.
| Region | Measured 5GHz [Jy] | Measured 31GHz [Jy] | Predicted 31GHz [Jy] | Excess 31GHz [Jy] | Excess 100- emissivity [K(MJy sr-1)-1] |
|---|---|---|---|---|---|
| NGC 6357 | 331 38 | 266 16 | 266 31 | 75 | 11 |
| NGC 6357A | 110 13 | 80.8 4.9 | 88.3 10.2 | 16.4 | 8.8 |
| NGC 6357B | 152 18 | 122 7 | 122 14 | 35 | 10 |
| NGC 6357C | 23.3 2.7 | 20.2 1.2 | 18.8 2.2 | 7.0 | 27.5 |
| NGC 6357D | 5.0 0.6 | 3.7 0.2 | 4.0 0.5 | 0.8 | 9.1 |
| NGC 6357 CLEAN | 35.1 4.0 | 24.3 1.5 | 28.2 3.2 | 3.6 | 5.3 |
| NGC 6334 | 214 25 | 157 13 | 172 20 | 31 | 4 |
| NGC 6334A | 132 15 | 97.8 8.3 | 106 12 | 20.8 | 4.5 |
| NGC 6334B | 44.6 5.1 | 30.5 2.6 | 35.8 4.1 | 4.1 | 5.6 |
| NGC 6334C | 14.8 1.7 | 10.0 0.9 | 11.9 1.4 | 1.2 | 8.3 |
| NGC 6334D | 15.6 1.8 | 7.2 0.6 | 12.5 1.4 | 5.4 1.4 (3.7) | —- |
| NGC 6334E | 1.6 0.2 | 4.0 0.3 | 1.3 0.2 | 2.7 0.4 (6.4) | 9.9 1.6 (6.4) |
| NGC 6334F | 2.3 0.3 | 1.1 0.1 | 1.8 0.2 | 0.7 0.2 (3.3) | —- |
| NGC 6334 CLEAN | 5.0 0.6 | 3.5 0.3 | 4.0 0.5 | 0.6 | 4.3 |
NGC 6334
NGC 6334 is a bright group of nebulae extending more than 5 along the Galactic plane (McBreen et al., 1979). At a resolution of 45 the nebula is resolved in 3 smaller regions; G351.4+0.7 (hereafter NGC 6334A), G351.0+0.7 (hereafter NGC6334B) and G351.2+0.5 (hereafter NGC6334C). NGC6334A is one of the most active OB star formation region in the Galaxy (Loughran et al., 1986). Across the nebula there are a number of extended far-infrared and millimetre sources and radio HII regions that are associated with CO hot spots, some of them having OH and H2O masers. Each of the regions is at a different evolutionary stage. Additionally in contrast with NGC 6357, NGC 6334 is ionized by a small number of OB stars that are spread around the whole nebula (Tapia et al., 1996; Russeil et al., 2012).
In the results of the investigation that was carried out using the CBI and simulated Parkes maps of NGC 6334 (see Table 3), unlike to NGC 6357, a complex picture emerges. Although for the brightest parts of the nebula (NGC 6334A, NGC 6334B, NGC 6334C) and its diffuse component (NGC 6334 CLEAN) the measured flux density agrees with predicted values for an optically thin free-free dominated region, for the sub-regions NGC 6334D, NGC 6334E and NGC 6334F this is not the case. Relative to a single power-law with slope = 0.12 used to extrapolate the flux from 5 to 31 GHz we detected excess emission in NGC 6334E at 6.4 level and emission deficiency in NGC 6334D and NGC 6334F at 3.7 and 3.3 respectively. The excess emission at 31 GHz for the rest of the NGC 6334 sub-regions were converted to a dust emissivity, relative to the IRAS 100- map. This corresponds to an emissivity of 1.8 2.3 K (MJy sr-1)-1 or a 2 upper limit of 2.8 K (MJy sr-1)-1. For more discussion about the dust emissivity in the clouds see Section 3.3.
NGC 6334D and NGC 6334F
For the three NGC 6334 sub-regions we have found that optically thin free-free is not the only emission mechanism that is active, thus a separate investigation is required. We first focus on the two sub-regions where the emission deficit has been detected. Using the measured flux densities at 5 and 31 GHz we calculate the value for the spectral index of NGC 6334D and NGC 6334F and find it to be and respectively.
NGC 6334F is the SNR G351.2+0.1. Its spectral index at 1 GHz has been measured to be (Caswell et al., 1975; Whiteoak & Green, 1996), consistent with our findings. The lack of any significant spectral breaks denotes that a power-law is a good model for the SED of the source for frequencies between 1 and 30 GHz. The investigation for the source of emission in NGC 6334D focussed on finding SNR candidates by using the D. A. Green SNR catalogue333Green catalogue: http://www.mrao.cam.ac.uk/surveys/snrs.(Green, 2014), and finding Galactic and extragalactic sources that would have a steep spectral index by looking at the Set of Identifications, Measurements and Bibliography for Astronomical Data SIMBAD444SIMBAD: http://simbad.u-strasbg.fr/simbad/. (Wenger et al., 2000) and at the Nasa Extragalactic Database NED555NED: http://ned.ipac.caltech.edu/forms/nearposn.htm. The NASA/IPAC Extragalactic Database (NED) is operated by the Jet Propulsion Laboratory, California Institute of Technology, under contract with the National Aeronautics and Space Administration.. We did not find any synchrotron emission sources in that region of the Galaxy that could account for the emission that has been observed. Looking in the higher resolution 1.4 GHz NVSS map of the region we found two point like sources with peak values at 2.1 Jy/beam and 2.0 Jy/beam. NGC 6334D is also visible on all IRAS and Herchel maps of the region.
The calibration errors alone could not have altered our findings of NGC 6334D by more than 10%. Primary beam errors even as far as 2 times the FWHM of the telescope could not have affected the flux density value of the source by more than 20% either (see left panel of fig. 5 in Taylor et al. 2011). The emission deficit in the region can be accounted for if NGC 6334D is a hotter HII region (=15000 K), and if with the aforementioned sources of errors working together are conspiring to force the spectral index to become steeper. Finally in order to cover all possibilities we speculate that the source is likely to be an unknown SNR, or a distant galaxy with a steep spectral index that happens to lie close to the Galactic plane.
NGC 6334E
As mentioned in Section 2.4, NGC 6334E is a 10 by 10 arcmin2 area east of the main NGC 6334 formation (see Fig. 3). At this point we can not be certain if it is part of the cloud or it happened to lay on the line-of-sight either closer or further away from it. Most of the emission in the sub-region is originating from two compact components, which are connected with a filament. More low level emission is being emitted from the two sources extending further to their east and south-east. Although there is faint to no emission in the sub-region at 5 GHz (see Table.3), NGC 6334E is quite bright in the IR. When we compared the CBI map of the sub-region against maps at higher frequency we find that there is a strong correlation with the IRAS 25 map (shown as contours in Fig. 3), and the Spitzer 24 map indicating that the excess emission we have detected might be spinning dust. There is an offset though of 1.5’ between the two maps. This offset has been observed in previous CBI studies as well. We could have performed a separate investigation for each of the two sources, but due to their small size (smaller than the beam of the CBI), their proximity to each other and to the rest of NGC 6334 we chose to consider them as one source.
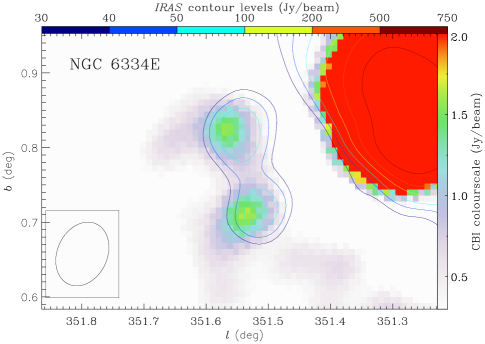
The excess emission detected at the 6.4 level in NGC 6334E clearly shows that the dominant emission mechanism in the region at frequencies between 5 and 31 GHz is not optically thin free-free. Using the measured flux densities at 5 and 31 GHz we calculate the spectral index of the region to have a value of . The excess emission accounts for 70 % of the total emission of the sub-region at 31 GHz. The additional emission that has been observed could originate from the AME mechanism or from free-free emission coming from UCHII regions.
HII regions with an EM cm pc-6 (UCHII regions) will produce free-free emission that is optically thick at frequencies below 15 GHz (Kurtz et al., 1994). In the optically thick regime the flux in the region will increase as , while at higher frequencies it will fall off like . This could mean that although faint at frequencies lower than 15 GHz, these sources could exhibit flux densities of up to 10 Jy at 30 GHz. It is therefore possible that the AME (or a portion of it) that was detected in NGC 6334E could be produced by UCHII regions. There are several methods for calculating the contribution of UCHII in the overall flux of a region. One way involves using high resolution radio data at frequencies below 15 GHz, to identify the point sources in the region. After measuring their EM and assuming an angular size for the sources we extrapolate the flux density at higher frequencies. We looked at the NRAO VLA survey NVSS666NVSS URL: http://www.cv.nrao.edu/nvss/ at 1.4 GHz (Condon et al., 1998) and the Co-Ordinated Radio ’N’ Infrared Survey for High-mass star formation CORNISH777CORNISH URL: http://cornish.leeds.ac.uk/public/index.php at 5 GHz (Hoare et al., 2012; Purcell et al., 2013) to verify if any UCHII are present in the NGC 6334E region, find their optical depth and estimate their contribution to the overall flux that was measured in the CBI final maps at 31 GHz. The optical depth of the brightest source in NGC 6334E at 1.4 GHz, assuming a K, is , i.e we found no significant UCHIIs in the region. Unfortunately the CORNISH survey does not cover this part of the sky. An alternative method, proposed by Dickinson (2013), is to look for UCHII candidates by looking at the colour-colour relation of Wood & Churchwell (1989), who found that UCHII regions tend to have IRAS colour ratios of and . Then by using the empirical relation between the ratio of the flux at 100 and 15 GHz (Kurtz et al., 1994) and a free-free spectral index we extrapolate the flux at 31 GHz (Dickinson, 2013). We looked for sources that matched the aforementioned criteria within 10′ of 351.693+0.579. We found no such sources in the region surrounding NGC 6334E. Both tests leave AME as the most plausible candidate. If NGC 6334E is part of the NGC 6334 cloud it means that AME can be found localised on a part of the cloud where the conditions are right, even if the rest of the structure is free-free dominated.
Such special conditions for AME to be active can be met for example in photodissociation regions (or photon-dominated regions, PDRs, Casassus et al. 2008; Tibbs et al. 2012a). A PDR is a region of interstellar gas that is sufficiently cold to remain neutral, but due to its low column density far-UV photos can penetrate it hence heat it and influence its chemistry. According to current star formation theories PDRs usually form around HII regions, in shell-like structures, separating the ionised and the molecular gas. PAHs are mostly confined in the surrounding PDRs, while the warmer dust is mainly located at the centre of these shell-like regions. Comparing the Spitzer maps of NGC 6334E at 8 (tracing the PAH population) and 24 (tracing the VSGs) we found that no such morphological conditions are present in the sub-region. We then compared the PAH/VSG ratio of NGC 6334E to the rest of the cloud. To do that we normalised the Spitzer 8 emission of each area to the corresponding IRAS 25 emission. We use the IRAS 25 map as a tracer for the VSGs because there are no Spitzer data for the NGC 6334 cloud other than for NGC 6334E. The 8/24 flux (and i.e PAH/VSG) ratio for NGC 6334 and NGC 6334E was found to be 0.25 and 0.95 respectively. This much higher PAH/VSG ratio in NGC 6334E compared to the rest of the cloud indicates that the whole sub-region might be a PDR of NGC 6334.
Finally we use the Planck maps at 147, 353, 454 and 857 GHz and the IRAS 100 map (after sampling them to the u-v coverage of the CBI) to fit for the thermal dust optical depth of NGC 6334E at 1.2 THz (). We then normalise the excess emission measured in the CBI map with the optical depth at 1.2 THz to calculate the AME emissivity of the sub-region at 31 GHz relative to . We find it to be equal to (1.0 0.2) Jy. For further discussion about AME emissivities in the clouds see Section 3.3.
W51
In the second data-set (Area-II) one important formation is visible, the W51 complex. W51 is a massive molecular complex located at the tangential point of the Sagittarius arm of the Galaxy at a distance of 5.5 kpc (Sato et al., 2010). W51, as seen in the radio band images, can be divided into three main components. W51A and W51B are two star forming regions that form what is called the W51 giant molecular cloud (W51 GMC), which spreads across an area of 1 deg2. W51C is a diffuse and extended component that is attached to the south-eastern boundary of W51B and expands to the east. W51C was identified as a supernova remnant (SNR) and is estimated to be around 30 years old (Koo et al., 1995). Finally the existence of two 1720 MHz OH masers and the detection of about 100 solar masses of atomic gas at a velocity shifted between 20 and 120 kms-1 with respect to its ambient medium (Green et al., 1997; Koo & Moon, 1997) suggest that there is interaction between the two regions, W51B and W51C.
The results for the investigation that was carried out using the CBI and Effelsberg maps are shown in Table 4. The predicted optically thin free-free and measured integrated flux densities of W51A, W51B, W51D and W51 CLEAN are in agreement at the 2 level. The predicted optically thin free-free overall flux for the region is higher though than the one measured in the CBI maps by 15 % (1). This could be either due to calibration errors (see Section 2.3) or due to the additional synchrotron emission at low radio frequencies that was recorded in W51C at the 6.5 significance level.
| Region | Measured 2.7GHz [Jy] | Measured 31GHz [Jy] | Predicted 31GHz [Jy] | Excess 31GHz [Jy] | Excess 100- emissivity [K(MJy sr-1)-1] |
|---|---|---|---|---|---|
| W51 | 354 41 | 231 23 | 264 30 | 37 | 5 |
| W51A | 150 17 | 117 12 | 112 13 | 37 | 9 |
| W51B | 95.5 11.0 | 63.8 6.4 | 71.3 8.2 | 11.6 | 5.5 |
| W51C | 49.0 5.6 | 11.7 1.2 | 36.6 4.2 | 24.9 3.8 (6.5) | —- |
| W51D | 9.5 1.1 | 7.5 0.8 | 7.1 0.8 | 2.5 | 8.0 |
| W51 CLEAN | 40.5 4.7 | 25.0 2.5 | 30.2 3.5 | 2.6 | 2.6 |
| W40 | 31.5 3.4 | 28.1 1.7 | 23.5 2.5 | 10.6 | 8.2 |
We can once again convert the limits on excess emission in the sub-regions of the W51 (besides W51C) at 31 GHz to a dust emissivity, relative to the IRAS 100 map (Table 4). The values that were calculated are considerably lower though than the values that were found in diffuse regions at high Galactic latitudes. The mean dust emissivity of the sub-regions is 1.5 3.3 K (MJy sr-1)-1 which corresponds to a 2 limit of K (MJy sr-1)-1.
W51C
The quoted spectral index of W51C at 1 GHz is =0.3 (Shaver & Goss, 1970; Velusamy & Kundu, 1974; Subrahmanyan & Goss, 1995), confirming that the dominant emission mechanism in the region is synchrotron radiation. W51C is a type S SNR with an age of 3 yr (Hanabata et al., 2013; Park et al., 2013). Using CBI and Effelsberg data we calculate a spectral index of =0.580.06. This value indicates spectral ageing of the more energetic electrons resulting in a steeper index at about a few GHz.
Assuming now that all the emission in W51C at 31 GHz is due to free-free we extrapolate to 2.7 GHz to find S= Jy. We then subtract that value from the measured flux of W51C at 2.7 GHz to find S= Jy. We therefore conclude that at least 70 % of the flux of W51C and 10% of W51 at 2.7 GHz is due to synchrotron radiation.
W40
W40 is an HII complex 8′ in diameter. A number of energy sources reside inside this cloud, with the most prominent being three young and large OB stars giving rise to ionising UV radiation (Zeilik & Lada, 1978). Rodney & Reipurth (2008) found a total of 20 radio sources, half of which presented fluctuations in their flux over time. Their results were recently confirmed by VLA observations in radio frequencies (Rodríguez et al., 2010). The same authors speculate on the nature of these sources suggesting that they may be combination of ultra compact HII regions, young stellar objects (YSOs) and shocked interstellar gas. Finally, a thick dust cloud heavily reduces the visibility of W40 to such an extent that we cannot view a significant portion of W40 in the optical and IR bands (Reylé & Robin, 2002; Rodríguez et al., 2010). The distance to W40 has not been well determined yet. Estimates give values between 0.3 and 0.9 kpc (Radhakrishnan et al., 1972). The mass of the cloud has been estimated to be around 10 (Zhu et al., 2006).
Assuming a free-free spectral index = we find that the measured fluxes at 2.7 GHz and 31 GHz agree at the 2 level (see Table 4). We therefore conclude that at 68 % and 95 % confidence limits that the AME in the region is S7.6 Jy and S10.6 Jy, respectively. Once again the excess emission was converted to dust emissivity relative to the IRAS maps 100 , returning a value of 3.7 2.4 K(MJy sr-1)-1.
3.2 Analysis at 1∘ resolution
The Spectral Energy Distributions (SEDs) at 1∘ scale for NGC 6357, NGC 6334, W51 and W40 are shown in Fig. 4. Solid black circles show the Planck data at 100 and 217 GHz. These points were identified as being consistently higher than the rest due to contamination by strong CO line emission at 115 and 230 GHz, so they were not considered during the parameter fitting stage (Planck Collaboration et al., 2014b). Table 5 summarises the results. From the four plots we can infer that there is a small excess emission in all 4 regions at 31 GHz although too faint to be definitively detected. It might be that AME is present in all 4 cases or that there is an unknown source of systematics in the data. We do not expect though that systematics of that level would significantly bias our results.
For NGC 6357 we find that our fitted values for the optical depth at 1.2 THz , the dust temperature K and the dust emissivity are consistent at the 2 level with the results of Planck Collaboration et al. (2014d). We also find that at 28.4 GHz the overall flux density of NGC 6357 is consistent with a free-free emission at the 2 level ( = Jy). The emissivity of the cloud at 28.4 GHz relative to is Jy, a value also consistent at the 2 level with the results of Planck Collaboration et al. (2014d).


| Region | [Jy] | / [Jy] | Asd [Jy] | [GHz] | |||||
| NGC 6334 | 24.1 3.8 | 19.9 0.5 | 1.93 0.06 | 43.2 25.2 | 1.4 0.8 | 1.7 | – | – | – |
| NGC 6357 | 23.0 3.8 | 21.3 0.7 | 1.81 0.07 | 45.1 34.5 | 1.5 1.2 | 1.3 | – | – | – |
| W51 | 11.3 2.3 | 20.7 0.8 | 1.82 0.09 | 60.1 25.0 | 4.1 1.8 | 2.3 | – | – | – |
| W40 | 3.9 0.3 | 21.7 0.6 | 1.60 0.06 | 6.2 1.9 | 1.6 0.5 | 3.3 | 6.4 | 7.1 2.8 | 37.6 4.3 |
For NGC 6334 the results indicate that the cloud is dominated by optically thin free-free in the frequency range of 20-80 GHz and if additional radiation is emitted from any part of the nebula, is not significant enough (AME significance = 1.3) to make a difference in the overall flux that we have measured. The fitted values for , Td and are , K and respectively. The limits on excess emission at 28.4 GHz were once again used to calculate the emissivity relative to corresponding to a value of Jy.
The SED of W51 is shown in the bottom-left panel of Fig. 4. To account for the synchrotron emission that was detected earlier we additionally use the Haslam 408 MHz map and the Effelsberg 2.7 GHz and fit a power-law with a fixed spectral index (value calculated using the CBI and Effelsberg maps). The results show that synchrotron accounts for 25% of the emission of the cloud at 408 MHz, 10% at 2.7 GHz, and is negligible at higher frequencies. These findings are in good agreement with our results on W51C at 4.5′ resolution. We also fit for , d and and find that they are equal to , K and respectively. Finally we calculated the emissivity at 28.4 GHz relative to and found it to be equal to Jy.
The SED of W40 calculated at 1∘ resolution is shown in Fig. 4. The fitted values for , d and are , K and respectively. To better constrain the free-free component in the region, in addition to the WMAP and Planck maps, we use the Effelsberg map at 2.7 GHz and the GB6 map at 4.8 GHz. We detect a slightly rising spectrum at frequencies between 20 and 40 GHz where the spinning dust emission mechanism is expected to be active. There is on average an additional 20 % more emission than what it was anticipated. At 28.4 GHz AME was detected at the 3.3 level, while the cumulative AME detection between 10 and 100 GHz was at the 6.4 level. These findings are in agreement with Finkbeiner et al. (2004) who noted an excess at 30 GHz.
An investigation for UCHII regions within a 30′ radius from W40, using the IRAS data and the colour-colour relation of Wood & Churchwell 1989 (see Section 3) revealed two UCHII candidates. The estimated upper limit on the combined flux density of the two sources at GHz, based on the empirical relation between the flux density of a source at 100 m and 15 GHz (Kurtz et al., 1994) and a free-free spectral index = -, is Jy. This value accounts for % of the detected excess emission in the area. Using the NVSS data at 1.4 GHz to identify point sources around W40 we found one potential UCHII region. The derived optical depth of the source, assuming an electron temperature of = K, is 0.01 1. Unfortunately no CORNISH data of the region are available. Our study has shown that no significant contribution from UCHII regions is expected at frequencies 30 GHz leaving the spinning dust emission mechanism as the only known valuable alternative.
We therefore fit a spinning dust component to the spectral energy distribution of W40 (shown as a treble dot-dashed line in the SED of W40 in Fig. 4, and emphasised in the sub-figure of the same plot) which in turn reduces the value of by 15 with only 3 additional parameters. The fitted flux density and peak frequency are = 7.1 2.8 Jy ( 2.7) and 37.6 4.3 GHz. These values are also in good agreement with Finkbeiner et al. (2004). Planck Collaboration et al. (2014d) on the other hand detected an AME significance in the region of only 0.2. The results depend significantly on the two higher uncertainty lower frequency data, not used by the Planck collaboration, since they are the ones constraining the level of free-free in the region. The values constrained by the thermal dust component of the SED on the other hand (, d and ), are consistent with the values calculated in Planck Collaboration et al. (2014d) at the 1 level. The results are also consistent with our CBI-Efflesberg study of the region at the 1 level. Finally we calculated the AME emissivity at 28.4 GHz relative to the optical depth at 1.2 THz, and found it to be (1.6 0.5) Jy.
3.3 AME emissivities
The unweighted mean value of the dust emissivity relative to the IRAS-100 maps of the 14 sub-regions of NGC 6334, NGC 6357 and W51 and of W40 is K(MJy sr-1)-1. At the 2 confidence level this is equivalent to K(MJy sr-1)-1. This value is somewhat lower than the K(MJy sr-1)-1 calculated in cooler regions (Davies et al., 2006). This lower ratio is more likely to arise, if AME is due to the spinning dust emission mechanism, due to the fact that the hotter HII region environments destroy the smaller grains which give a rise in the spectrum at frequencies 30 GHz (Povich et al., 2007). It could also be due to the fact that the emissivity drops by a factor of 10 when we move from 20 to 30 K (Tibbs et al., 2012b). It is more appropriate to calculate the emissivity relative to other standards, like the optical depth, which is an indicator of the column density relative to hydrogen (Finkbeiner et al., 1999, 2004).
Calculating the AME emissivity of the 4 regions at 28.4 GHz relative to the optical depth at 1.2 THz, , was found to always lie on the order of Jy, and appears to be independent of the AME significance (see Table 5). This suggests that the AME is proportional to the dust column density independant of how strong the AME source is, in agreement with the results of Planck Collaboration et al. (2014d). The unweighted and weighted average AME emissivity of the four regions relative to dust column density is Jy and Jy respectively. The AME emissivity of NGC 6334E at 31 GHz relative to was also calculated to be equal to . The unweighted and weighted AME emissivities quoted in Planck Collaboration et al. (2014d) are and respectively, being in agreement with our results at the 2 level.
4 Conclusions
In this paper we present the results of the investigation for the source of emission for the Galactic regions NGC 6357, NGC 6334, W51 and W40. CBI observations of the four regions were conducted at 45 resolution.
We have confirmed both using high resolution ( 45) interferometric data and single dish data convolved at 1∘ resolution that the source of emission at frequencies between 20 and 80 GHz in NGC 6357 is consistent with optically thin free-free at the 2 level. For frequencies 100 GHz thermal dust takes over in NGC 6357 as in the rest of the clouds.
The main source of emission in NGC 6334 at 1∘ resolution and in the frequency range of 20-80 GHz is optically thin free-free. Using the higher resolution interferometric data though we detected that at 31 GHz, 3 of the cloud’s sub-regions, designated as NGC 6334D, NGC 6334E and NGC 6334F were inconsistent with the extrapolated from lower frequency data optically thin free-free, at the 2 level. NGC 6334D and NGC 6334F show a lack of emission relative to the predicted optically thin free-free at 3.3 and 3.7 respectively. NGC 6334F is a known SNR with a spectral index of 0.4 consistent with values from the literature. We could not identify a source (or group of sources) that match the spectral characteristics found in NGC 6334D. We therefore conclude that the sub-region might be an unknown SNR.
We also detected an excess emission compared to the predicted free-free in NGC 6334E at 6.4. We ruled out the possibility that the excess emission is due to UCHII regions. We calculated the AME emissivity for the sub-region at 31 GHz relative to the optical depth at 1.2 THz and find it to be equal to (1.00.2) Jy. The PAH/VSG ratio in NGC 6334E compared to the rest of NGC 6334 suggests that the former might be a PDR of the latter.
The emission detected in all sub-regions of W51 other than W51C at frequencies between 20 and 80 GHz is due to optically thin free-free. W51C on the other hand is an SNR with a spectral index of 0.58. Synchrotron accounts for 70% of the measured flux of W51C and 10 % of the W51 cloud at 2.7 GHz. The results are consistent both using the higher resolution interferometric data and the lower resolution single dish data.
Although optically thin free-free is the dominant emission mechanism in W40 in the frequency range of 20-80 GHz we detected a spinning dust component at 3.3, that accounts up to 20% of its total emission at the peak frequency GHz.
Finally we calculated the AME emissivity at 31 GHz of all sub-regions of the clouds relative to maps at 100 . We find an average value of K(MJy sr-1)-1. This value is lower than the 10 K(MJy sr-1)-1 measured at high Galactic latitudes (Davies et al., 2006), probably due to temperature variations. We also calculated the AME emissivity of the 4 regions at 28.4 GHz, and the AME emissivity of NGC 6334E at 31 GHz relative to the optical depth at 1.2 THz. This form of emissivity in all 4 regions and the NGC 6334E sub-region lies somewhere on the order of Jy, and is independent of the AME significance, similar to recent findings of Planck Collaboration et al. (2014d).
AME is a significant component of the spectrum at frequencies around 30 GHz, for a number of sources in our Galaxy. Additionally AME seems to be present mainly in diffuse parts of the Galaxy. NGC 6334E should be followed-up at higher resolution and at frequencies 30 GHz.
Acknowledgements
This work was supported by the Strategic Alliance for the Implementation of New Technologies (SAINT - see www.astro.caltech.edu/chajnantor/saint/index.html) and we are most grateful to the SAINT partners for their strong support. We gratefully acknowledge support from the Kavli Operating Institute and thank B. Rawn and S. Rawn Jr. The CBI was supported by NSF grants 9802989, 0098734 and 0206416, and a Royal Society Small Research Grant. We are particularly indebted to the engineers who maintained and operated the CBI: Cristóbal Achermann, José Cortés, Cristóbal Jara, Nolberto Oyarace, Martin Shepherd and Carlos Verdugo.
Constantinos Demetroullas is grateful to Anna Bonaldi for clarifying the equation for fitting spinning dust and to Matias Vidal for his valuable comments and support throughout many stages of this study. Constantinos also acknowledges the support of a STFC quota studentship and a President’s Doctoral Scholarship from the University of Manchester and he is grateful to the European Research Council for support through the award of an ERC Starting Independent Researcher Grant (EC FP7 grant number 280127). Clive Dickinson is supported by an STFC Consolidated Grand (no. ST/L000768/1), an EU Marie Curie Re-Integration Grant and an ERC Starting Grant (No. 307209). Constantinos and Clive would like to thank NVSS, CORNISH, NED, SIMBAD and Green catalogue.
References
- Ali-Haïmoud et al. (2009) Ali-Haïmoud Y., Hirata C. M., Dickinson C., 2009, MNRAS, 395, 1055
- AMI collaboration et al. (2010) AMI collaboration, Scaife A. M. M., Nikolic B., et al., 2010, MNRAS, 406, L45
- Becker et al. (2010) Becker R. H., Helfand D. J., White R. L., Proctor D. D., 2010, AJ, 140, 157
- Bennett et al. (2003) Bennett C. L., Halpern M., Hinshaw G., et al., 2003, ApJS, 148, 1
- Bennett et al. (2013) Bennett C. L., Larson D., Weiland J. L., et al., 2013, ApJS, 208, 20
- Bonaldi & Ricciardi (2012) Bonaldi A., Ricciardi S., 2012, Advances in Astronomy, 2012
- Bonaldi et al. (2007) Bonaldi A., Ricciardi S., Leach S., Stivoli F., Baccigalupi C., de Zotti G., 2007, MNRAS, 382, 1791
- Casassus et al. (2006) Casassus S., Cabrera G. F., Förster F., Pearson T. J., Readhead A. C. S., Dickinson C., 2006, ApJ, 639, 951
- Casassus et al. (2008) Casassus S., Dickinson C., Cleary K., et al., 2008, MNRAS, 391, 1075
- Casassus et al. (2007) Casassus S., Nyman L.-Å., Dickinson C., Pearson T. J., 2007, MNRAS, 382, 1607
- Casassus et al. (2004) Casassus S., Readhead A. C. S., Pearson T. J., Nyman L.-Å., Shepherd M. C., Bronfman L., 2004, ApJ, 603, 599
- Caswell et al. (1975) Caswell J. L., Clark D. H., Crawford D. F., Green A. J., 1975, Australian Journal of Physics Astrophysical Supplement, 37, 1
- Condon et al. (1991) Condon J. J., Broderick J. J., Seielstad G. A., 1991, AJ, 102, 2041
- Condon et al. (1994) Condon J. J., Broderick J. J., Seielstad G. A., Douglas K., Gregory P. C., 1994, AJ, 107, 1829
- Condon et al. (1998) Condon J. J., Cotton W. D., Greisen E. W., et al., 1998, AJ, 115, 1693
- Condon et al. (1993) Condon J. J., Griffith M. R., Wright A. E., 1993, AJ, 106, 1095
- Davies et al. (2006) Davies R. D., Dickinson C., Banday A. J., Jaffe T. R., Górski K. M., Davis R. J., 2006, MNRAS, 370, 1125
- de Oliveira-Costa et al. (1997) de Oliveira-Costa A., Kogut A., Devlin M. J., Netterfield C. B., Page L. A., Wollack E. J., 1997, ApJL, 482, L17
- Desert et al. (1990) Desert F.-X., Boulanger F., Puget J. L., 1990, A&A, 237, 215
- Dickinson (2013) Dickinson C., 2013, Advances in Astronomy, 2013
- Dickinson et al. (2010) Dickinson C., Casassus S., Davies R. D., et al., 2010, MNRAS, 407, 2223
- Dickinson et al. (2009) Dickinson C., Davies R. D., Allison J. R., et al., 2009, ApJ, 690, 1585
- Dickinson et al. (2007) Dickinson C., Davies R. D., Bronfman L., et al., 2007, MNRAS, 379, 297
- Draine (2011) Draine B. T., 2011, Physics of the Interstellar and Intergalactic Medium
- Draine & Lazarian (1998) Draine B. T., Lazarian A., 1998, ApJ, 508, 157
- Draine & Lazarian (1999) Draine B. T., Lazarian A., 1999, ApJ, 512, 740
- Eriksen et al. (2006) Eriksen H. K., Dickinson C., Lawrence C. R., et al., 2006, ApJ, 641, 665
- Eriksen et al. (2008) Eriksen H. K., Jewell J. B., Dickinson C., Banday A. J., Górski K. M., Lawrence C. R., 2008, ApJ, 676, 10
- Finkbeiner (2004) Finkbeiner D. P., 2004, ApJ, 614, 186
- Finkbeiner et al. (1999) Finkbeiner D. P., Davis M., Schlegel D. J., 1999, ApJ, 524, 867
- Finkbeiner et al. (2004) Finkbeiner D. P., Langston G. I., Minter A. H., 2004, ApJ, 617, 350
- Finkbeiner et al. (2002) Finkbeiner D. P., Schlegel D. J., Frank C., Heiles C., 2002, ApJ, 566, 898
- Furst et al. (1990) Furst E., Reich W., Reich P., Reif K., 1990, A&AS, 85, 691
- Galliano et al. (2005) Galliano F., Madden S. C., Jones A. P., Wilson C. D., Bernard J.-P., 2005, A&A, 434, 867
- Galliano et al. (2003) Galliano F., Madden S. C., Jones A. P., Wilson C. D., Bernard J.-P., Le Peintre F., 2003, A&A, 407, 159
- Gold et al. (2011) Gold B., Odegard N., Weiland J. L., et al., 2011, ApJS, 192, 15
- Green et al. (1997) Green A. J., Frail D. A., Goss W. M., Otrupcek R., 1997, AJ, 114, 2058
- Green (2009) Green D. A., 2009, Bulletin of the Astronomical Society of India, 37, 45
- Green (2014) Green D. A., 2014, Bulletin of the Astronomical Society of India, 42, 47
- Gvaramadze et al. (2011) Gvaramadze V. V., Kniazev A. Y., Kroupa P., Oh S., 2011, A&A, 535, A29
- Hanabata et al. (2013) Hanabata Y., Sawada M., Katagiri H., Bamba A., Fukazawa Y., 2013, Publications of the Astronomical Society of Japan, 65, 2
- Harper et al. (2015) Harper S. E., Dickinson C., Cleary K., 2015, ArXiv e-prints
- Haslam et al. (1982) Haslam C. G. T., Salter C. J., Stoffel H., Wilson W. E., 1982, A&AS, 47, 1
- Haynes et al. (1978) Haynes R. F., Caswell J. L., Simons L. W. J., 1978, Australian Journal of Physics Astrophysical Supplement, 45, 1
- Hoare et al. (2012) Hoare M. G., Purcell C. R., Churchwell E. B., et al., 2012, PASP, 124, 939
- Jaffe et al. (2004) Jaffe A. H., Balbi A., Bond J. R., et al., 2004, ApJ, 615, 55
- Kogut et al. (1996) Kogut A., Banday A. J., Bennett C. L., Gorski K. M., Hinshaw G., Reach W. T., 1996, ApJ, 460, 1
- Koo et al. (1995) Koo B.-C., Kim K.-T., Seward F. D., 1995, ApJ, 447, 211
- Koo & Moon (1997) Koo B.-C., Moon D.-S., 1997, ApJ, 475, 194
- Kurtz et al. (1994) Kurtz S., Churchwell E., Wood D. O. S., 1994, ApJS, 91, 659
- Lagache (2003) Lagache G., 2003, A&A, 405, 813
- Leitch et al. (1997) Leitch E. M., Readhead A. C. S., Pearson T. J., Myers S. T., 1997, ApJL, 486, L23
- Loughran et al. (1986) Loughran L., McBreen B., Fazio G. G., et al., 1986, ApJ, 303, 629
- Massi et al. (1997) Massi F., Brand J., Felli M., 1997, A&A, 320, 972
- Mathewson (1968) Mathewson D. S., 1968, ApJL, 153, L47
- McBreen et al. (1979) McBreen B., Fazio G. G., Stier M., Wright E. L., 1979, ApJL, 232, L183
- McGlynn et al. (1998) McGlynn T., Scollick K., White N., 1998, in New Horizons from Multi-Wavelength Sky Surveys, edited by B. J. McLean, D. A. Golombek, J. J. E. Hayes, H. E. Payne, vol. 179 of IAU Symposium, 465
- Miville-Deschênes & Lagache (2005) Miville-Deschênes M.-A., Lagache G., 2005, ApJS, 157, 302
- Neckel (1978) Neckel T., 1978, A&A, 69, 51
- Padin et al. (2002) Padin S., Shepherd M. C., Cartwright J. K., et al., 2002, PASP, 114, 83
- Park et al. (2013) Park G., Koo B.-C., Gibson S. J., et al., 2013, ApJ, 777, 14
- Pearson et al. (2005) Pearson T. J., Mason B. S., Padin S., et al., 2005, in New Cosmological Data and the Values of the Fundamental Parameters, edited by A. N. Lasenby, A. Wilkinson, vol. 201 of IAU Symposium, 23
- Peters et al. (2010) Peters T., Banerjee R., Klessen R. S., Mac Low M.-M., Galván-Madrid R., Keto E. R., 2010, ApJ, 711, 1017
- Planck Collaboration et al. (2011a) Planck Collaboration, Abergel A., Ade P. A. R., et al., 2011a, A&A, 536, A21
- Planck Collaboration et al. (2011b) Planck Collaboration, Ade P. A. R., Aghanim N., et al., 2011b, A&A, 536, A20
- Planck Collaboration et al. (2014a) Planck Collaboration, Ade P. A. R., Aghanim N., et al., 2014a, A&A, 571, A1
- Planck Collaboration et al. (2014b) Planck Collaboration, Ade P. A. R., Aghanim N., et al., 2014b, A&A, 571, A13
- Planck Collaboration et al. (2014c) Planck Collaboration, Ade P. A. R., Aghanim N., et al., 2014c, A&A, 571, A16
- Planck Collaboration et al. (2014d) Planck Collaboration, Ade P. A. R., Aghanim N., et al., 2014d, A&A, 565, A103
- Planck Collaboration et al. (2014e) Planck Collaboration, Ade P. A. R., Aghanim N., et al., 2014e, ArXiv e-prints:1406.5093
- Povich et al. (2007) Povich M. S., Stone J. M., Churchwell E., et al., 2007, ApJ, 660, 346
- Purcell et al. (2013) Purcell C. R., Hoare M. G., Cotton W. D., et al., 2013, ApJS, 205, 1
- Radhakrishnan et al. (1972) Radhakrishnan V., Goss W. M., Murray J. D., Brooks J. W., 1972, ApJS, 24, 49
- Readhead et al. (2004a) Readhead A. C. S., Mason B. S., Contaldi C. R., et al., 2004a, ApJ, 609, 498
- Readhead et al. (2004b) Readhead A. C. S., Myers S. T., Pearson T. J., et al., 2004b, Science, 306, 836
- Reylé & Robin (2002) Reylé C., Robin A. C., 2002, A&A, 384, 403
- Richardson (1972) Richardson W. H., 1972, Journal of the Optical Society of America (1917-1983), 62, 55
- Rodney & Reipurth (2008) Rodney S. A., Reipurth B., 2008, The W40 Cloud Complex, 683
- Rodríguez et al. (2010) Rodríguez L. F., Rodney S. A., Reipurth B., 2010, AJ, 140, 968
- Russeil et al. (2012) Russeil D., Zavagno A., Adami C., et al., 2012, A&A, 538, A142
- Russeil et al. (2010) Russeil D., Zavagno A., Motte F., Schneider N., Bontemps S., Walsh A. J., 2010, A&A, 515, A55
- Sato et al. (2010) Sato M., Reid M. J., Brunthaler A., Menten K. M., 2010, ApJ, 720, 1055
- Scaife et al. (2007) Scaife A., Green D. A., Battye R. A., et al., 2007, MNRAS, 377, L69
- Scaife et al. (2008) Scaife A. M. M., Hurley-Walker N., Davies M. L., et al., 2008, MNRAS, 385, 809
- Shaver & Goss (1970) Shaver P. A., Goss W. M., 1970, Australian Journal of Physics Astrophysical Supplement, 14, 133
- Shepherd et al. (1994) Shepherd M. C., Pearson T. J., Taylor G. B., 1994, in Bulletin of the American Astronomical Society, vol. 26 of Bulletin of the American Astronomical Society, 987–989
- Spoelstra (1972) Spoelstra T. A. T., 1972, A&A, 21, 61
- Stamadianos (2010) Stamadianos D., 2010, Microwave Observations of W40, Master’s thesis, The University of Manchester
- Subrahmanyan & Goss (1995) Subrahmanyan R., Goss W. M., 1995, MNRAS, 275, 755
- Tapia et al. (1996) Tapia M., Persi P., Roth M., 1996, A&A, 316, 102
- Taylor et al. (2011) Taylor A. C., Jones M. E., Allison J. R., et al., 2011, MNRAS, 418, 2720
- Tibbs et al. (2012a) Tibbs C. T., Paladini R., Compiègne M., et al., 2012a, ApJ, 754, 94
- Tibbs et al. (2012b) Tibbs C. T., Paladini R., Dickinson C., 2012b, Advances in Astronomy, 2012
- Tibbs et al. (2013) Tibbs C. T., Scaife A. M. M., Dickinson C., et al., 2013, ApJ, 768, 98
- Tibbs et al. (2010) Tibbs C. T., Watson R. A., Dickinson C., et al., 2010, MNRAS, 402, 1969
- Todorović et al. (2010) Todorović M., Davies R. D., Dickinson C., et al., 2010, MNRAS, 406, 1629
- Velusamy & Kundu (1974) Velusamy T., Kundu M. R., 1974, A&A, 32, 375
- Vinyaikin (1995) Vinyaikin E. M., 1995, Astronomy Reports, 39, 599
- Walsh et al. (1998) Walsh A. J., Burton M. G., Hyland A. R., Robinson G., 1998, MNRAS, 301, 640
- Watson et al. (2005) Watson R. A., Rebolo R., Rubiño-Martín J. A., et al., 2005, ApJL, 624, L89
- Wenger et al. (2000) Wenger M., Ochsenbein F., Egret D., et al., 2000, A&AS, 143, 9
- Whiteoak & Green (1996) Whiteoak J. B. Z., Green A. J., 1996, A&AS, 118, 329
- Wood & Churchwell (1989) Wood D. O. S., Churchwell E., 1989, ApJ, 340, 265
- Zeilik & Lada (1978) Zeilik II M., Lada C. J., 1978, ApJ, 222, 896
- Zhu et al. (2006) Zhu L., Wu Y.-F., Wei Y., 2006, cjaa, 6, 61