A Test of Cosmological Models using high- Measurements of
Abstract
The recently constructed Hubble diagram using a combined sample of SNLS and SDSS-II Type Ia SNe, and an application of the Alcock-Paczyński (AP) test using model-independent Baryon Acoustic Oscillation data, have suggested that the principal constraint underlying the cosmic expansion is the total equation-of-state of the cosmic fluid, rather than that of its dark energy. These studies have focused on the critical redshift range () within which the transition from decelerated to accelerated expansion is thought to have occurred, and they suggest that the cosmic fluid has zero active mass, consistent with a constant expansion rate. The evident impact of this conclusion on cosmological theory calls for an independent confirmation. In this paper, we carry out this crucial one-on-one comparison between the Universe (an FRW cosmology with zero active mass) and CDM/CDM, using the latest high- measurements of . Whereas the Type Ia SNe yield the integrated luminosity distance, while the AP diagnostic tests the geometry of the Universe, the Hubble parameter directly samples the expansion rate itself. We find that the model-independent cosmic chronometer data prefer over CDM/CDM with a BIC likelihood of versus only , in strong support of the earlier SNeIa and AP results. This contrasts with a recent analysis of data based solely on BAO measurements which, however, strongly depend on the assumed cosmology. We discuss why the latter approach is inappropriate for model comparisons, and emphasize again the need for truly model-independent observations to be used in cosmological tests.
1 Introduction
Modern cosmology is based on the Friedmann-Robertson-Walker (FRW) metric to describe the spacetime expansion of the cosmic fluid, often assumed to be shear free (i.e., ‘perfect’), and comprised of at least three components. Two of these, matter () and radiation (), are readily observed, while the third, a poorly understood ‘dark energy’ (), is inferred from the analysis of the distance-redshift relationship in Type Ia SNe (Perlmutter et al. 1998; Riess et al. 1998; Schmidt et al. 1998). The standard model of cosmology, which we refer to as CDM when is a cosmological constant with equation-of-state , and CDM when it is not, adopts these elements, but the poorly known burdens the theory with several unknown parameters that need to be optimized while fitting the data.
In spite of this limitation, CDM/CDM has done remarkably well in accounting for the observations, though the ever improving precision of the various measurements is beginning to uncover tension—in some cases, actual inconsistencies—with the model predictions. In fact, the most recent tests of the standard model have revealed that the principal constraint underlying the cosmic expansion appears to be the total equation-of-state for the cosmic fluid rather than that of its dark energy. The observational evidence now favors a cosmic fluid with zero active mass, i.e., , where and are, respectively, its total energy density and pressure (see also Melia 2015b). This result, however, would exclude a cosmological constant as a representation of dark energy.
It is therefore critically important to seriously examine the zero active mass condition with the highest precision permitted by current observations. In the literature, the FRW cosmology with zero active mass is known as the Universe (Melia 2007; Melia and Shevchuk 2012). This model has been compared with CDM/CDM (an FRW cosmology lacking this condition) in many one-on-one tests, at both low and high redshifts (see, e.g., Melia and Maier 2013; Wei et al. 2013, 2014a, 2014b, 2015a; Melia et al. 2015a). Thus far, has been favored by the data, with model selection tools typically yielding likelihoods of versus only for CDM/CDM. However, these results have not yet been universally accepted, and several counterclaims have emerged in recent years. These may be loosely grouped together into four primary categories: (1) that (representing the gravitational radius and, therefore, also the Hubble radius) does not really have any physical meaning or bearing on the observations; this claim has been made chiefly by van Oirschot et al. (2010), Bilicki & Seikel (2012), and Lewis & van Oirschot (2012); (2) that the zero active mass condition cannot be made consistent with the actual constitutents in the cosmic fluid (Lewis 2013); (3) that the measurements of as a function of redshift (the primary topic of the present paper) favor the concordance model over (Bilicki & Seikel 2012; Shafer 2015); and (4) that the analysis of Type Ia SNe also favor the concordance model over (Bilicki & Seikel 2012; Shafer 2015). These papers, and those published in response to them (see, e.g., Melia & Maier 2013; Bikwa et al. 2012; Melia & Shevchuk 2012; Melia 2012, 2014, 2015a), have generated a very important discussion that we aim to continue here. Specifically, in § 3 below, we will describe at length why the choice of truly model-independent data, and their analysis using sound statistical practices, is of utmost importance to any serious attempt at comparing different cosmological models in an unbiased fashion.
Of the previous tests favoring over CDM/CDM, two are particularly noteworthy. In the first of these, a combined sample of 613 supernova events from SNLS (Guy et al. 2010) and the newly released SDSS-II (Sako et al. 2015) was used to show that in an unbiased pairwise comparison, the Bayes Information Criterion (BIC) favors the Universe with a likelihood of versus for the standard model (Wei et al. 2015b; Melia et al. 2015b). This combined sample spans the critical redshift range () in which the presumed transition from deceleration to acceleration is thought to have occurred. This outcome reaffirms the influence of dark energy, but calls into question the widely held belief that the Universe is currently accelerating. In other words, when a neutral calibration of the SN data is used to compare models, the evidence does not appear to support the interpretation of dark energy as a cosmological constant.
In a second test, an application of the Alcock-Paczyński (AP) diagnostic using the model-independent anisotropic distribution of Baryon Acoustic Oscillation (BAO) peaks at average redshifts and has shown that the BAO data disfavor CDM/CDM at better than (Melia and López-Corredoira 2015). In the context of expanding FRW cosmologies, these measurements instead strongly prefer the zero active mass equation-of-state, confirming the conclusion drawn earlier from the Type Ia SN Hubble diagram.
Each of these results is quite significant in its own right; together, they make quite a compelling case. But given their evident impact, they need to be confirmed using another independent diagnostic in the critical redshift range sampled by the SNeIa and BAO observations. In this paper, we focus on several new measurements of the Hubble parameter within the redshift range , using luminous red galaxies as cosmic chronometers (Moresco 2015). These measurements were made without priors, and are therefore model independent—ideally suited to a one-on-one comparison between CDM/CDM and .
With the latest extension of the coverage to , the cosmic chronometer data are now fully compatible with the SNeIa and BAO measurements. But whereas the SN comparison is based on the (integrated) luminosity distance, and the AP diagnostic tests the predicted geometry, the measurements directly probe the expansion rate itself. Thus, although they sample the same redshift range, these three diagnostics test the cosmologies in distinctly different ways, and each therefore contributes to the self-consistency of the tests in its own unique way. In this paper, we carry out the critical one-on-one comparison between and CDM/CDM using the latest cosmic chronometer data. In so doing, we demonstrate that this independent test also strongly favors over CDM/CDM, thereby strengthening the argument in favor of the zero active mass condition.
2 The Cosmic Chronometers
Since the Hubble rate depends on the expansion parameter according to
| (1) |
and , where is the expansion parameter today, may be measured directly from the time-redshift derivative using
| (2) |
Measuring using the differential age of the Universe therefore circumvents the limitations associated with the use if integrated histories.
Galaxies evolving passively on a time scale much longer than their age difference are among the best cosmic chronometers one may use for this purpose (Jimenez and Loeb 2002). Less than 1 per cent of the stellar mass in the most massive galaxies formed at (Dunlop et al. 1996; Spinrad et al. 1997; Cowie et al. 1999; Heavens et al. 2004; Thomas et al. 2005; Panter et al. 2007). In fact, star formation ceased by redshift (Thomas et al. 2005) in galaxy clusters, while quite generally, all systems with stellar mass over ended their star formation activity by (Treu et al. 2005).
It is therefore reasonable to assume that galaxies in the highest density regions of clusters have been evolving passively since , tracing the so-called ‘red envelope,’ which samples the oldest stars in the Universe at every redshift. For this reason, these structures have been used as reliable cosmic chronometers in several extended studies (Stern et al. 2010a,b; Moresco et al. 2012a,b), culminating with the most recent measurements at (Moresco 2015).
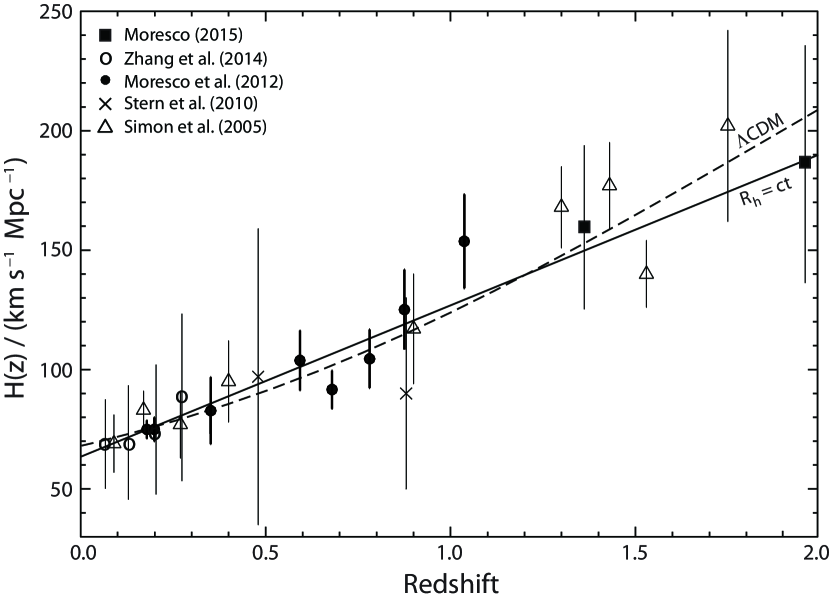
The data shown in figure 1 were assembled from the compilations of Simon et al. (2005), Stern et al. (2010), Moresco et al. (2012a) and Moresco (2015). We emphasize the fact that all of these measurements are model-independent. Other kinds of measurement of , based on the identification of BAO and the Alcock-Paczyński distortion from galaxy clustering, depend on how ‘standard rulers’ evolve with redshift, rather than how cosmic time changes with . Unfortunately, the values of measured in these different ways are sometimes combined to produce an overall versus diagram, but such compilations cannot be used to test different models because the second approach necessarily adopts a particular cosmology and is therefore model-dependent (Blake et al. 2012). Only the cosmic chronometer measurements are truly model-independent and therefore suitable for comparing CDM/CDM to other models, such as .
3 Discussion
In the Universe, , so the Hubble parameter scales very simply with redshift:
| (3) |
Since is the sole free parameter in this model, the corresponding theoretical curve in figure 1 can be adjusted only by sliding it vertically. There is no freedom to alter its gradient with redshift. Because the redshift coverage with these measurements now extends to , this particular test is therefore very constraining on models, such as , that do not predict a transition from deceleration to acceleration somewhere near .
CDM/CDM is characterized by a larger number of free parameters because the properties of dark energy are so poorly known. At the very least, one must include the Hubble constant , the fractional energy density in the form of matter (, where is today’s critical density), the dark energy equation-of-state parameter, , and the spatial curvature constant . But to keep the comparison as simple and favorable to CDM/CDM as possible, we will here adopt the prior value in the case of CDM, and for CDM, thus reducing the total number of adjustable parameters to an essential three in each case. The Hubble parameter in this cosmology is therefore given by the expression
| (4) |
Here, for radiation and for dark energy are defined analogously to . The scaling of each density with redshift assumes that all three components evolve independently of each other, which may be reasonable in the local Universe (i.e., at least out to ). Note that although we formally include in this expression, practically speaking its value () remains too insignificant compared to the other densities for it to contribute to the evolution in in this redshift range.
| Model | Optimized parameters (conventional units) | Likelihoods | |||
|---|---|---|---|---|---|
| 0.566 | AIC: | KIC: | BIC: | ||
| CDM | , , | 0.579 | AIC: | KIC: | BIC: |
| CDM | , , | 0.580 | AIC: | KIC: | BIC: |
For each model, we optimize the fit by finding the set of parameters that minimize the , in the case of ; , and in the case of CDM; and , and for CDM, as is evident from Equations (3) and (4). The results are summarized in Table 1, and the corresponding best fits for and CDM are shown in figure 1. These optimized parameter values are quoted with one-sigma standard errors, calculated from the corresponding -distribution for each model. With degrees of freedom, the reduced for the model is 0.566. By comparison, the optimal CDM fit has degrees of freedom, and a corresponding . The best-fit CDM model is similar to this, with . These fits suggest that is at least as good as CDM/CDM in accounting for the model-independent measurements, especially since it has only one free parameter. In particular, note how well it accounts for the most recent measurement; though, to be fair, the error bar at this redshift is still quite large, so that CDM/CDM cannot be excluded simply on the basis of this value alone.
On statistical grounds, however, the expansion rate versus redshift is far more likely to be correct than that in CDM/CDM. To compare the evidence for and against competing models, the use of various information criteria is now fairly common in cosmology (see, e.g., Takeuchi 2000; Liddle 2004, 2007; Tan and Biswas 2012). For example, the Akaike Information Criterion (AIC),
| (5) |
provides an enhanced ‘goodness of fit,’ extending the usual statistic by also taking into account the number of free parameters in each model. The AIC ranks two or more competing models, and yields a numerical measure of confidence that each model is preferred (Akaike 1973; Burnham and Anderson 2002, 2004). Clearly, the AIC prefers models with fewer parameters, as long as the others do not provide a substantially better fit to the data. Informally, in a one-on-one comparison between two models, model has a likelihood
| (6) |
of being the best choice. For the analysis reported here, these likelihoods are for and for either CDM or CDM (see Table 1).
An alternative to the AIC (Cavanaugh 1999) is known as the Kullback Information Criterion (KIC), , which disfavors overfitting more than does the AIC. Not surprisingly, the corresponding values of for and for either CDM or CDM, therefore favor the former by a greater amount.
A better-known alternative, known as the Bayes Information Criterion (BIC), is actually not based on information theory, but rather on an asymptotic approximation to the results of a conventional Bayesian inference procedure for comparing two models (Schwarz 1978):
| (7) |
The BIC suppresses overfitting very strongly when the number of data points is large. In the sample used here, , and we find that for , versus only for either CDM or CDM.
According to all three statistics, the expansion rate versus redshift predicted by is more likely than that of CDM/CDM to be closer to the ‘correct’ cosmology. This consistency in the results is quite important because, whereas the BIC is based on Bayesian statistics, the AIC and KIC are not. When is large, any chosen Bayesian ‘priors’ over the parameters of the individual models drop out (Kuha 2004). However, the prior distribution over the choice of models does not. In other words, though the model distribution is often reasonably assumed to be ‘flat’, i.e., to give each model an equal a priori likelihood, a case can sometimes be made that one model is to be preferred a priori over the other.
The idea is that in the light of the data, e.g., the BIC computed from the data, the relative likelihood of the two models being compared is multiplied by a Bayes factor. When one assumes that the models are equally likely a priori, the multiplication by the Bayes factor yields (if the BIC is being used) their likelihoods being given by the BIC-derived Bayes weights, according to the usual formula. But the models don’t necessarily need to be taken, a priori (i.e., pre-data), to be equally likely.
So for the BIC one needs to assess beforehand whether either CDM/CDM or is preferred. Of course, this is precisely the problem with attempting to prioritize models before testing them against the data. Different workers can have different subjective opinions. As of today, these two models have been tested against each other using diverse types of data, all of which have thus far favored . Should one assign a prior distribution for the models, the evidence now suggests that is preferred. But to avoid such biases based on subjective points of view, the only sensible approach with the work reported in this paper is to simply let the data speak for themselves, and assume that the prior distribution over the choice of models is flat.
The fact that we here use three different information criteria to evaluate the models, of which the AIC and KIC have their own foundations and do not belong to Bayesian statistics, strengthens our overall conclusions. The inclusion of new high- measurements of using cosmic chronometers has reinforced the results of cosmological model comparisons, all of which have thus far favored over CDM/CDM.
Nonetheless, in a similar study of measurements based on BAO observations, rather than cosmic chronometers, Shafer (2015) reaches a different conclusion. Unfortunately, Shafer’s analysis is a good example of the unwitting use of model-dependent measurements to test competing cosmologies. We reiterate the obvious, though often forgotten, necessity of using only truly model-independent data to conduct statistically fair comparisons between different models. Without adequate explanation, Shafer opts to completely ignore measurements of using cosmic chronometers, relying instead on BAO measurements, in spite of the fact that the deficiencies in the latter have already been discussed at length, e.g., in Melia & Maier (2013). He appears to be unaware of the significant limitations of all but the most recent two BAO measurements at (Anderson et al. 2014) and (Delubac et al. 2015) for this kind of work. All previous applications of the galaxy two-point correlation function to measure a redshift-dependent scale were limited by the difficulty in disentangling the acoustic length in redshift space from redshift distortions due to internal gravitational effects (López-Corredoira 2014). With this process, one had to either pre-assume a particular model, or adopt prior parameter values to estimate the level of contamination. And the wide range of possible distortions for the same correlation-function shape resulted in seriously large errors.
To illustrate how significant these limitations are, and how biased the use of BAO measurements of can be, consider the considerable disparity between Shafer’s conclusion that these data strongly favor CDM over , and the results of the Alcock-Paczyński test using only the two most recent measurements that avoid such model-dependent biasing (Melia & López-Corredoira 2015). The much more precise determination of the Ly- and quasar auto- and cross-correlation functions at has resulted in the measurement of BAO peak positions to better than accuracy (Delubac et al. 2015). A similar accuracy has been achieved through the application of a technique of reconstruction to improve the signal/noise measurement of the BAO peak position in the anisotropic distribution of SDSS-III/BOSS DR11 galaxies at (Anderson et al. 2014).
Unlike previous measurements, the actual shape of the BAO peak does not affect the calculation of its centroid position for these two high-precision cases, both along the line-of-sight and in the direction perpendicular to it, when its FWHM is very narrow. The peak’s narrowness mitigates the impact of redshift distortions, which affect the peak’s amplitude, but not its location. Notice, for instance, that, although the errors for the redshift distortions quoted in Table 2 of Delubac et al. (2015) are very large, the relative error bars for are much smaller. In addition, the application of the Alcock-Paczyński test to these two precision measurements ensures that any model dependence in the BAO data is completely removed because in this test, both the unknown acoustic scale and the Hubble constant completely cancel out, not to mention that this test is also completely independent of any possible redshift evolution in the acoustic length. As shown by Melia & López-Corredoira (2015), this test indicates that the concordance model is excluded at a C.L., while the probability that is consistent with these data is .
In other words, the true model-independent BAO data overwhelmingly favor over CDM/CDM, in sharp contrast to the conclusions drawn by Shafer (2015). There is therefore no merit to his claim that the cosmic-chronometer measurements of , which strongly favor over CDM, should be supplanted by the BAO measurements, which he erroneously believes yield the opposite result.
Shafer (2015) also considers Type Ia SN data, and though SNe are not the subject of the present paper, it is nonetheless useful to point out the bias in this analysis as well. These issues have already been discussed and published in, e.g., Wei et al. (2015b), so we will provide only a brief summary of the key issues here.
The statistical analysis of Type Ia SNe can be improved with the merger of disparate sub-samples. For example, the Union2.1 catalog (Kowalski et al. 2008; Suzuki et al. 2012), which currently includes SN detections, offers several statistical advantages, but each sub-sample comes with its own set of systematic and intrinsic uncertainties. These are subsumed into unknown intrinsic dispersions ’s (one for each sub-sample), which makes it difficult to fit cosmological models. The commonly followed approach, and apparently the one also followed by Shafer (2015), is to minimize an overall , while constraining the of each sub-sample to equal unity. It is hardly surprising, then, that the overall is very nearly one. However, a correct statistical approach would estimate the unknown ’s simultaneously with all other parameters (Kim 2011; Wei et al. 2015b). For this, the use of maximum likelihood estimation (MLE) has been shown to yield superior results (D’Agostini 2005; Kim 2011, though the presence of multiple ’s complicates the analysis when the number of merged sub-samples is greater than .
The Union2.1 catalog contains at least 17 sub-samples. In reality, therefore, the total number of “nuisance” parameters is 20, since all of the ’s need to be recalibrated for each independent cosmological model in a truly unbiased test. This is unrealistic. Note that this also means the expressions used by Shafer to estimate the AIC and BIC are incorrect. Since the ’s themselves are not known a priori, the AIC and BIC must be calculated in terms of the likelihood function, not , as described in Wei et al. (2015b). In such cases, it is therefore preferable to work with a few large sub-samples, rather than many smaller ones. Fortunately, about half of the Type Ia SNe in Union2.1 came from the single, homogeneous sample known as the SNLS (Guy et al. 2010), and since the same instruments and reduction techniques were employed for all 252 of these high- () events, a single characterizes the unknown intrinsic scatter in this homogeneous sample. Notice, in particular, that this sample spans the important range of redshifts within which the transition from deceleration to acceleration is thought to have occurred.
This was the approach followed by Wei et al. (2015b), who concluded from the careful analysis of the SNLS catalog that the BIC favors over CDM/CDM with a likelihood of versus only . In contrast, Shafer based his analysis on merged sub-samples, with the additional complication of unknown ’s and the use of questionable statistical techniques. But he does not adequately explain why his result is completely reversed when one uses a single sample with uniform systematics. Surely the outcome of a detailed Type Ia SN analysis, if carried out properly, should be robust enough to emerge intact regardless of whether one uses a single large sample, or many smaller sub-samples.
Indeed, to illustrate this point, we (Melia et al. 2015b) carried out a similar analysis to that of Wei et al. (2015b), this time using both the SNLS and Sloan Digital Sky Survey (SDSS-II) events in the Joint Lightcurve Analysis (JLA) of Betoule et al. (2014). But a careful screening of these two sub-samples shows that the SNLS and SDSS-II SNe have a small relative offset in their measured magnitudes, possibly due to slight differences in the background subtraction between the two surveys. A systematic shift such as this is not adequately handled by introducing sub-sample-specific ’s. Instead, a more meaningful approach is to use a single sample-wide , together with a systematic magnitude offset parameter between the SNLS and SDSS-II events. The results of this study show that the JLA merged SN sample favors over CDM/CDM with a likelihood of versus only , in complete agreement with the previous study using solely the SNLS catalog on its own.
This is the type of consistency one expects from the analysis of Type Ia SNe if the analysis is being handled correctly and independently of any inherent bias. In particular, one cannot use parameters optimized for one model to test another, and the use of a single large sample should not completely reverse the results of analysis of more complicated, merged catalogs. In summary, Shafer’s (2015) claim, that CDM/CDM is preferred over by the BAO-measured values of and the analysis of Type Ia SNe, is based on a combination of improper data selection and a statistically flawed analysis. Instead, the results of the present paper show that model-independent measurements of strongly favor over CDM/CDM, in complete agreement with most of the other published one-on-one comparative tests between these two cosmologies.
4 Conclusions
In reporting the high- measurements of using cosmic chronometers, Moresco (2015) applied this diagnostic to CDM in order to demonstrate its power for improving the precision with which the model parameters may be optimized. He found a detectable improvement () in the inferred value of and over previous studies restricted to measurements of at .
In our previous study using a sample similarly restricted to (Melia and Maier 2013), we derived respective Bayesian posterior probabilities of for and for CDM/CDM. In the work reported here, the addition of 4 new measurements at by Zhang et al. (2014) and, especially, the two new measurements at by Moresco (2015), have not only confirmed our earlier results, but have strengthened the statistical significance of this important one-on-one comparison between competing cosmological models. We have found that the model-independent cosmic chronometer data prefer the Universe over CDM/CDM with a BIC likelihood of versus only .
We therefore confirm Moresco’s (2015) conclusion that upcoming, additional measurements of with expanded surveys at high redshifts (e.g., Laureijs et al. 2011) will provide us with one of the most powerful probes of the cosmic spacetime in the local Universe.
In so doing, we have achieved the primary goal of this work—to independently confirm the outcome of previous comparative tests between and CDM/CDM using SNeIa and BAO data within the critical redshift range () where the transition from decelerated to accelerated expansion is thought to have occurred.
These three diagnostics, the SNeIa Hubble diagram (Melia et al. 2015b), the Alcock-Paczyński BAO test (Melia and López-Corredoira 2015), and now the -redshift relation, each probes the cosmic expansion in its own unique way. The fact that all three have self-consistently demonstrated that is preferred over CDM/CDM with comparable statistical significance argues strongly in favor of the zero active mass equation-of-state. Our results affirm the influence of dark energy in the cosmic fluid; but not in the guise of a cosmological constant.
References
- (1) Akaike, H. 1973, in Second International Symposium on Information Theory, eds. B. N. Petrov and F. Csáki (Budapest: Akadémiai Kiadó), 267
- (2) Anderson, L. et al., 2014, MNRAS, 441, 24
- (3) Betoule, M. et al., 2014, A&A, 568, 22
- (4) Bikwa, O., Melia, F. & Shevchuk, A.S.H. 2012, MNRAS, 421, 3356
- (5) Bilicki, M. & Seikel, M. 2012, MNRAS, 425, 1664
- (6) Blake, C., et al. 2012, MNRAS, 425, 405
- (7) Burnham, K. P. & Anderson, D. R. 2002, Model Selection and Multimodel Inference, 2nd edn. (New York: Springer-Verlag)
- (8) Burnham, K. P. & Anderson, D. R. 2004, Sociol. Methods Res., 33, 261
- (9) Cavanaugh, J. E. 1999, Statist. Probab. Lett., 42, 333
- (10) Cowie, L. L., Songaila, A., & Barger, A. J. 1999, AJ, 118, 603
- (11) D’Agostini, G., 2005, arXiv:physics/0511182
- (12) Delubac, T. et al., 2015, A&A, 574, A59
- (13) Dunlop, J., et al. 1996, Nature, 381, 581
- (14) Guy, J. et al., 2010, A&A, 523, A7
- (15) Heavens, A., Panter, B., Jimenez, R., & Dunlop, J. 2004, Nature, 428, 625
- (16) Jimenez, R. and Loeb, A., 2002, ApJ, 573, 37
- (17) Kim, A. G., 2011, PASP, 123, 230
- (18) Kowalski, M. R. et al., 2008, ApJ, 686, 749
- (19) Kuha, J., 2004, Sociol. Methods Res., 33, 188
- (20) Laureijs, R. et al., 2011, eprint (arXiv:1110.3193)
- (21) Lewis, G. F. 2013, MNRAS, 432, 2324
- (22) Lewis, G. F. & van Oirschot, P. 2012, MNRAS Letters, 423, 26
- (23) Liddle, A. R. 2004, MNRAS, 351, L49
- (24) Liddle, A. R. 2007, MNRAS, 377, L74
- (25) López-Corredoira, M., 2014, ApJ, 781, id. 96
- (26) Melia, F., 2007, MNRAS, 382, 1917
- (27) Melia, F. 2012, JCAP, 09, 029
- (28) Melia, F. 2014, Astrop. & Sp. Sc., 355, 2211
- (29) Melia, F. 2015a, MNRAS, 446, 1191
- (30) Melia, F. 2015b, Annalen der Physik, submitted
- (31) Melia, F. and López-Corredoira, M., 2015, ApJL, submitted (arXiv:1503.05052)
- (32) Melia, F. and Maier, R. S., 2013, MNRAS, 432, 2669
- (33) Melia, F. and Shevchuk, A.S.H., 2012, MNRAS, 419, 2579
- (34) Melia, F., Wei, J.-J. and Wu, X., 2015a, AJ, 149, 2
- (35) Melia, F., Wei, J.-J., Maier, R. S. and Wu, X., 2015b, AJ, submitted
- (36) Moresco, M., et al. 2012a, JCAP, 8, article id 006
- (37) Moresco, M., Verde, L., Pozzetti, L., Jimenez, R., & Cimatti, A. 2012b, JCAP, in press (arXiv:1201.6658)
- (38) Moresco, M., 2015, MNRAS, in press (arXiv:1503.01116)
- (39) Panter, B., Jimenez, R., Heavens, A. F., & Charlot, S. 2007, MNRAS, 378, 1550
- (40) Perlmutter, S., Aldering, G., della Valle, M. et al., 1998, Nature, 391, 51
- (41) Riess, A. G., Filippenko, A. V., Challis, P. et al., 1998, AJ, 116, 1009
- (42) Sako, M. et al., 2015, ApJS., in press, [arXiv1401.3317S]
- (43) Schmidt, B. P., Suntzeff, N. B., Phillips, M. M. et al., 1998, ApJ, 507, 46
- (44) Schwarz, G. 1978, Ann. Statist., 6, 461
- (45) Shafer, D. L. 2015, Phys. Rev. D, 91, 103516
- (46) Simon, J., Verde, L., & Jimenez, R. 2005, Phys. Rev. D, 71, 123001
- (47) Spinrad, H., et al. 1997, ApJ, 484, 581
- (48) Stern, D., Jimenez, R., Verde, L., Stanford, S. A., & Kamionkowski, M. 2010a, ApJS, 188, 280
- (49) Stern, D., Jimenez, R., Verde, L., Kamionkowski, M., & Stanford, S. A. 2010b, JCAP, 2, id. 008
- (50) Suzuki, N. et al., 2012, ApJ, 746, 85
- (51) Takeuchi, T. T. 2000, Ap&SS, 271, 213
- (52) Tan, M. Y. J. & Biswas, R. 2012, MNRAS, 419, 3292
- (53) Thomas, D., Maraston, C., Bender, R., & de Oliveira, C. M. 2005, AJ, 621, 673
- (54) Treu, T., et al. 2005, ApJ, 633, 174
- (55) van Oirschot, P., Kwan, J. & Lewis, G. F. 2010, MNRAS, 404, 1633
- (56) Wei, J.-J., Wu, X. and Melia, F., 2013, ApJ, 772, id. 43
- (57) Wei, J.-J., Wu, X. and Melia, F., 2014a, MNRAS, 439, 3329
- (58) Wei, J.-J., Wu, X. and Melia, F., 2014b, ApJ, 788, id. 190
- (59) Wei, J.-J., Wu, X. and Melia, F., 2015a, MNRAS, 447, 479
- (60) Wei, J.-J., Wu, X., Melia, F. and Maier, R. S., 2015b, AJ, 149, 102
- (61) Zhang, C., Zhang, H., Yuan, S., Liu, S., Zhang, T.-J., Sun, Y.-C., 2014, Res. Astron. Astrophys., 14, 1221