Quantum critical origin of the superconducting dome in SrTiO3
Abstract
We investigate the origin of superconductivity in doped SrTiO3 (STO) using a combination of density functional and strong coupling theories within the framework of quantum criticality. Our density functional calculations of the ferroelectric soft mode frequency as a function of doping reveal a crossover from quantum paraelectric to ferroelectric behavior at a doping level coincident with the experimentally observed top of the superconducting dome. Based on this finding, we explore a model in which the superconductivity in STO is enabled by its proximity to the ferroelectric quantum critical point and the soft mode fluctuations provide the pairing interaction on introduction of carriers. Within our model, the low doping limit of the superconducting dome is explained by the emergence of the Fermi surface, and the high doping limit by departure from the quantum critical regime. We predict that the highest critical temperature will increase and shift to lower carrier doping with increasing 18O isotope substitution, a scenario that is experimentally verifiable.
Strontium titanate (STO) is a cubic perovskite with the ideal prototype structure at room temperature and a tetragonal structure below 100K due to symmetry-lowering antiferrodistortive (AFD) rotations of the TiO6 octahedra. It is characterized by a number of remarkable properties. It was the first superconducting oxide to be discovered and shows a dome as a function of doping, similar to that of the high- cupratesKoonce et al. (1967), but with its maximum transition temperature at K. Early tunneling measurements Binnig et al. (1980) and subsequent experiments Lin et al. (2013) suggested an unusual two-band superconductivity, consistent with the closely spaced lowest conduction bands at the center of the Brillouin zone. In addition, the onset of superconductivity has been shown to occur at remarkably low carrier concentrations of e/cm3 Lin et al. (2013). Despite a long-running interest in its origin Koonce et al. (1967), a complete theoretical account of the superconducting dome remains elusive, and many aspects of superconductivity in STO remain a puzzle.
The dielectric behavior of STO is also unusual. The dielectric constant is strongly temperature dependent, and diverges at low temperature in a manner characteristic of a ferroelectric phase transition Müller and Burkard (1979). Rather than manifesting ferroelectric behavior, however, STO is a so-called quantum paraelectric, in which quantum fluctuations at zero temperature suppress the transition to the ferroelectric state Müller and Burkard (1979). The quantum paraelectric state is characterized by low energy excitations and large ferroelectric fluctuations Suzuki et al. (2013), and it has been speculated that these might be relevant for the superconductivity Bussmann-Holder et al. (1989); de Lima et al. (2015). Indeed, early descriptions Koonce et al. (1967); Appel (1969) of the superconducting dome in STO were based on the effects of screening of the interaction between electrons and the optical phonons responsible for the large dielectric response. Because heavier 18O atoms suppress the quantum fluctuations, STO develops ferroelectric order on isotope substitution of 16O with 18O, and the composition with 35% 18O substitution was recently reported to be a ferroelectric quantum critical point (QCP) Rowley et al. (2014).
We present a model in which these two features – proximity to the ferroelectric QCP and the unusual superconducting properties – are intimately related, and the superconducting dome emerges as a result of the quantum critical ferroelectric fluctuations. A connection between the formation of a superconducting dome and quantum criticality has been extensively discussed in the context of unconventional superconductivity, both in heavy fermion materials and in the cuprates Gegenwart et al. (2008); Sachdev (2000); Sebastian et al. (2010). It is proposed that competing phases close to the quantum critical point lead to low energy excitations such that any residual interactions drive the system to a new, possibly superconducting phase. In heavy fermion materials and the cuprates a magnetic quantum critical point with associated spin excitations has been invoked to explain superconductivity. In STO the elementary excitations associated with the ferroelectric quantum critical point are optical phonon modes. As a result we expect differences in the nature of the superconducting order: Magnetic fluctuations typically produce unconventional superconducting order such as -wave singlets for antiferromagnetic fluctuations Monthoux et al. (1991); Scalapino (2012) or -wave triplet states for ferromagnetic fluctuations Roussev and Millis (2001). The ferroelectric fluctuations in STO, in contrast, involve phonon modes and as such are candidates for pairing interactions that introduce conventional -wave superconducting order, as observed in experiments Lin et al. (2015).
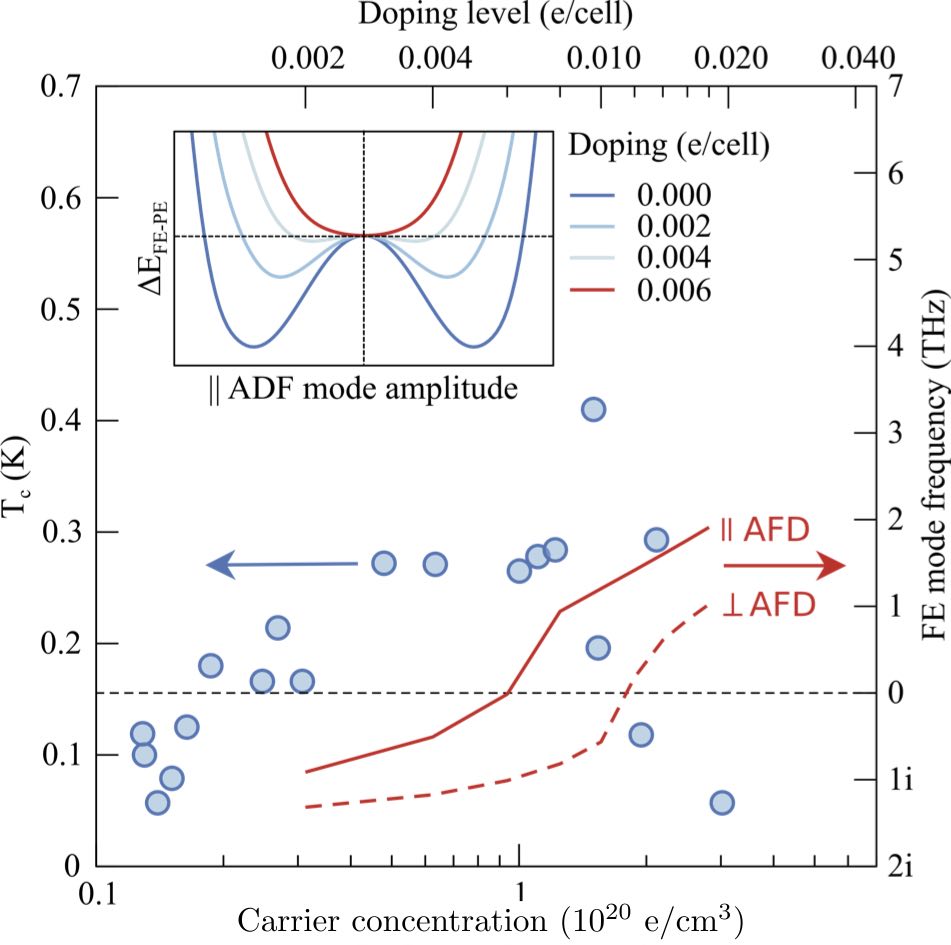
Our model is motivated by our density functional theory (DFT) calculations of the zone-center () soft-mode optical phonon frequency as a function of electron doping, which shows an intriguing correlation with experimental measurements of the superconducting dome. This ferroelectric soft mode, which consists predominantly of opposite Ti cation and O anion displacements (for details, see Ref. Aschauer and Spaldin, 2014), has a calculated imaginary frequency at zero doping, indicating the presence of a ferroelectric instability. The calculated potential energy as a function of the relative position of anions and cations (see supplementary material Sec. I for details) shows the characteristic double well form, with the two minima corresponding to ferroelectric structural ground states with opposite polarizations. In practice, quantum fluctuations between the two wells suppress the ferroelectricity in STO, and give it its quantum paraelectric behavior. In Fig. 1 we show how, on electron doping, the modulus of the mode frequency decreases, corresponding to a weakening of the ferroelectric instability, and the frequency eventually becomes real – signaling a single high-symmetry energy minimum (inset to Fig. 1) – at a doping concentration of cm-3. Since there is now only one minimum of the potential well, there are clearly no quantum fluctuations between equivalent states. At the same doping level, the experimentally measured superconducting transition temperature starts to reduce. Since soft modes are characteristic of quantum criticality Sachdev (2011), we propose therefore the following model for the superconducting dome in STO: First, superconductivity is favored when the quantum fluctuations favored by the soft lattice modes increase the superconducting coupling constant . However, these are strongest at low doping, where there are insufficient carriers to provide robust superconductivity. Increasing the doping level has the side-effect of reducing , which in turn determines the upper bound of the superconducting dome.
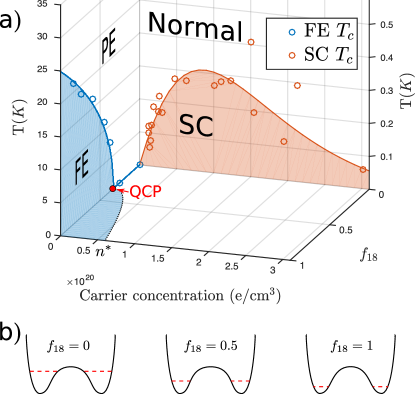
To test this hypothesis we propose isotopic substitution of 16O with 18O, which lowers the energies of the zero-point energy levels in the two minima and reduces the probability of tunneling between them eventually favoring a ferroelectric ground state, see Fig. 2b. We know that at zero carrier doping, the paraelectric to ferroelectric transition occurs at about 35% 18O substitution and is a quantum critical pointRowley et al. (2014). In addition, our DFT calculations tell us that doping suppresses FE, and so the QCP should move to higher 18O fractions as doping is increased, implying the existence of a quantum critical line (QCL). This allows us to construct the schematic phase diagram in Fig. 2. Our DFT calculations give an upper bound for this QCL, which is the doping level at which the frequency of the FE mode becomes real and the quantum fluctuations are completely suppressed; in practice this represents the limit of infinitely heavy oxygen atoms and the actual critical transition will occur at much lower doping. Note that, at least at low 18O concentration, charge carriers only appear as one moves away from the quantum critical point, so the QCP is in fact located outside the superconducting dome. This is in contrast to the emergence of superconductivity in other systems close to a QCP, such as the cuprate superconductors, in which the dome is approximately centered on the QCP. In those cases, the QCP occurs at substantial doping, where charge carriers are already available.
We quantify our proposed model by calculating , assuming the scenario of soft critical modes in the limit of low doping. We first write a quantum model for the ferroelectric phase transition which yields a spectrum for the FE phonons. Then, we calculate the superconducting coupling constant, using the Macmillan formula McMillan (1968).
We use the order-disorder approach Yamada et al. (2004) to model the ferroelectric fluctuations of the modes shown in Fig. 1. We assume that these modes have Ising character. By analogy with magnetic phase transitions, the transverse Ising model
| (1) |
can be used to describe the FE transition Suzuki et al. (2013). Here are the Pauli matrices for site , is the onsite tunneling rate, is the inter-site coupling, given by the energy difference between two cells with their dipoles aligned parallel or anti-parallel to each other, and the eigenstates of represent the state of the system in one of the two wells. The quantum phase transition occurs when Suzuki et al. (2013). Our DFT study shows that doping the system will reduce the barrier and thus increase . The excitations of (1), in the paraelectric phase , are given by Suzuki et al. (2013)
| (2) |
where is the Fourier transform of the coupling and is the average of . In our analysis we consider only nearest-neighbor coupling for simplicity. Long range interactions make the calculation more intricate but do not yield any qualitative changes. Furthermore, since the antiferrodistortive rotations of the TiO6 octahedra render the lattice highly anisotropic, we treat the system as one dimensional. Thus, we write the coupling as , where is a constant and is the wave number in the direction of the largest coupling.
When the system is close to the phase transition it becomes gapless as the lowest excitation softens, (see supplementary material, Sec. II)). This is accompanied a large susceptibility and an enhanced electron-phonon coupling. To quantify this idea we calculate the dependence of on the phononic spectrum using the formalism of Eliashberg strong-coupling theory. The coupling constant for superconductivity is given by McMillan (1968)
| (3) |
where is the electron-phonon coupling, which we assume to be the constant , and is the spectral density of the phonons. In the limit of a van Hove singularity at , so that , this yields
| (4) |
which already captures the main physical picture of soft-mode enhanced superconductivity. The full solution is obtained by inserting into (3) and transforming it to an integral over : , where is given by (9). One then obtains
| (5) |
The critical temperature can then be obtained by combining this coupling constant with the standard expression (see for example Ref. Abrikosov et al., 1965)
| (6) |
where is the energy relative to the Fermi energy, , and is the density of states. The lower limit of the integral is set by at and below the bottom of the band where . The upper limit is set by the Fermi level, where we define . Since in the low doping scenario that we consider here the relevant energy range is close to the bottom of the band, we can assume that close to . Using equation (6) then becomes
| (7) |
where is a constant of proportionality. Note that has a double dependence on : one directly from the limit of the integral in (7) and the other from the dependence of on the tunneling rate on through its dependence on the carrier concentration.
Before we can solve Eq. 7 numerically to obtain as a function of , we need the explicit dependence of the parameters of our model (1) on doping and isotope replacement. The quantity with the largest quantitative influence is the ratio , which is equal to one on the QCL. For simplicity we set and consider only the dependence of . As discussed above, carrier doping decreases the barrier between the two wells and thus increases the tunneling energy . This effect starts at low doping level and becomes very strong around carrier concentrations of e/cm3, so we consider both a linear and quadratic dependence on . 18O replacement on the other hand should decrease approximately linearly as the zero-point energy levels shift deeper into the wells. Furthermore, we require that at zero doping and 35% 18O substitution, which is the known QCP, should equal unity. Thus we use the form
| (8) |
where is the 18O fraction and the constants , , and are chosen so that the calculated for matches the experimental value. We then use the expression from Eq. (8) and insert this into Eq. (7) to calculate .
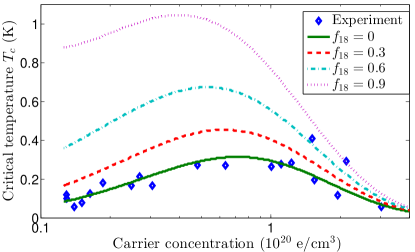
In Fig. 3 we plot our calculated as a function of the Fermi energy (converted to carrier concentration) for various values of . Two features are clear from the plot: i), we find a significant enhancement of with increased 18O content, reflecting the fact that the isotope substituted system is closer to the QCP. ii), we find that the peak of the superconducting dome shifts to lower carrier concentrations, since the enhancement of and thus is strongest close to the QCP, as can be seen from Eq. (3). We note that, even when exceeds 0.35, doping quickly reduces the depth of the double wells, allowing quantum fluctuations to return STO to the quantum paraelectric state. Thus, apart from the limit of very low doping, all systems we consider have paraelectric, not ferroelectric ground states. In our mechanism for superconductivity in STO, increasing the atomic mass leads to an increase of the critical temperature. That is (for details, see supplementary material, Sec. III). This differs profoundly from the well-known isotope effect in BCS superconductors, in which Maxwell (1950), where is the mass of the atoms. This arises from the dependence of on the Debye frequency.
We have provided a description of the superconducting dome in STO in which the QCP at zero doping provides low energy soft phonon excitations, which lead to a large coupling constant. Increasing the doping provides carriers for superconductivity but reduces the ferroelectric quantum fluctuations and decreases the coupling constant, eventually suppressing the superconductivity and limiting the top of the superconducting dome. Since isotope substitution allows tuning of the QCP, our model predicts a large and unusual isotope effect on , see Fig. 3, which should be experimentally observable. The understanding of the competition between carrier concentration and proximity to a QCP developed here provides a new design guideline in the search for novel superconducting compounds and suggests a route to engineering materials with higher s through tuning the location of their QCP.
Acknowledgments We are grateful to D. Abergel, K. Behnia, J. Haraldsen, R. Fernandes, S. Raghu and P. Wölfle for useful discussions. This work was supported by US DOE BES E304, by the ETH Zürich (NAS and UA) and by the ERC Advanced Grant Program, No. 291151 (NAS and UA), No321031, KAW and LDRD (AVB and YK).
References
- Koonce et al. (1967) C. S. Koonce, M. L. Cohen, J. F. Schooley, W. R. Hosler, and E. R. Pfeiffer, Phys. Rev. 163, 380 (1967).
- Binnig et al. (1980) G. Binnig, A. Baratoff, H. E. Hoenig, and J. G. Bednorz, Phys. Rev. Lett. 45, 1352 (1980).
- Lin et al. (2013) X. Lin, Z. Zhu, B. Fauqué, and K. Behnia, Phys. Rev. X 3, 021002 (2013).
- Müller and Burkard (1979) K. Müller and H. Burkard, Phys. Rev. B 19, 3593 (1979).
- Suzuki et al. (2013) S. Suzuki, J.-i. Inoue, and B. K. Chakrabarti, Quantum Ising Phases and Transitions in Transverse Ising Models, Lecture Notes in Physics, Vol. 862 (Springer Berlin Heidelberg, 2013) pp. 1–11.
- Bussmann-Holder et al. (1989) A. Bussmann-Holder, A. Simon, and H. Büttner, Phys. Rev. B 39, 207 (1989).
- de Lima et al. (2015) B. S. de Lima, M. S. da Luz, F. S. Oliveira, L. M. S. Alves, C. A. M. dos Santos, F. Jomard, Y. Sidis, P. Bourges, S. Harms, C. P. Grams, J. Hemberger, X. Lin, B. Fauqué, and K. Behnia, Phys. Rev. B 91, 045108 (2015).
- Appel (1969) J. Appel, Phys. Rev. 180, 508 (1969).
- Rowley et al. (2014) S. E. Rowley, L. J. Spalek, R. P. Smith, M. P. M. Dean, M. Itoh, J. F. Scott, G. G. Lonzarich, and S. S. Saxena, Nat. Phys. 10, 10 (2014).
- Gegenwart et al. (2008) P. Gegenwart, Q. Si, and F. Steglich, Nat. Phys. 4, 186 (2008).
- Sachdev (2000) S. Sachdev, Science (80-. ). 288, 475 (2000).
- Sebastian et al. (2010) S. E. Sebastian, N. Harrison, M. M. Altarawneh, C. H. Mielke, R. Liang, D. A. Bonn, W. N. Hardy, and G. G. Lonzarich, Proc. Natl. Acad. Sci. U. S. A. 107, 6175 (2010).
- Monthoux et al. (1991) P. Monthoux, A. V. Balatsky, and D. Pines, Phys. Rev. Lett. 67, 3448 (1991).
- Scalapino (2012) D. J. Scalapino, Rev. Mod. Phys. 84, 1383 (2012).
- Roussev and Millis (2001) R. Roussev and A. J. Millis, Phys. Rev. B 63, 140504 (2001).
- Lin et al. (2015) X. Lin, C. W. Rischau, C. J. van der Beek, B. Fauque, and K. Behnia, , 5 (2015), arXiv:1507.01867 .
- Aschauer and Spaldin (2014) U. Aschauer and N. A. Spaldin, J. Phys. Condens. Matter 26, 122203 (2014).
- Sachdev (2011) S. Sachdev, Quantum Phase Transitions, 2nd ed. (Cambridge University Press, 2011).
- Wang and Itoh (2001) R. Wang and M. Itoh, Phys. Rev. B 64, 174104 (2001).
- McMillan (1968) W. McMillan, Phys. Rev. 167, 331 (1968).
- Yamada et al. (2004) Y. Yamada, N. Todoroki, and S. Miyashita, Phys. Rev. B 69, 024103 (2004).
- Abrikosov et al. (1965) A. A. Abrikosov, L. P. Gorkov, and I. E. Dzyaloshinski, Quantum Field theoretical Methods in Statistical Physics (Pergamon Press, 1965).
- Maxwell (1950) E. Maxwell, Phys. Rev. 78, 477 (1950).
Appendix A Supplemental material
Appendix B Ferroelectric modes
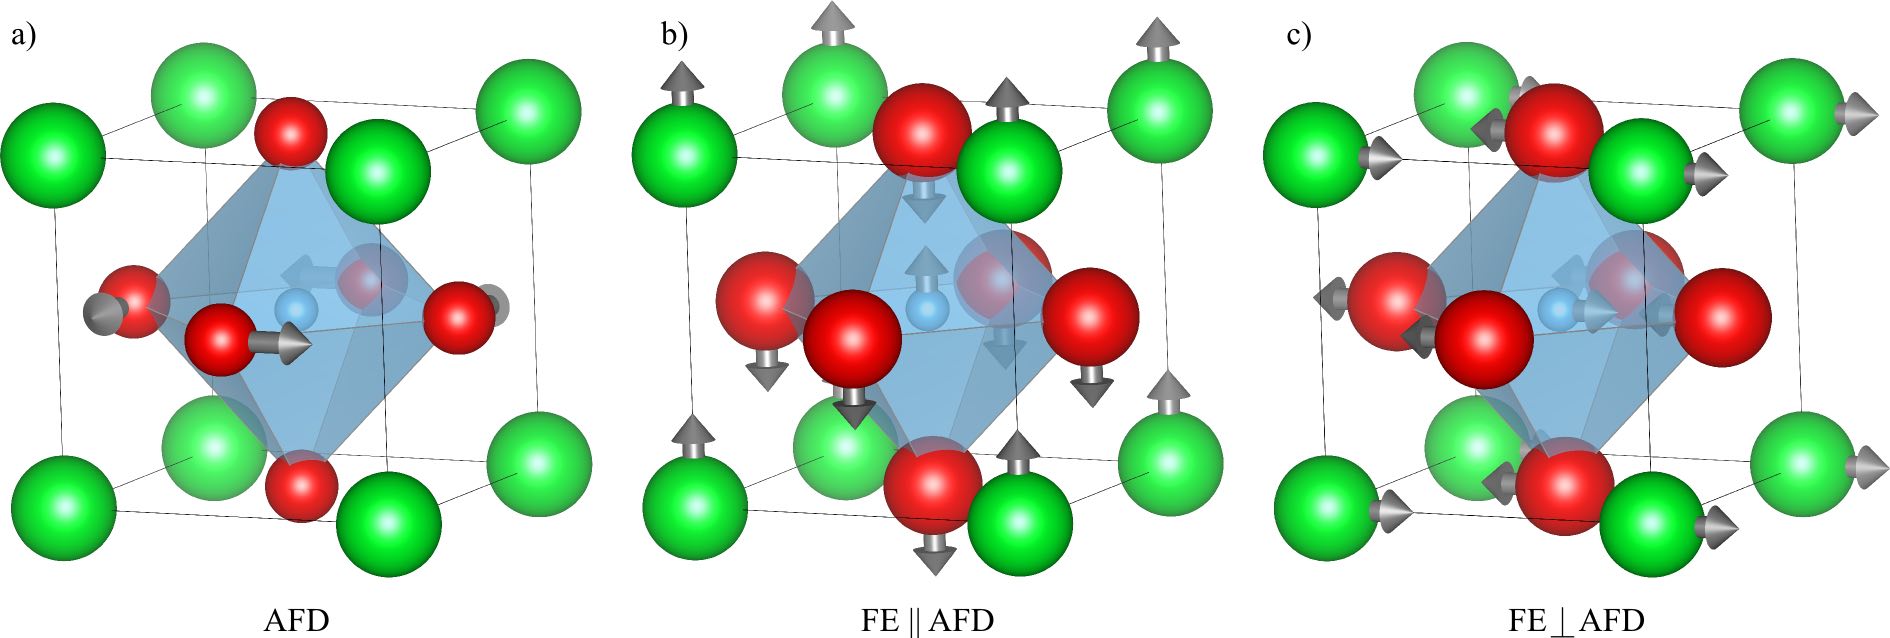
The ferroelectric mode frequencies plotted in Fig. 1 in the main text refer to the mode parallel to the axis of the antiferrodistortive rotations of the TiO6 octahedra (solid line) and to the doubly degenerate perpendicular modes perpendicular to the octahedral rotations (dashed line). The displacements of the atoms within the unit cell for each of these modes are shown in Fig. 4.
The mode frequencies were computed using the frozen phonon approach as implemented in Phonopy Togo et al. (2008) with forces obtained from density functional theory with the PBEsol functional Perdew et al. (2008) as implemented in the Vienna ab initio simulation package (VASP) Kresse and Hafner (1993, 1994); Kresse and Furthmuller (1996a, b). In these force calculations, wavefunctions were expanded in plane waves up to a kinetic energy cutoff of 550 eV for PAW potentials Blöchl (1994); Kresse and Joubert (1999) with Sr(4s, 4p, 5s), Ti(3p, 3d, 4s) and O(2s, 2p) states in the valence. Reciprocal space was sampled using a 4x4x4 Monkhorst-Pack mesh Monkhorst and Pack (1976) for the 2x2x2 supercell used to describe the structure containing the fully relaxed AFD. Electron doping was performed by adding extra charge carriers to the cell while applying a neutralizing background charge.
Appendix C The frequency of the soft modes
Our model predicts some unusual effect with regards to isotope replacement. One of them is the softening of the lowest frequency mode. This frequency, , is given by Eq. (2) in the main text. By using our model for the dependence of the tunneling energy on the 18O fraction (Eq. (8) in the main text) we can explicitly calculate the change of this frequency with respect to the 18O fraction ():
| (9) |
For this thus always lowers the mode frequency as the 18O fraction is increased, taking the system closer to the QCP.
Appendix D Equation for the change of
Using Eq. (7) in the main text, we can calculate the change in as a function of . We obtain
| (10) |
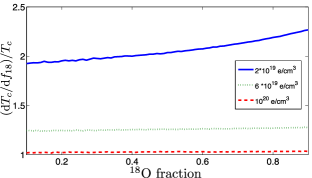
A careful study of this expression shows it to be positive for , as both the numerator and denominator are positive. More insight into this function can be gained from its plot, see Fig. 5. Apart from the fact that the change of is positive, we can see that it is larger for lower doping, i.e. when the system is closer to the QCP. This explains the shift of the peak of the dome to lower doping with increasing 18O fraction. For very small doping we can see that increases for large , implying a non-linear dependence on the mass. This suggests that the system is very close to the QCP, in contrast to the case of moderate and large doping, where the change is roughly constant for the available mass variation.
References
- Togo et al. (2008) A. Togo, F. Oba, and I. Tanaka, Phys. Rev. B 78, 134106 (2008).
- Perdew et al. (2008) J. P. Perdew, A. Ruzsinszky, G. Csonka, O. Vydrov, G. Scuseria, L. Constantin, X. Zhou, and K. Burke, Phys. Rev. Lett. 100, 136406 (2008).
- Kresse and Hafner (1993) G. Kresse and J. Hafner, Phys. Rev. B 47, 558 (1993).
- Kresse and Hafner (1994) G. Kresse and J. Hafner, Phys. Rev. B 49, 14251 (1994).
- Kresse and Furthmuller (1996a) G. Kresse and J. Furthmuller, Comp. Mater. Sci. 6, 15 (1996a).
- Kresse and Furthmuller (1996b) G. Kresse and J. Furthmuller, Phys. Rev. B 54, 11169 (1996b).
- Blöchl (1994) P. E. Blöchl, Phys. Rev. B 50, 17953 (1994).
- Kresse and Joubert (1999) G. Kresse and D. Joubert, Phys. Rev. B 59, 1758 (1999).
- Monkhorst and Pack (1976) H. J. Monkhorst and J. D. Pack, Phys. Rev. B 13, 5188 (1976).