Revisiting the vortex-core tunnelling spectroscopy in YBa2Cu3O7-δ
Abstract
The observation by scanning tunnelling spectroscopy (STS) of Abrikosov vortex cores in the high-temperature superconductor YBa2Cu3O7-δ (Y123) has revealed a robust pair of electron-hole symmetric states at finite subgap energy. Their interpretation remains an open question because theory predicts a different signature in the vortex cores, characterised by a strong zero-bias conductance peak. We present STS data on very homogeneous Y123 at 0.4 K revealing that the subgap features do not belong to vortices: they are actually observed everywhere along the surface with high spatial and energy reproducibility, even in the absence of magnetic field. Detailed analysis and modelling show that these states remain unpaired in the superconducting phase and belong to an incoherent channel which contributes to the tunnelling signal in parallel with the superconducting density of states.
I Introduction
The interaction responsible for high-temperature superconductivity in the cuprates has remained elusive until now. Various charge orders Hoffman et al. (2002); Lawler et al. (2010); Ghiringhelli et al. (2012); Chang et al. (2012); Comin et al. (2014) suggest that the electron matter in these compounds experiences competing interactions, while numerous spectroscopic data support the scenario of preformed pairs gaining coherence at low temperature Renner et al. (1998a); Kanigel et al. (2008); Yang et al. (2008); Mishra et al. (2014); Kondo et al. (2015). The vortices offer a chance to disentangle the spectral features related to pairing from those that are unrelated Fischer et al. (2007). In this context the observation of discrete states in the vortex cores Maggio-Aprile et al. (1995); Renner et al. (1998b); Hoogenboom et al. (2000); Shibata et al. (2010); Levy et al. (2005); Yoshizawa et al. (2013) has been a considerable challenge for theory Arovas et al. (1997); Franz and Tešanović (1998); Andersen et al. (2000); Kishine et al. (2001); Berthod and Giovannini (2001); Zhu and Ting (2001); Tsuchiura et al. (2003); Fogelström (2011), because the calculated tunnelling spectrum in a vortex of symmetry presents a broad continuous maximum centred at zero bias not observed in the experiments.
Here we present high-resolution scanning tunnelling microscopy (STM) measurements of YBa2Cu3O7-δ (Y123), the first high-temperature superconductor to reveal a pair of electron-hole symmetric subgap conductance peaks when tunnelling into a vortex core Maggio-Aprile et al. (1995). This cuprate was chosen to revisit the vortex core spectroscopy by STM because the subgap peaks are significantly stronger than analogous low-energy spectroscopic structures reported for other cuprates Levy et al. (2005); Yoshizawa et al. (2013). It furthermore shows spatially homogeneous tunnelling spectroscopy, paramount to consistently map the spatial extent of the subgap states in the vicinity of vortex cores. Our study shows that these discrete states are not a specific signature of the vortex cores, but are ubiquitous in zero field, even in spectra lacking superconducting coherence peaks. These results reshuffle the cards for the vortex core description in Y123 and shed new light on its low-temperature non-superconducting state.
II Results
II.1 Persistence of subgap states in zero field and outside vortices
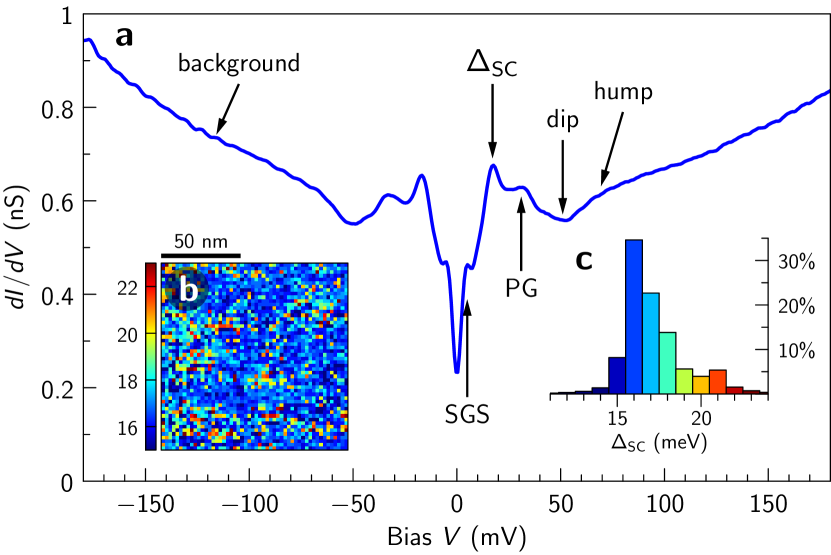
We study the low-energy spectral features of Y123 in very homogeneous conductance maps measured along the (001) surface at 0.4 K. Figure 1 shows the average of 2704 spectra recorded over a nm2 area in zero field. The persistence of sharp features in this average demonstrates the low variability of the spectral properties across the area, as well as the low noise level of the instrument. On top of a V-shaped background with a finite zero-bias conductance, which are common on as-grown Y123 surfaces, we identify five robust particle-hole symmetric spectroscopic features as labeled in Fig. 1. We shall not discuss here the hump, the dip, and the pseudogap (PG), but focus on the superconducting coherence peaks (SC) near meV, and especially on the subgap states (SGS) at meV. We confirm the surface homogeneity by studying the spatial and statistical distributions of the superconducting gap , defined as half the energy separation between the two SC peaks (Fig. 1b and c). The average gap is 17.2 meV with a standard deviation of 1.9 meV, corresponding to a ratio where is the Boltzmann constant and is the critical temperature. This gap uniformity in Y123 contrasts with the case of Bi-based cuprates, where up to 50% inhomogeneity is often observed in the gap values, even at optimal doping and for samples with sharp superconducting transitions. Most remarkable in Fig. 1 are the subgap states at meV. Until now this structure had only been clearly resolved as peaks inside the vortices Maggio-Aprile et al. (1995); Shibata et al. (2010). Much weaker subgap shoulders were occasionally observed in zero field or outside vortices. The natural interpretation has been that the structure would be strongly enhanced in the vortex cores, suggestive of a phenomenon competing with superconductivity. Our measurements show that this is not the case: the structure is as strong in zero field as it is in the vortex cores. The well-defined subgap peaks in the average spectrum show that the energy of this structure does not vary appreciably along the surface.
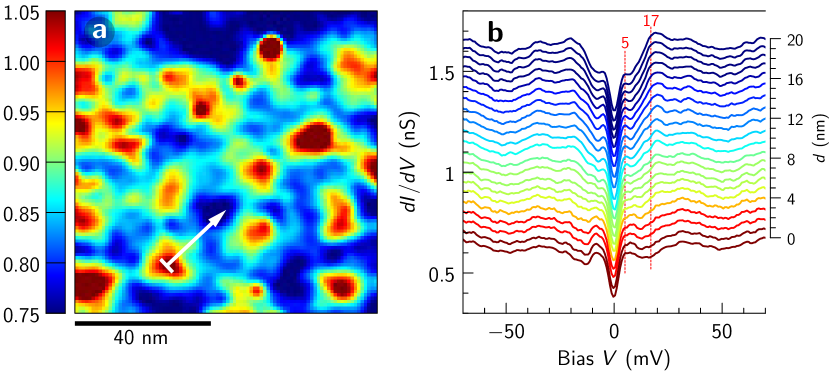
Applying a field of 6 T perpendicular to the Cu-O planes, we observe vortices as shown in Fig. 2a. The vortices are imaged by mapping the ratio of the conductance at 5 and 17 meV, denoted . Outside the vortices the coherence peaks are well developed and the ratio is typically 0.75; this is slightly larger than the value in zero field (0.7), because the SC peaks are smeared due to nearby vortices. Inside the vortices the ratio increases up to values above unity as the coherence peaks get totally suppressed. The spatial evolution of the conductance from the vortex core to the inter-vortex region (Fig. 2b) shows unambiguously that the SGS feature is not localized inside vortices, and is the same structure as the one seen in zero field. The outstanding features of this trace are independent of direction away from the vortex core, although their relative amplitudes do depend on the proximity of neighbouring cores.
II.2 Absence of correlation between subgap states and vortices
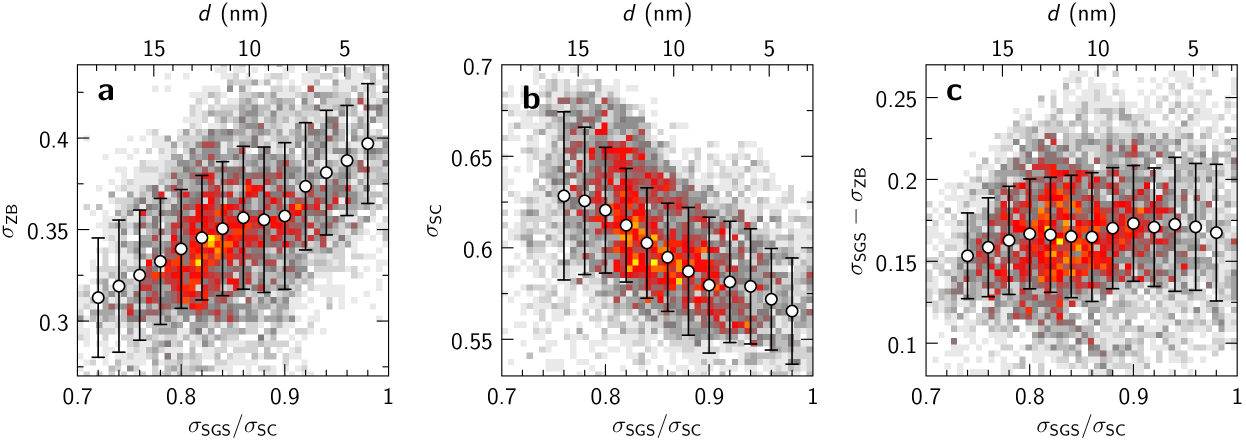
Figure 2b gives the visual impression that the SGS peaks are reinforced in the vortex. Upon closer inspection, this turns out to be an illusion created by the suppression of the coherence peaks in the core. In fact the pseudogap, dip, hump, and background all remain virtually unchanged upon entering the vortex. The only noticeable spectral changes along the way are an increase of the zero-bias (ZB) conductance and a suppression of the coherence peaks. The ZB conductance has a spatial distribution analogous to the conductance ratio displayed in Fig. 2a, although with a weaker contrast. This is illustrated in Fig. 3a, which shows a good statistical correlation between the ZB conductance and , both increasing when approaching the vortex core at . As expected for a weakening superconducting order parameter inside vortices, we find a clear negative correlation between the SC peak height and . In order to quantify the amount of correlation between the SGS and the vortex position, we define the amplitude of the SGS as their height above the ZB conductance, measured by the difference . As illustrated in Fig. 3c, the amplitude of the subgap states is completely uncorrelated with the vortices. This is our central result.
III Discussion
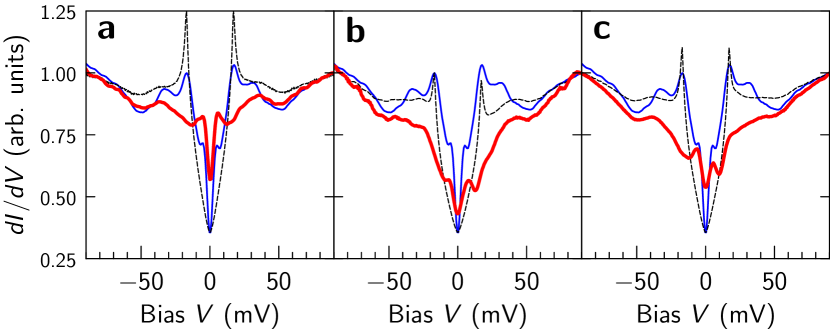
The good correlation between the SC peaks and and the absence of correlation between the SGS and imply that there is no correlation between the SGS and the SC peak, as we have verified in the experimental data. Figure 4 confirms the lack of sensitivity of the SGS to the superconducting coherence. A vortex-core spectrum (Fig. 4a) is compared with two zero-field spectra without coherence peaks, at a twin boundary Deutscher and Müller (1987) (Fig. 4b), and inside an extended region of the sample surface where no superconducting coherence was detected (Fig. 4c). All three spectra present the SGS feature at the same energy on top of different backgrounds. The PG feature appears to be also present in all three cases.
STM topography reveals atomically flat terraces (roughness below 0.2 nm) separated by full (1.2 nm) or fractional (0.4–0.8 nm) unit-cell steps as well as twin boundaries. The absence of atomic resolution prevents a positive identification of the surface layer. But it does not preclude the interpretation of the tunnelling spectra in terms of intrinsic superconducting Y123 properties as the following compelling evidences show. The gap defined by the coherence peaks satisfies the characteristic features expected for the superconducting gap of bulk Y123: its amplitude matches other bulk probes and is in close agreement with the BCS value of 4.3 for an order parameter of symmetry; the coherence peaks vanish upon warming through the bulk superconducting transition temperature, in the vicinity of twin boundaries, and when entering a vortex core. The very high reproducibility of the other spectral features as a function of surface preparation, time, applied magnetic field, distance from vortex cores, step edges, and twin boundaries makes it extremely unlikely that they reflect electronic surface states. The latter are usually not as robust and one would expect modifications near step edges and twin boundaries. Lastly, there is a perfect match between the superconducting gap features measured by STM and point contact Andreev–Saint-James spectroscopy, as expected Deutscher (1999). This body of evidences unquestionably links with Y123 bulk superconductivity and rules out electronic surface states to explain the other features. We can also exclude that the SGS mark a proximity-induced or mixed or order parameter. In that case the SGS would shift to lower energy and ultimately disappear when approaching the vortex centres where phase coherence is lost, in clear contradiction with our data. Finally, the persistence of the SGS excludes their interpretation as vortex-core states or features of another state that would compete with superconductivity and pop up in the vortices.
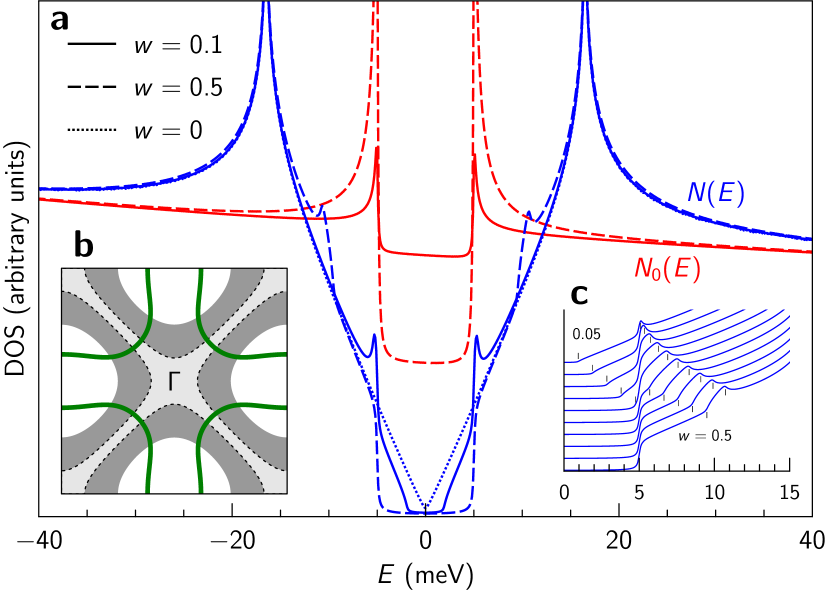
An obvious question is whether the non-superconducting spectra shown in Fig. 4 represent the normal-state DOS from which superconductivity emerges. Considering an isotropic normal state (i.e., with dispersion depending only on the modulus of ) characterized by a DOS , we find that, in the presence of a -wave order parameter , the BCS DOS can be written as
| (1) |
The derivation is given in Supplementary Note 1. Taking the spectra of Fig. 4 for , meV, and meV, we obtain the superconducting DOS shown as dashed lines in each panel. It is clear that the SGS are completely washed out, unlike in the experiment (Fig. 1). A feature of the normal-state DOS at energy indeed gets spread over an energy range by the -wave gap: high-energy features like the PG at remain sharp, but low-energy features are typically smeared over a range . Illustrations can be found in Supplementary Figure 1.
The picture emerging from our data is that the SGS exist independently of magnetic field and are not affected by the opening of the superconducting gap. Two possible scenarios are compatible with the latter observation: the SGS either belong to an atomic layer different from the superconducting copper oxide planes or they are confined to the nodal regions in momentum space in the superconducting layers. In the first scenario the tunnelling spectrum would be a superposition of two distinct contributions: one from non-superconducting electrons characterized by the robust and homogeneous SGS as well as the ubiquitous high ZB conductance, another from the superconducting condensate responsible for the fragile coherence peaks. Indeed the spectrum of Fig. 1 can be perfectly reproduced by summing a pure -wave spectrum and a background conductance similar to the spectra of Fig. 4 (see Methods). In this model the background forms the dominant spectral contribution to account for the large zero-bias and V-shaped background conductances systematically observed in Y123 tunnelling spectra. It may also explain why the vortex cores do not show the expected BCS spectrum (Figure 2b). Note that our data does show an increase of the ZB conductance in the cores (Figs. 3a and 4a), which may well be related to the predicted -wave zero-bias anomaly that is obscured by the SGS.
The second scenario assumes the SGS coexist with the superfluid condensate in the copper oxide planes. Then the SGS have to be confined to the nodal regions in momentum space where the superconducting gap is small. Otherwise they would have to shift or broaden like in Fig. 4 as the gap opens in the superconducting regions, in contradiction with the observations in Figs. 1 and 2. Supplementary Figure 2 presents a toy model exhibiting this property. A recent study reports particular spectroscopic signatures from the nodal regions in momentum space, however without an obvious link to the subgap states Sebastian et al. (2014).
In either scenario it is tempting to link the SGS with the static charge density wave (CDW) discovered recently in Y123 Ghiringhelli et al. (2012); Chang et al. (2012). On one hand, the temperature scale of this phenomenon ( K at optimal doping, see e.g. Ref. Blanco-Canosa et al., 2014) agrees well with the energy separation between the SGS peaks. On the other hand seemingly similar subgap structures observed in Bi2212 vortices Hoogenboom et al. (2000) display a modulated real-space pattern Hoffman et al. (2002); Levy et al. (2005); Yoshizawa et al. (2013). An explicit link between such conductance patterns seen by STM and the CDW was demonstrated in Bi2201 Comin et al. (2014). Preliminary data suggest similar real-space modulation of the SGS in Y123, but further experiments are under way.
In summary, we report the observation by STM of low-energy (5 meV) particle-hole symmetric states in Y123. These states, seen previously only in vortex cores, are in fact a robust property of Y123, insensitive to the magnetic field and to the superconducting coherence. The subgap states often take the form of peaks in the tunnelling spectrum when the superconducting coherence peaks are absent, but thanks to high-resolution measurements we also see them as peaks even in spectra with superconducting coherence peaks. This new phenomenology redefines the question of the spectroscopy of vortices in the cuprates. Whether the new energy scale is a pairing scale, as its particle-hole symmetry suggests, whether it is connected to the Cu-O chains or has to do with some charge ordering, as suggested by similar features in Bi2212, remain open questions at this stage.
IV Methods
Sample preparation. The experiments were conducted on as-grown (001) surfaces of highly pure YBa2Cu3O7-δ single crystals, grown in BaZrO3 crucibles Erb et al. (1995). The samples were annealed in pure oxygen to reach an optimal doping with K. Both as-grown and chemically etched surfaces were investigated. As-grown surfaces were simply rinsed in ethanol in an ultrasonic bath before insertion into the STM. Chemical etching was done by immersion for 1 minute in a solution of 1% bromine and 99% ethanol, followed by rinsing in ethanol and transfer to the vacuum chamber with less than 5 minutes exposure to air. All data reported here were measured on as-grown surfaces, except the spectra in Figs. 4b and 4c which were measured on chemically etched surfaces. The spectra are independent of surface preparation. They are reproducible over time and after repeated thermal cycling and exposure to air on untreated surfaces, and likewise on etched surfaces if the etching is repeated.
High resolution STS measurements. We used a home-built high vacuum variable temperature STM optimized for high energy resolution, with a base temperature of 0.4 K, and chemically etched tips made of pure iridium. Tunnelling spectra were acquired in zero magnetic field and in a field of 6 T oriented along the surface normal. The curves, providing a measure of the electronic local density of states, were obtained by numerical differentiation of the measured characteristics. For measurements done on as-grown surfaces, the junction resistance was increased to 12 G when moving the tip over these surfaces (as opposed to 1.2 G in the spectroscopy mode), in order to avoid that contaminants stick to the tip during its motion. For the etched surfaces the junction resistance was kept at 1.2 G during scanning and spectroscopy. Both procedures result in atomically flat surfaces allowing reproducible imaging and spectroscopy.
Two-channel model for the Y123 spectrum. We assume that the Y123 tunnelling spectrum gets parallel contributions from a two-dimensional band distorted by the coupling to spin excitations and subject to conventional BCS -wave pairing, and from a non-superconducting incoherent bath:
| (2) |
is the DOS of the BCS band and represents the tunneling matrix element for this band, while and are the matrix element and the DOS for the non-superconducting bath, respectively. In the non-superconducting regions of the surface the coherent band turns normal with a DOS and the differential conductance becomes
| (3) |
The matrix elements are in general different in the two types of regions: the constant-current STM setpoint regulation may change the relative contributions of the two channels when the coherent band becomes normal and its mobility drops. We will assume that the spectrum measured in the vortex cores is a good approximation for the spectrum of non-superconducting regions. Eliminating from Eq. (2) by means of Eq. (3), we are left with the model
| (4) |
We calculate and for a two-dimensional square lattice with a dispersion that reproduces the basic fermiology of Y123. We use the tight-binding parameters of the bonding band reported in Ref. Schabel et al., 1998. For simplicity we ignore the fourth and fifth neighbour hopping amplitudes and adjust the chemical potential in order to reach a hole concentration of 0.16. The resulting parameters are meV. Y123 is a bi-layer material with both bonding and anti-bonding bands, but there is considerable uncertainty regarding the precise properties of the anti-bonding band. We add an anti-bonding band via a bilayer coupling and determine by least-square fitting. The two-band model for the dispersion is
| (5) |
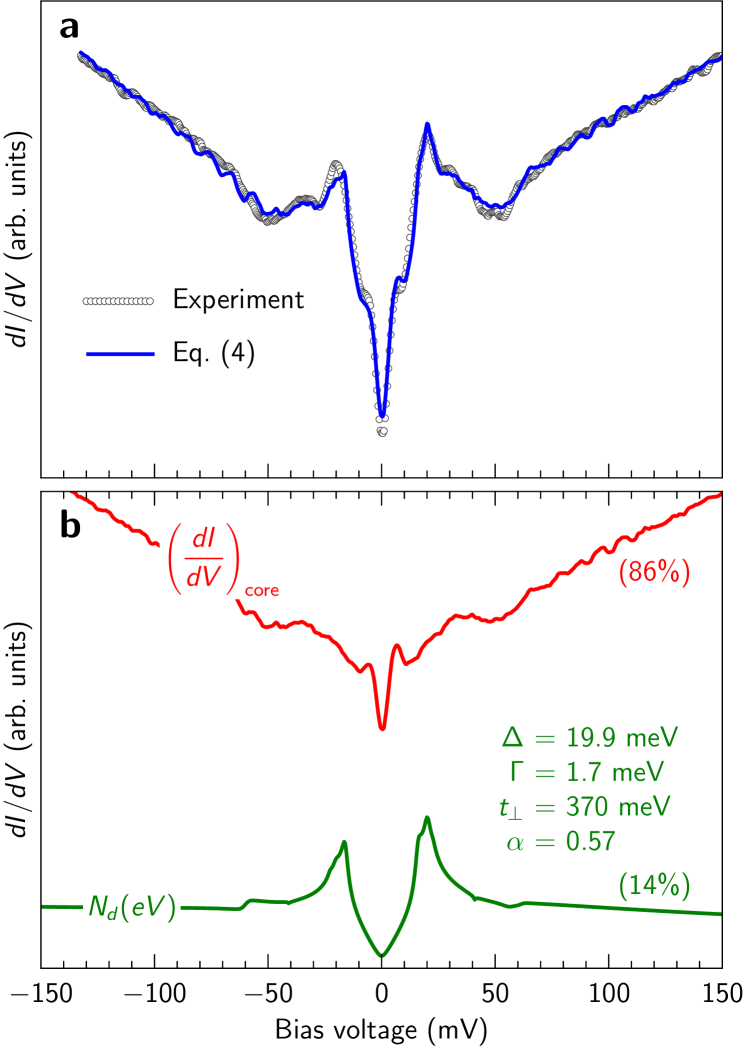
The interaction with the spin resonance is included using the approach described in Ref. Eschrig, 2006. Beside its energy meV, the parameters which characterize the spin resonance are its energy width and momentum width . As the resonance is sharp in Y123 we set . The resonance has a full width at half maximum 0.26 Å with the in-plane lattice parameter of Y123. We therefore take . The only remaining free parameter is a dimensionless coupling between the Bogoliubov-de Gennes quasiparticles and the spin mode Berthod et al. (2013). We determine the matrix elements , , , the model parameters and , as well as the gap and Dynes broadening by least-square fitting of the expression (4) to the DOS measured in-between vortices, which is very similar to the zero-field spectrum shown in Fig. 1.
The result of the fit is displayed in Fig. 5, where the fitted parameters are also reported. The fit yields , indicating that the coherent band is indeed invisible when it becomes normal; this supports an interpretation that this band would lie in the CuO plane below the surface and show up in the STM conductance only when it superconducts. The model captures well the asymmetric heights of the coherence peaks, the relative value of the zero-bias and background conductances, and the dips at positive and negative energies. Further refinements of the model, for instance by allowing the adjustment of all band parameters, could presumably improve the agreement even further.
Acknowledgements.
We acknowledge discussions with G. Deutscher and S.-H. Pan. We thank A. Guipet and L. Stark for their technical assistance. This research was supported by the NCCR MaNEP and the Swiss National Science Foundation.References
- Hoffman et al. (2002) J. E. Hoffman, E. W. Hudson, K. M. Lang, V. Madhavan, H. Eisaki, S. Uchida, and J. C. Davis, A Four Unit Cell Periodic Pattern of Quasi-Particle States Surrounding Vortex Cores in Bi2Sr2CaCu2O8+δ, Science 295, 466 (2002).
- Lawler et al. (2010) M. J. Lawler, K. Fujita, J. Lee, A. R. Schmidt, Y. Kohsaka, C. K. Kim, H. Eisaki, S. Uchida, J. C. Davis, J. P. Sethna, and E.-A. Kim, Intra-unit-cell electronic nematicity of the high- copper-oxide pseudogap states, Nature 466, 347 (2010).
- Ghiringhelli et al. (2012) G. Ghiringhelli, M. Le Tacon, M. Minola, S. Blanco-Canosa, C. Mazzoli, N. B. Brookes, G. M. De Luca, A. Frano, D. G. Hawthorn, F. He, T. Loew, M. Moretti Sala, D. C. Peets, M. Salluzzo, E. Schierle, R. Sutarto, G. A. Sawatzky, E. Weschke, B. Keimer, and L. Braicovich, Long-Range Incommensurate Charge Fluctuations in (Y,Nd)Ba2Cu3O6+x, Science 337, 821 (2012).
- Chang et al. (2012) J. Chang, E. Blackburn, A. T. Holmes, N. B. Christensen, J. Larsen, J. Mesot, R. Liang, D. A. Bonn, W. N. Hardy, A. Watenphul, M. v. Zimmermann, E. M. Forgan, and S. M. Hayden, Direct observation of competition between superconductivity and charge density wave order in YBa2Cu3O6.67, Nat. Phys. 8, 871 (2012).
- Comin et al. (2014) R. Comin, A. Frano, M. M. Yee, Y. Yoshida, H. Eisaki, E. Schierle, E. Weschke, R. Sutarto, F. He, A. Soumyanarayanan, Y. He, M. Le Tacon, I. S. Elfimov, J. E. Hoffman, G. A. Sawatzky, B. Keimer, and A. Damascelli, Charge Order Driven by Fermi-Arc Instability in Bi2Sr2-xLaxCuO6+δ, Science 343, 390 (2014).
- Renner et al. (1998a) C. Renner, B. Revaz, J.-Y. Genoud, K. Kadowaki, and Ø. Fischer, Pseudogap Precursor of the Superconducting Gap in Under- and Overdoped Bi2Sr2CaCu2O8+δ, Phys. Rev. Lett. 80, 149 (1998a).
- Kanigel et al. (2008) A. Kanigel, U. Chatterjee, M. Randeria, M. R. Norman, G. Koren, K. Kadowaki, and J. C. Campuzano, Evidence for Pairing above the Transition Temperature of Cuprate Superconductors from the Electronic Dispersion in the Pseudogap Phase, Phys. Rev. Lett. 101, 137002 (2008).
- Yang et al. (2008) H.-B. Yang, J. D. Rameau, P. D. Johnson, T. Valla, A. Tsvelik, and G. D. Gu, Emergence of preformed Cooper pairs from the doped Mott insulating state in Bi2Sr2CaCu2O8+δ, Nature 456, 77 (2008).
- Mishra et al. (2014) V. Mishra, U. Chatterjee, J. C. Campuzano, and M. R. Norman, Effect of the pseudogap on the transition temperature in the cuprates and implications for its origin, Nat. Phys. 10, 357 (2014).
- Kondo et al. (2015) T. Kondo, W. Malaeb, Y. Ishida, T. Sasagawa, H. Sakamoto, T. Takeuchi, T. Tohyama, and S. Shin, Point nodes persisting far beyond in Bi2212, Nat. Commun. 6, 7699 (2015).
- Fischer et al. (2007) Ø. Fischer, M. Kugler, I. Maggio-Aprile, C. Berthod, and C. Renner, Scanning tunneling spectroscopy of high-temperature superconductors, Rev. Mod. Phys. 79, 353 (2007).
- Maggio-Aprile et al. (1995) I. Maggio-Aprile, C. Renner, A. Erb, E. Walker, and Ø. Fischer, Direct Vortex Lattice Imaging and Tunneling Spectroscopy of Flux Lines on YBa2Cu3O7-δ, Phys. Rev. Lett. 75, 2754 (1995).
- Renner et al. (1998b) C. Renner, B. Revaz, K. Kadowaki, I. Maggio-Aprile, and Ø. Fischer, Observation of the Low Temperature Pseudogap in the Vortex Cores of Bi2Sr2CaCu2O8+δ, Phys. Rev. Lett. 80, 3606 (1998b).
- Hoogenboom et al. (2000) B. W. Hoogenboom, C. Renner, B. Revaz, I. Maggio-Aprile, and Ø. Fischer, Low-energy structures in vortex core tunneling spectra in Bi2Sr2CaCu2O8+δ, Physica C 332, 440 (2000).
- Shibata et al. (2010) K. Shibata, T. Nishizaki, M. Maki, and N. Kobayashi, Local spectroscopy and vortex-core imaging on chemically wet-etched surfaces of YBa2Cu3Oy by scanning tunneling microscopy/spectroscopy, Supercond. Sci. Technol. 23, 085004 (2010).
- Levy et al. (2005) G. Levy, M. Kugler, A. A. Manuel, Ø. Fischer, and M. Li, Fourfold Structure of Vortex-Core States in Bi2Sr2CaCu2O8+δ, Phys. Rev. Lett. 95, 257005 (2005).
- Yoshizawa et al. (2013) S. Yoshizawa, T. Koseki, K. Matsuba, T. Mochiku, K. Hirata, and N. Nishida, High-Resolution Scanning Tunneling Spectroscopy of Vortex Cores in Inhomogeneous Electronic States of Bi2Sr2CaCu2Ox, J. Phys. Soc. Jpn. 82, 083706 (2013).
- Arovas et al. (1997) D. P. Arovas, A. J. Berlinsky, C. Kallin, and S.-C. Zhang, Superconducting Vortex with Antiferromagnetic Core, Phys. Rev. Lett. 79, 2871 (1997).
- Franz and Tešanović (1998) M. Franz and Z. Tešanović, Self-Consistent Electronic Structure of a and a Vortex, Phys. Rev. Lett. 80, 4763 (1998).
- Andersen et al. (2000) B. M. Andersen, H. Bruus, and P. Hedegård, SO(5) theory of insulating vortex cores in high- materials, Phys. Rev. B 61, 6298 (2000).
- Kishine et al. (2001) J.-i. Kishine, P. A. Lee, and X.-G. Wen, Staggered local density-of-states around the vortex in underdoped cuprates, Phys. Rev. Lett. 86, 5365 (2001).
- Berthod and Giovannini (2001) C. Berthod and B. Giovannini, Density of States in High- Superconductor Vortices, Phys. Rev. Lett. 87, 277002 (2001).
- Zhu and Ting (2001) J.-X. Zhu and C. S. Ting, Quasiparticle States at a -Wave Vortex Core in High- Superconductors: Induction of Local Spin Density Wave Order, Phys. Rev. Lett. 87, 147002 (2001).
- Tsuchiura et al. (2003) H. Tsuchiura, M. Ogata, Y. Tanaka, and S. Kashiwaya, Electronic states around a vortex core in high- superconductors based on the - model, Phys. Rev. B 68, 012509 (2003).
- Fogelström (2011) M. Fogelström, Structure of the core of magnetic vortices in -wave superconductors with a subdominant triplet pairing mechanism, Phys. Rev. B 84, 064530 (2011).
- Deutscher and Müller (1987) G. Deutscher and K. A. Müller, Origin of superconductive glassy state and extrinsic critical currents in high- oxides, Phys. Rev. Lett. 59, 1745 (1987).
- Deutscher (1999) G. Deutscher, Coherence and single-particle excitations in the high-temperature superconductors, Nature 397, 410 (1999).
- Sebastian et al. (2014) S. E. Sebastian, N. Harrison, F. F. Balakirev, M. M. Altarawneh, P. A. Goddard, R. Liang, D. A. Bonn, W. N. Hardy, and G. G. Lonzarich, Normal-state nodal electronic structure in underdoped high- copper oxides, Nature 511, 61 (2014).
- Blanco-Canosa et al. (2014) S. Blanco-Canosa, A. Frano, E. Schierle, J. Porras, T. Loew, M. Minola, M. Bluschke, E. Weschke, B. Keimer, and M. Le Tacon, Resonant x-ray scattering study of charge-density wave correlations in YBa2Cu3O6+x, Phys. Rev. B 90, 054513 (2014).
- Erb et al. (1995) A. Erb, E. Walker, and R. Flükiger, BaZrO3: the solution for the crucible corrosion problem during the single crystal growth of high- superconductors REBa2Cu3O7-δ; RE = Y, Pr, Physica C: Superconductivity 245, 245 (1995).
- Schabel et al. (1998) M. C. Schabel, C.-H. Park, A. Matsuura, Z.-X. Shen, D. A. Bonn, R. Liang, and W. N. Hardy, Angle-resolved photoemission on untwinned YBa2Cu3O6.95. I. Electronic structure and dispersion relations of surface and bulk bands, Phys. Rev. B 57, 6090 (1998).
- Eschrig (2006) M. Eschrig, The effect of collective spin-1 excitations on electronic spectra in high- superconductors, Adv. Phys. 55, 47 (2006).
- Berthod et al. (2013) C. Berthod, Y. Fasano, I. Maggio-Aprile, A. Piriou, E. Giannini, G. Levy de Castro, and Ø. Fischer, Strong-coupling analysis of scanning tunneling spectra in Bi2Sr2Ca2Cu3O10+δ, Phys. Rev. B 88, 014528 (2013).
Supplementary Note 1
One-channel models for the spectrum of Y123 in zero field. One-channel models assume that the tunnelling conductance measured by STM on the surface of Y123 gets contributions from a single electronic band of dispersion , on top of a featureless background associated with transport channels of the as-grown surface and responsible for the large zero-bias conductance. In this frame of mind, the subgap peaks represent a property of the normal state which participates in pairing and is therefore gapped in the superconducting state. The dispersion defines a normal-state density of states (DOS)
| (S1) |
The opening of a superconducting gap changes the DOS into
| (S2) |
The quantity in brackets is the retarded single-particle Green’s function of a BCS superconductor with a gap function , and is a Dynes broadening parameter representing residual impurity scattering. We restrict ourselves to two-dimensional models.
Arbitrary isotropic normal state. We first consider a normal-state dispersion that is isotropic in the plane, , but otherwise arbitrary. The Fermi surface is circular, and the details of the normal-state DOS are controlled by the dependence of the dispersion on the modulus of . Any function can in principle be parametrized by a monotonically increasing radial dispersion , by solving the implicit equation . Our goal is to express the superconducting DOS (S2) in terms of the arbitrary function . For an -wave gap, this is straightforward:
| (S3) |
Hence for any normal-state DOS function , the one-channel -wave superconducting DOS for a gap magnitude can be computed by performing numerically the integral in (S3). If the superconducting state has -wave symmetry, the situation is more complicated because of the angular dependence of the gap. An explicit expression can nevertheless be obtained if the gap has the functional form . Let us write with
Working in cylindrical coordinates, we note that
Thus can be rewritten as a two-dimensional integral without angular momentum in the integrand, and then expressed in terms of the normal-state DOS:
| (S4) |
This leads to Eq. (1) of the main text.
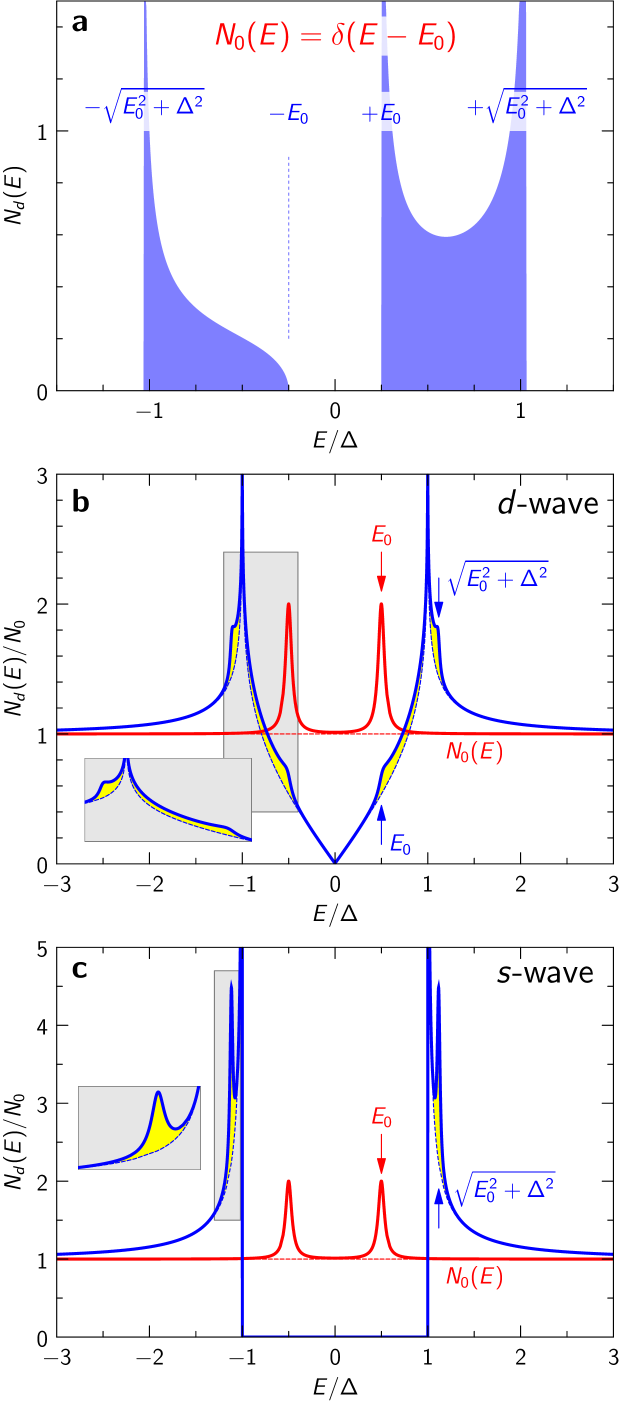
Supplementary Equation (Supplementary Note 1) shows that if the normal-state DOS has sharp structures, these structures are spread by the opening of the -wave gap. To see this, take and in (Supplementary Note 1). The resulting superconducting DOS has three square-root divergences at and and a square-root singularity at . The spectral weight of the delta peak is spread into the intervals between these two couples of singularities [Supplementary Figure S1(a)]. The case of a normal-state DOS that is the sum of a flat background and two symmetric peaks at is illustrated in Supplementary Figure S1(b) for -wave pairing and Supplementary Figure S1(c) for -wave pairing. While the peak structure remains visible in the -wave case, nothing but weak features subsist in the -wave case. In the main text it is shown that this one-channel model with an isotropic normal-state dispersion cannot explain the subgap peaks present in the STM spectra of Y123. A weak anisotropy of the dispersion will not change this conclusion qualitatively.
Strongly anisotropic normal state with nodal peaks. The failure of the one-channel isotropic model to account for the tunnelling spectrum of Y123 suggests to devise a strongly anisotropic model in which the two low-energy peaks in the normal-state DOS would be related to features localized near the nodal directions in reciprocal space. These features would not be broadened by the opening of the -wave gap and could survive in the superconducting spectrum. Such a model is somewhat contradictory. On the one hand, we need a structure with a well-defined energy to produce prominent peaks in the normal-state. This is usually associated with a localized state, a non-dispersing band, or any phenomenon with no dispersion in momentum space. But the absence of dispersion in momentum space is the quintessence of isotropy!
We can escape this paradox if the two symmetric peaks in the normal-state DOS are due to a gap in the normal-state dispersion, which vanishes away from the nodal regions. We therefore introduce a normal-state gap , where is the Heaviside function. The parameter controls the extension of the gapped region around the nodal lines, corresponding to no gap and to a fully gapped Fermi surface. The modified normal-state dispersion is . We try this model on a two-dimensional square lattice with the same dispersion as for the two-channel model presented in the Methods section, Eq. (5), but without interlayer coupling for simplicity (). The corresponding Fermi surface is shown in Supplementary Figure S2(b). Using the gapped dispersion with meV and a superconducting gap with meV, we calculate the normal and superconducting DOS using Supplementary Equations (S1) and (S2) and meV. The results are displayed in Supplementary Figures S2(a) and S2(c).
The model with indeed has two peaks from the normal-state DOS surviving in the superconducting DOS. A new energy scale appears below . This is because the superconducting gap at the edges of the gapped region is smaller than . Note that our choice of the function with the same functional form as implies that the edges of the gapped region are iso-contours of . At these edges we have simply meV. There are no Bogoliubov quasiparticles with energy lower than , such that the superconducting DOS is completely gapped below this energy. Between and , the momenta outside the gapped region contribute to the DOS, which approaches the curve from below, due to the missing states from the gapped regions. At we have the remnant of a normal-state square-root singularity of weight due to the nearly flat dispersion of states inside the gapped region, and above the superconducting dispersion returns to conventional, and so does the DOS.
For , the DOS vanishes below because and is the smallest gap on the Fermi surface. There is no peak at , the energy of the gapped states near the nodes being spread between and , where a weak peak remains. As seen in Supplementary Figure S2(c), the weight of the in-gap peak is independent of , despite the fact that in the normal-state DOS this weight is proportional to .
The model of Supplementary Figure S2 is as a proof of principle, but we consider unlikely that it explains the subgap states in Y123. The latter have a spectral weight comparable with the superconducting coherence peaks, while in Supplementary Figure S2 the weight of the in-gap peaks is tiny. More importantly, the measurements show that this weight remains the same in the superconducting and non-superconducting states, which is not the case in the model.